Analytic modeling and validation of strain in textile-based OLEDs for advanced textile display technologies

Introduction
In the Internet of Things (IoT) era, a surge in demand for sophisticated wearable technologies has been witnessed, reflecting a transformative shift towards more interactive and functional devices. Wearable displays, as a cornerstone of this evolution, play a pivotal role in melding digital connectivity with practical, daily use. Central to these advancements are organic light-emitting diodes (OLEDs), especially when integrated into textiles, marking a significant innovation in wearable technology. Textile-based OLEDs transcend their roles as mere enhancements in aesthetics or technology; they signify a profound development in wearable devices by offering unmatched flexibility, a lightweight framework, superior electrical attributes, and importantly, features that align closely with human needs and comfort3,4,5,6,7,8,9,10. The integration of OLEDs into textiles—materials intrinsic to human daily life due to their universal application in clothing—introduces unparalleled accessibility and a level of comfort that distinctly sets these devices apart from more rigid, traditional wearable types such as smartwatches and augmented reality (AR) hardware.
In line with the trend of these technological demands, the effort to integrate OLED technology seamlessly into textile materials has been characterized as focusing on engineering a planarization layer to ensure a smooth and uniform surface necessary for the optimal functioning of OLEDs on textiles with rough surfaces9. The challenge inherent in this approach is the creation of a layer sufficiently thin to avoid significantly altering the textile’s natural mechanical properties, such as its flexibility and texture. The imposition of any additional layer on the bare textile has the potential to increase its overall thickness and contribute to a less pliable, more rigid texture, detracting from the wearer’s comfort and the material’s wearability. A significant breakthrough in this area was achieved through the development of an ultra-thin planarization layer and strain buffer layer, utilizing materials that were carefully selected to minimize these adverse effects and thus maintaining the textile’s intrinsic qualities10,11,12.
However, despite these technological advancements, comprehensive and accurate modeling of the forms of mechanical stress that textile-based displays are subjected to remains insufficient, lagging behind the progress made in OLED fabrication and operational technologies. Existing research often relies on three main approaches: bending tests, analytical solutions based on the Euler-Bernoulli theory, and finite element analysis (FEA) using simplified plate models. Each of these methods has inherent limitations; Bending tests are useful for assessing display flexibility under repeated stress but fail to predict precise strain values on OLEDs at specific curvatures. Analytical solutions based on the Euler-Bernoulli formula assuming pure bending situation can provide rough strain predictions, but their validity for textile-based displays has not been fully verified. FEA simulations are undoubtedly a powerful method for predicting strain in the upper OLED layer, but up to now, the studies presented on textile-based displays have mostly simplified the textile model by replacing it with a plate of uniform properties and have primarily relied on modeling and simulation without comparisons to actual measurements, providing only limited insights into the behavior of the textile-based OLED structures.
To overcome these limitations, a new analytical framework has been developed to provide a more precise understanding of strain distributions within textile-based OLEDs. This framework incorporates stretching, bending, and shear energy across each textile layer, resulting in a novel energy equation for accurately calculating top surface strain. Validation of the model has been achieved through comparisons of calculated strain values with those obtained from DIC and FEA using ANSYS software, confirming the model’s precision across a range of bending radii and its potential impact on future wearable technology design.
As the potential of textile-based OLEDs to revolutionize the landscape of IoT and wearable technology becomes increasingly apparent, an intricate understanding of the mechanical properties of these devices is indispensable. By tackling the methodological limitations observed in existing research and introducing a more refined model for strain analysis, the efforts documented in this work seek to lay the groundwork for the creation of more robust, reliable, and versatile wearable displays. This contribution is not only pivotal to the ongoing academic discourse but also carries profound implications for the practical design and engineering of the forthcoming generation of textile-based wearable technologies.
Results and discussion
Finite element analysis (FEA)
Finite Element Analysis (FEA) is an analytical method that enables the simulation and modeling of complex geometries and material behaviors under various loading and environmental conditions. ANSYS software was employed due to its key advantages in FEA, including advanced meshing capabilities, extensive material modeling options, and customizable boundary conditions. This versatility allows for precise simulations of the mechanical response of textile substrates, particularly for predicting how different layers—such as the adhesive, planarization, and bare textile layers—affect overall mechanical performance. Nonlinear analyses and complex contact interactions are also supported by ANSYS, making it essential for evaluating material flexibility and durability in wearable electronics. In the pursuit of advancing wearable technology, particularly in structures where organic light-emitting diodes (OLEDs) are fabricated on textile substrates, mechanical modeling of these substrates is crucial for analyzing both the physical behavior of the textiles and, more specifically, the strain exerted on the integrated OLEDs. However, previous analyses of the mechanical properties of textile-based OLEDs often oversimplified these complex substrates. Typically, most studies of textile-based OLEDs have considered a multi-layered textile substrate as a single homogeneous entity. Moreover, they derived physical properties, such as the modulus of elasticity and Poisson’s ratio, from tensile tests of individual layers—textile, adhesive, and planarization—and then uniformly applied these properties across a generalized multi-layer plate model in FEA simulations10. While this method provides initial insights, it is insufficient if used to capture the intricate weave patterns and the properties of individual fibers, both of which critically influence the mechanical behavior of textiles under stress. Addressing these oversimplifications was pivotal; hence, establishing a realistic model of the textile substrate was paramount to ensure the robustness of the FEA simulations.
For the initial step of modeling for the FEA simulation, a microscopic analysis of a bare textile was undertaken to reveal the weave intricacy and fiber dimensions (Fig. 1a). These observations were then translated into a high-fidelity three-dimensional model that accurately represents the actual textile structure (Fig. 1b). This model, which treats each fiber as an independent element, overcomes the limitations of previous studies by accounting for the specific weave patterns and individual fiber properties that significantly influence the mechanical behavior under stress.

a Microscopic analysis of the bare textile (scale bar, 20 mm and 200 μm). b High-fidelity 3D model of the textile structure. c Schematic of the textile substrate (thicknesses: bare textile 220 μm, adhesive layer 19 μm, planarization layer 3 μm). d FEA simulation setup for the bending evaluation.
The substrate model essential for textile-based OLED configurations included not only a bare textile layer but also adhesive and planarization layers. The physical properties of these components were obtained from tensile tests and datasheets (Supplementary Fig. 1), providing a comprehensive representation of their mechanical behaviors. The thickness of each layer was precisely defined based on measured values, resulting in a multi-layered structure that accurately reflects the actual layering (Fig. 1c). This rigorous modeling approach lays the groundwork for highly accurate FEA simulations.
The finite element simulations utilized frictionless supports and a cylinder with radii of 2, 3, 4, 5, 6, 7.5, 9, and 10 mm to mimic the bending of the textile substrate, echoing the methodology of the three-point bending test13. This simulation effectively replicated the bending process, offering a means by which to evaluate the textile substrate’s practical response to deformation (Fig. 1d). These detailed simulation outcomes not only reflect the physical deformation of the textile but also provide a foundation for the strain analysis depicted in Fig. 2, which is visually rendered to highlight areas of strain critically.
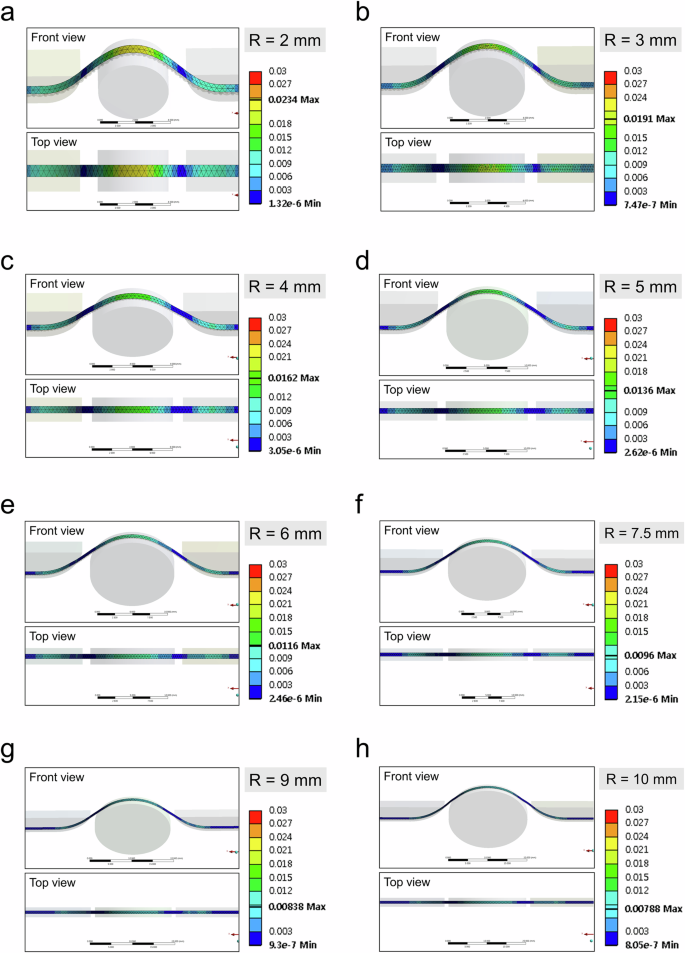
a–h Top surface strain distribution for each bending radius (R) ranging from 2 mm to 10 mm. The maximum strain values decrease as the bending radius increases: a R = 2 mm, 2.34% max; b R = 3 mm, 1.91% max; c R = 4 mm, 1.62% max; d R = 5 mm, 1.36% max; e R = 6 mm, 1.16% max; f R = 7.5 mm, 0.96% max; g R = 9 mm, 0.83% max; h R = 10 mm, 0.78% max.
Figure 2a–h illustrate the top-surface strain distribution of a textile substrate under varying bending radii, as obtained through FEA (with simulation videos showing the deformation available in Supplementary Movie 1). Each figure provides both front and top views of the strain distribution, using the same contact conditions and analysis settings applied across all analyses (Supplementary Fig. 2). Because the strain experienced by the OLED is most directly influenced by the planarization layer at the very top of the textile substrate, only the strain distribution for this layer is presented. As the bending radius increases from 2 mm to 10 mm, the surface strain decreases from 2.34% to 0.79%, indicating that the substrate deforms less with larger bending radii, as expected. The simulation data for the entire structure of the textile substrate, including the planarization layer, adhesive layer, and textile components, are detailed in Supplementary Fig. 3. This comprehensive set of figures validates the FEA model’s accuracy in predicting strain behaviors and offers a robust foundation for comparing with digital image correlation (DIC) results, reinforcing the reliability of the mechanical characterization of the textile substrates used in OLED integration.
Digital image correlation (DIC)
Digital image correlation (DIC), currently the foremost, continuously advancing a non-contact optical method that precisely measures surface deformation by tracking the relative displacement of patterns on the specimen surface14,15,16,17,18,19,20, is crucial for validating finite element analysis (FEA) results by providing empirical data that can be directly compared to simulation outcomes21. It provides highly accurate, full-field strain measurements in real time, making it suitable for complex textile substrates where strain distribution is non-uniform. Unlike traditional methods that calculate strain indirectly through load and elastic modulus measurements—prone to errors due to geometric and material variations—DIC measures strain directly with minimal error, typically around 0.005%.
This validation process ensures that FEA and DIC data are mutually consistent and reasonable, enabling accurate strain estimations and further optimizations of textile substrate designs by adjusting materials, thicknesses, or types of textiles to minimize the strain on the upper OLED structures.
To quantify the surface strain of textile substrates under bending conditions, black speckle patterns were applied on the top surface using commercial acrylic spray (SUPER THERM, Duplicolor, Germany) to prevent errors caused by the textile’s pattern, and a micro 2D-DIC analysis was conducted using an optical microscope (VHX-1000, Keyence)22, with images captured at the same location on the textile before and after bending to measure the induced strain, as illustrated in Fig. 3a. Bending conditions were created using acrylic cylinders with radii of 2, 3, 4, 5, 6, 7.5, 9, and 10 mm, and the textile substrates with the applied black speckle patterns were deformed by cylinders with each radius, with photographs of these deformed substrates shown in Fig. 3b. The strain measurements, which have an error of 0.005%, were processed using a commercial algorithm program (ARAMIS, Gesellschaft für Optische Messtechnik mbH) was employed to enhance data reliability by reducing noise and removing outliers, with a subset size of 66 pixels and a subset distance of 34 pixels used for the analysis.
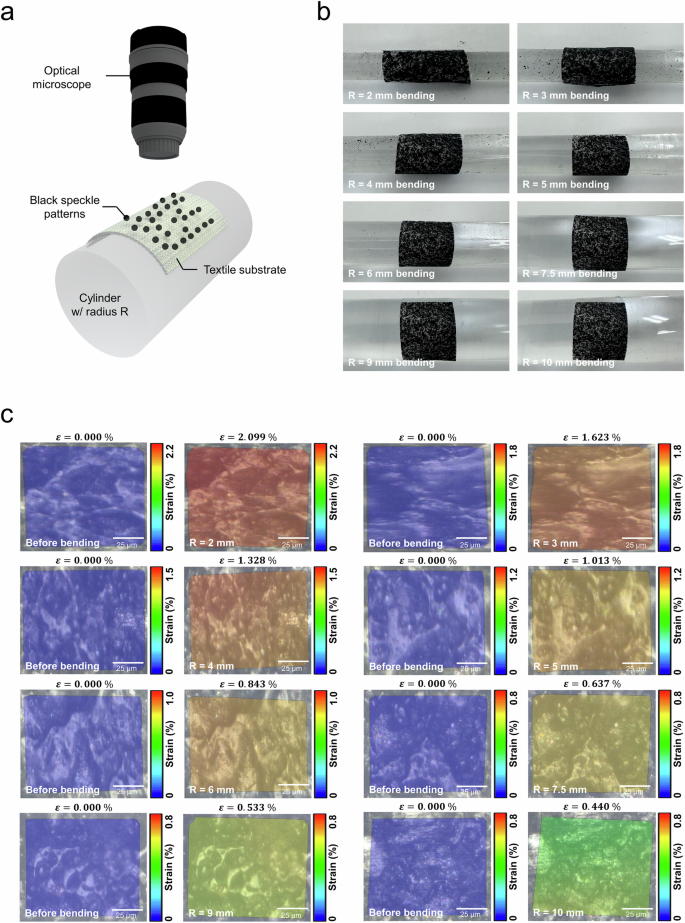
a Schematic of the DIC setup with an optical microscope and black speckle patterns on the textile substrate bent around a cylinder with radius R. b Photographs of the textile substrate with black speckle patterns under various bending radii: R = 2 mm, 3 mm, 4 mm, 5 mm, 6 mm, 7.5 mm, 9 mm, and 10 mm. c Strain maps obtained from DIC analyses before and after bending for each radius (R) showing the strain distribution on the textile substrate: R = 2 mm, 2.099% max; R = 3 mm, 1.623% max; R = 4 mm, 1.328% max; R = 5 mm, 1.013% max; R = 6 mm, 0.843% max; R = 7.5 mm, 0.637% max; R = 9 mm, 0.533% max; R = 10 mm, 0.440% max.
Detailed strain distribution data for each bending radius were obtained, as depicted in Fig. 3c. The strain maps indicated a slightly non-uniform strain distribution across the textile surface due to its unique deformation characteristics; accordingly, the surface strain values were obtained by integrating the strain values over specific areas. As the bending radius decreased, the strain values increased, with the integrated strain reaching 2.099% at a bending radius of 2 mm. This trend was consistent across all tested radii, showing a clear relationship between the bending radius and the surface strain, as confirmed by the FEA results.
These results serve as a crucial basis for validating the predictive accuracy of FEA models in simulating the mechanical behaviors of textile substrates under various mechanical bending conditions. After having confirmed the consistency between the FEA and DIC results, an analytic model will be established to calculate the surface strain of textile substrates. Ultimately, the combined use of FEA, DIC, and the subsequent theoretical calculations will allow for the mathematical determination of strain values without the need for further finite element simulations or empirical experimentation. Therefore, the work completed thus far with FEA and DIC will serve as a basis for comparison with the forthcoming analytic model, ensuring comprehensive validation across all three datasets.
Surface strain equation for a textile substrate through an analytic model
Figure 4 illustrates a three-layer sandwich structure, with each layer having a length of (2L) and thicknesses ({h}_{p}), ({h}_{a}), and ({h}_{t}) from the planarization layer to the bare textile, in its natural, unstressed state (Fig. 4a) and in a deformed state when wrapped around a cylinder with radius R (Fig. 4b). The Young’s moduli and Poisson’s ratios for these layers are ({E}_{p}), ({E}_{a}) and ({E}_{t}), and ({nu }_{p}), ({nu }_{a}) and ({nu }_{t}), respectively. Notably, the adhesive layer is considerably softer than both the planarization layer and the bare textile. This significant disparity in the Young’s modulus results in pronounced shear deformation primarily in the adhesive layer23. Additionally, although the bare textile layer has a higher Young’s modulus compared to the adhesive layer, it still experiences non-negligible shear deformation due to its lower Young’s modulus compared to the planarization layer. This behavior contrasts with the multiple layers with similar elastic properties or hard-soft-hard structures where shear deformation occurs only in the middle layer.
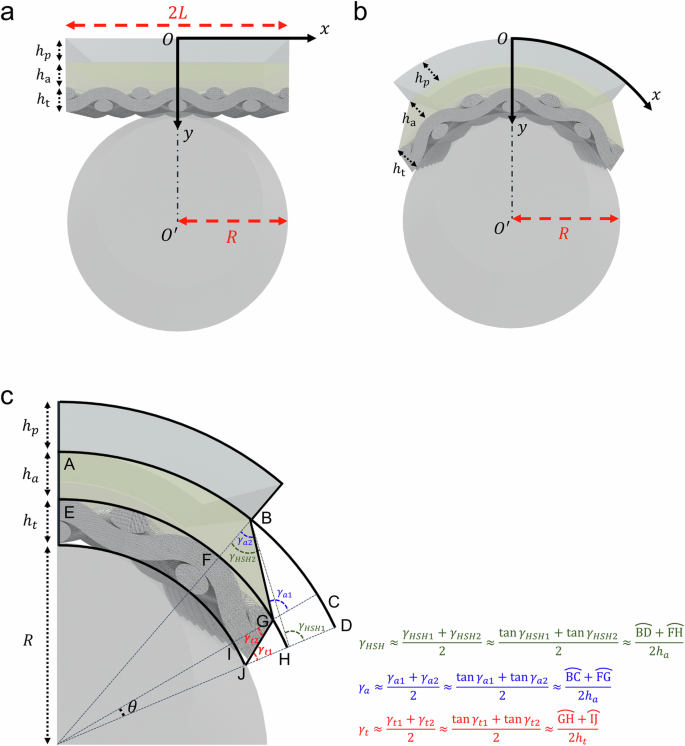
a Unstressed state of the three-layer sandwich structure with lengths and thicknesses labeled. b Deformed state of the structure when wrapped around a cylinder with radius R. c Detailed cross-sectional view of the layers showing shear strain components (({gamma }_{{HSH}}), ({gamma }_{a}), ({gamma }_{t})) and corresponding geometric relationships.
In line with previous studies that undertake analyses of hard-soft-hard three-layer structures, the initial step in establishing the analytical model begins similarly24,25. Due to the symmetry of the structure, the analysis is confined to the right half of the model, with the length denoted as L. Because multi-layer structures for flexible electronics and photonics are generally long and thin, the thickness changes of the layers are neglected26.
As shown in Fig. 4a, b, the coordinate x runs along the central axis of a layer, originating from the center point O. During deformation, let ({u}_{p}) and ({u}_{t}) represent the displacement increments at the central axes of the planarization layer and the bare textile, respectively. The associated membrane strains (({varepsilon }_{p}) and ({varepsilon }_{t})) and bending curvatures (({kappa }_{p}) and ({kappa }_{t})) are defined as
The variational approach27 is used to determine the governing equations in terms of the displacements (({u}_{p}) and ({u}_{t})). The total elastic energy, U, of the right half structure consists of the membrane energy and bending energy of the planarization layer and textile, as well as the shear energy of the adhesive layer and textile. We have total energy ({U}_{{total}}) defined as
where
are the flexural rigidity and membrane stiffness of the planarization layer and textile, respectively, and
are correspondingly the shear modulus of the adhesive layer and textile based on the classical beam theory28.
Derivation of shear strains ({{boldsymbol{gamma }}}_{{boldsymbol{a}}}) and ({{boldsymbol{gamma }}}_{{boldsymbol{t}}}) using ({{boldsymbol{gamma }}}_{{boldsymbol{HSH}}})
The shear strain component ({gamma }_{{HSH}}) is derived from the theoretical model of a three-layer sandwich structure in the research on hard-soft-hard (HSH) configurations24,25. The HSH structure is characterized by the assumption that the top and bottom layers do not undergo shear deformation, instead focusing all shear deformation in the significantly softer middle layer. This occurs due to the large mismatch in the Young’s modulus between the middle layer and the top and bottom layers. The relevant equation for the shear strain ({gamma }_{{HSH}}) presented in the model is as follows:
To derive the expressions for the shear strain components ({gamma }_{a}) and ({gamma }_{t}) using the known value ({gamma }_{{HSH}}), the structural assumptions and conditions depicted in Fig. 4c are considered. Specifically, the focus is on the relationship between the lengths (widehat{{rm{CD}}}) and (widehat{{rm{IJ}}}) and how these lengths can be approximated to facilitate the derivations.
({gamma }_{{HSH}}) can be decomposed as follows:
Given that (widehat{{rm{BC}}}) and (widehat{{rm{FG}}}) are directly related to the shear strain component ({gamma }_{a}) (as shown in Fig. 4c),
The remaining terms (widehat{{rm{CD}}}) and (widehat{{rm{GH}}}) are related to ({gamma }_{t}). Since (widehat{{rm{CD}}}=({rm{R}}+{h}_{t}+{h}_{a})theta) and (widehat{{rm{IJ}}}={rm{R}}theta), assuming that ({h}_{t}+{h}_{a}) is much smaller than (R), it follows that:
Therefore, the relationship between ({gamma }_{{HSH}}), ({gamma }_{a}), and ({gamma }_{t}) is expressed as
To express ({gamma }_{{HSH}}) in terms of the shear stress and shear modulus, the known relationships for shear strains ({gamma }_{a}) and ({gamma }_{t}) are used:
where ({tau }_{a}) and ({tau }_{t}) are the shear stress in the adhesive layer and textile, respectively.
Substituting these into Eq. (4) gives
Next, to derive the relationships among ({gamma }_{{HSH}}), ({gamma }_{a}), and ({gamma }_{t}) using the ratio of ({gamma }_{a}) to ({gamma }_{t}), the ratio is established first:
This ratio can be used to express ({gamma }_{t}) in terms of ({gamma }_{a}):
Substituting this back into Eq. (4),
Therefore, the relationship between ({gamma }_{{HSH}}) and ({gamma }_{a}) is expressed as follows:
Similarly, to express ({gamma }_{{HSH}}) in terms of ({gamma }_{t}), ({gamma }_{a}) is initially expressed in terms of ({gamma }_{t}):
Substituting this back into Eq. (4) results in
Therefore, the relationship between ({gamma }_{{HSH}}) and ({gamma }_{t}) is as follows:
These Eqs. (6) and (7) provide the relationships among ({gamma }_{{HSH}}), ({gamma }_{a}), and ({gamma }_{t}) in terms of the shear stress and shear modulus. To express the total elastic energy ({U}_{{total}}) in terms of these relationships, (eta =frac{{tau }_{a}{G}_{t}}{{tau }_{t}{G}_{a}}) is defined. This parameter represents the ratio of the shear strains in the adhesive and textile layers, as determined by their respective shear stresses at the interfaces and the shear moduli. Using this parameter, Eqs. (6) and (7) are rewritten as shown below.
Determination of maximum strain in OLEDs on textile substrates under bending conditions
Substituting these into the total elastic energy Eq. (2) and incorporating Eqs. (1) and (3), the total elastic energy ({U}_{{total}}) can be achieved, as follows:
To find the equilibrium conditions, the variation of the total elastic energy total with respect to the displacement fields must be considered. This leads to the following Euler-Lagrange equation for a general displacement field (u):
This equation represents the necessary condition for ({U}_{{total}}) to be at a stationary point, indicating the equilibrium configuration of the system. By solving this equation for (u), the equilibrium states of both ({u}_{p}) and ({u}_{t}) can be determined. The resulting governing equations are as follows:
where (a=frac{R,+,{h}_{t},+,{h}_{a}/2}{R,+,{h}_{t},+,{h}_{a},+,{h}_{p}/2}), (b=frac{R,+,{h}_{t},+,{h}_{a}/2}{R,+,{h}_{t}/2}) and ({G}^{{prime} }=frac{{G}_{t}{h}_{t}}{{h}_{a}^{2}{left(eta ,+,frac{{h}_{t}}{{h}_{a}}right)}^{2}},+,frac{{G}_{a}}{{h}_{a}{left(1,+,frac{{h}_{t}}{{h}_{a}}frac{1}{eta }right)}^{2}})
To establish the general solution, it is necessary to apply the boundary conditions, which are specified below.
These conditions indicate that there is no axial displacement at the midpoint and no axial strain at the ends of the textile substrate.
When fabricating textile-based OLEDs, material deposition occurs on top of the planarization layer. Therefore, our interest lies in ({u}_{p}) and (frac{d{u}_{p}}{{dx}}). By solving the general solution using the governing Eq. (9) and boundary condition (10), ({u}_{p}left(xright)) can be determined as follows:
where (c=sqrt{{a}^{2}{E}_{t}{A}_{t}+{b}^{2}{E}_{p}{A}_{p}}) and (d=sqrt{{E}_{t}{A}_{t}{E}_{p}{A}_{p}}).
To determine the maximum strain on OLEDs at the top of the textile substrate (at the top planarization layer), the strain ({varepsilon }_{p}left(xright)) must be found first by differentiating ({u}_{p}(x)) with respect to (x), which yields
When a textile-based OLED is bent to a radius (R), the maximum strain will be uniformly experienced at the top of the bend. Therefore, the strain experienced by the OLED is equivalent to the maximum strain value, which occurs at (x=0). To find this maximum strain ({varepsilon }_{p}^{max }), ({varepsilon }_{p}left(xright)) is evaluated at (x=0):
Effective radius of curvature of a textile substrate
Empirical evidence and several related research studies underscore the importance of considering the effective radius of curvature ({R}_{{eff}}) in textile bending tests. Specifically, several studies have demonstrated through DIC measurements that textiles exhibit a surface strain distribution that is not uniform but instead forms specific undulating patterns29,30. This phenomenon is hypothesized to result from the inherent structure of textiles, where fibers are pre-bent and twisted, leading to potential interactions such as fiber slippage during stretching and the presence of voids between fibers that allow for energy minimization by fiber penetration into these gaps, thereby reducing the overall energy and decreasing the surface strain.
Given these observations, it is evident that the traditional use of the radius (R) to represent the strain may not accurately reflect the actual strain experienced by the textile due to the reduction in strain caused by the undulating patterns. Therefore, using the effective radius of curvature ({R}_{{eff}}) instead of the actual bending radius (R) in strain calculations provides a more accurate representation of the textile behavior under a bending situation.
To determine ({R}_{{eff}}), the relationship derived from the Euler-Bernoulli (E-B) beam theory28 will be applied. Using this theory, the effective radius corresponding to the observed surface strain can be identified. The actual radius (R) will be matched one-to-one with the stretch ratio, and the corresponding ({R}_{{eff}}) will be matched one-to-one with the surface strain of the textile. Consequently, ({R}_{{eff}}) will be applied in the calculations to ensure that it corresponds to (R). This approach ensures that the calculated strain accurately reflects the behavior of the textile under bending conditions.
To validate this approach, several sets of data were obtained and analyzed. First, the surface strain of PET films, a representative isotropic material, was measured by means of DIC while gradually increasing the stretch at a rate of 2 mm/min. This data serve as a baseline for comparison with the textile strain behavior. Similarly, the surface strain levels of the textiles were measured using DIC under incremental stretching at the same rate. Strain mapping images for both the PET film and textile specimens are shown in Fig. 5a. Additionally, the strain distribution along a line profile for the textile specimen is presented in Fig. 5b, while for comparison, the strain distribution along a line profile for the PET film is shown in Fig. 5c. These figures show how the strain varies across each substrate, highlighting significant differences in the strain distribution patterns. Specifically, the textile specimens shows noticeable undulations in its surface strain, unlike the more uniform strain distribution observed in the PET films. As shown in Fig. 5d, the surface strain values for isotropic materials are nearly identical to their stretch ratio values, whereas the average strain values for textiles were consistently lower than the stretch ratio values, highlighting the unique deformation characteristics of textiles, which do not show the same strain-stretch ratio relationship as isotropic materials.
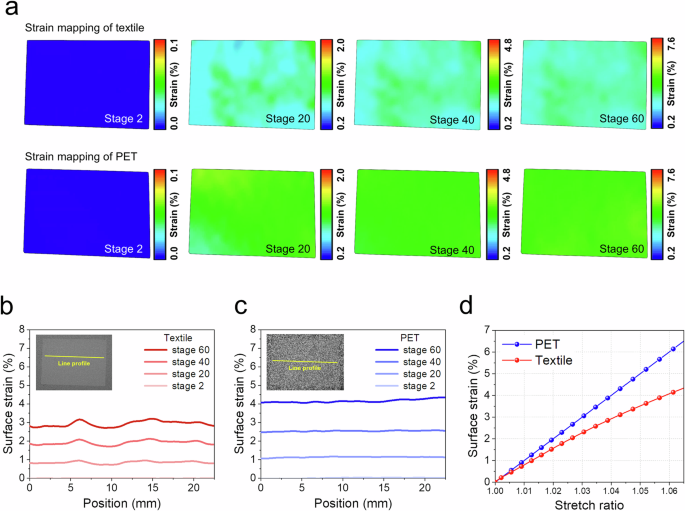
a Strain mapping of textile (top row) and PET (bottom row) at different stages (Stage 2, Stage 20, Stage 40, and Stage 60). b Surface strain distribution along a line profile for the textile specimen at different stages. c Surface strain distribution along a line profile for the PET film at different stages. d Comparison of the surface strain versus stretch ratio for textile and PET.
Using the E-B theory ((epsilon =frac{t}{2R}), which can be rearranged to (R=frac{t}{2epsilon })), the stretch ratio data for textiles were used to determine the actual bending radius (R). The corresponding effective radius ({R}_{{eff}}) was then calculated using the measured surface strain from DIC. This resulted in a one-to-one correspondence between (R) and ({R}_{{eff}}) for each stretch ratio, providing a comprehensive dataset for comparison (Supplementary Table 1). These datasets collectively demonstrate that while traditional methods using the actual radius R suffice for isotropic materials such as PET, textiles require the use of ({R}_{{eff}}) to ensure that their strain behaviors under bending conditions are accurately reflected. By incorporating ({R}_{{eff}}), the analytic model for textile substrates more accurately reflects the distinctive deformation characteristics of textiles, ensuring consistency and improved strain predictions.
Validation of the theoretical calculation with empirical data and simulation results
To validate the accuracy of the developed equation for calculating the surface strain of textile substrates, the calculated surface strain values were compared with empirical data from the DIC and simulation results from the FEA. The comparison revealed a close alignment between the strain values obtained from these three methods, underscoring the precision and reliability of the analytic model.
The geometric parameters and mechanical properties used for validation of the results, which are based on a textile substrate structure, are detailed in Supplementary Table 2.
Figure 6a shows the surface strain values resulting from the bending radii for the four methods: E-B theory (Supplementary Equation 1), the analytic model, DIC, and FEA. The results indicate that the predicted surface strain values from the equation closely match the measured strains from the DIC and the simulated strains from the FEA across various bending radii. Although it is important to note that as the bending radius decreases, the discrepancy between the results of the analytic model and those obtained from DIC and FEA becomes more pronounced due to the initial assumption that ({h}_{t}+{h}_{a}ll R), the analytic model still provides highly accurate predictions within practical bending curvatures. As this assumption becomes less valid with smaller bending radii (R), the differences between the calculated and measured values naturally increase. However, if future research can develop a method to accurately calculate the ratio of the shear strains (({gamma }_{a}) and ({gamma }_{t})) in the two films, independent of these simplifying assumptions, it could result in a more refined analytic solution. Consequently, this would enhance the model’s accuracy, allowing it to better represent real-world conditions even when the condition ({h}_{t}+{h}_{a}ll R) does not strictly hold. Despite these limitations, the strong correlation between the predicted and observed results under more practical conditions validates the robustness and accuracy of the analytic modeling approach, confirming that the proposed energy equation effectively captures the strain distribution in textile substrates.
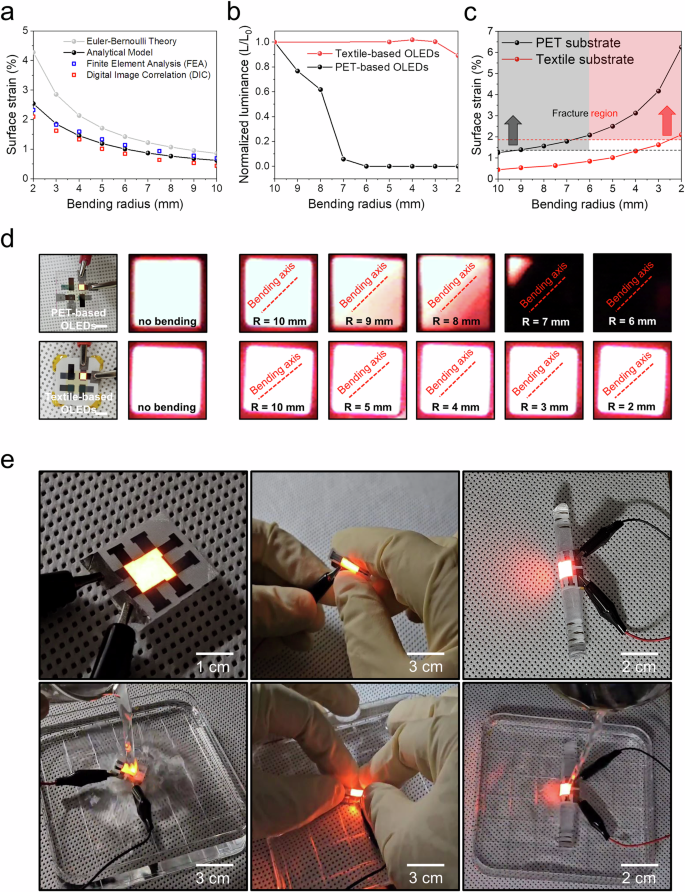
a Comparison of surface strain values calculated by the Euler-Bernoulli theory, the analytical model, FEA, and DIC under various bending radii. b Normalized luminance of textile-based red OLEDs and PET-based OLEDs as a function of the bending radius, ranging from 10 mm to 2 mm, after 1000 bending cycles. (Initial luminance (L0) = 1000 cd/m2). c Surface strain of the PET substrate and textile substrate as a function of the bending radius, ranging from 10 mm to 2 mm. d Emission images of PET-based and textile-based OLEDs after 1000 bending cycles at various bending radii. (The inset white bar corresponds to 6 mm). e Top row: The image on the left shows textile-based OLEDs in a non-stress state, the image in the middle shows the OLED in a folded state, and the image on the right displays textile-based OLEDs operating while bent by a cylinder with a 5 mm radius. Bottom row: The image on the left shows textile-based OLEDs submerged in water, the image in the middle captures textile-based OLEDs being folded underwater, and the image on the right demonstrates textile-based OLEDs operating as water is poured onto them.
To further explore the practical applications of this strain analysis, OLEDs with identical structures were fabricated on two different substrates: a 242 μm-thick textile substrate and a 250 μm-thick PET substrate. Subsequently, bending tests were conducted by varying the bending radius from 10 mm to 2 mm, with each radius undergoing 1,000 bending cycles. As shown in Fig. 6d, the emission images of OLEDs on both substrates under different bending radii indicate that the OLEDs on the PET substrate fractured at a larger radius than those on the textile substrate, confirming that the strain experienced on PET is higher at the same radius. Figure 6b further details the relative luminance of the OLEDs as a function of bending radius, enabling the identification of the specific radius at which fracture occurs for each substrate. Figure 6c presents the membrane strain values experienced on the PET and textile substrates at each bending radius, allowing for a comparison with Fig. 6b, c to determine the strain level at which the OLEDs fracture on both substrates. If the strain value at which failure occurs can be accurately determined, the equation proposed in this study can be utilized to predict the bending radius at which a textile-based OLED will endure before failure, even before the actual fabrication process, and provide guidance on optimizing the thickness and material properties of the substrates to enhance the durability and performance of textile-based OLEDs.
To showcase the practical robustness and flexibility of textile-based OLEDs, several tests were conducted, and corresponding images are presented in Fig. 6e. These images provide visual confirmation of the performance and durability of the textile-based OLEDs in various situations. The top row showcases textile-based OLEDs in different states: the image on the left shows textile-based OLEDs in a non-stress state, the image in the middle shows textile-based OLEDs in a folded state, and the image on the right displays textile-based OLEDs operating while bent by a cylinder with a radius of 5 mm. The bottom row mirrors these states but under water-related conditions: the image on the left shows textile-based OLEDs submerged in water, the image in the middle captures textile-based OLEDs being folded underwater, and the image on the right demonstrates textile-based OLEDs operating while water is poured onto them. The corresponding videos for these images can be found in Supplementary Movie 2.
Application of textile-based OLEDs to real wearable device design
The human body is composed of delicate joints that allow flexible bending, and even in cases without intentional movement, areas like the eyelids, nose, and lips exhibit a wide range of curvature values. Therefore, analyzing the mechanical characteristics of wearable displays in close proximity to the body is crucial. This analysis should be established before the device design phase, as it plays a vital role in determining the structural specifics of the device. Optimizing textile-based displays through this analysis can involve changes to the material or thickness of the substrate (Supplementary Fig. 6). As seen in Fig. 7, it is also possible to optimize the device design. This optimization process is demonstrated with a rigid-bent platform incorporating point light source LEDs for phototherapy, which has been replaced with a flexible and lightweight textile-based OLED mask designed for skincare purposes. Figure 7a illustrates the step-by-step fabrication process and assembly of the OLED mask, including a final product image. The assembly connects the OLEDs to a flexible printed circuit board (FPCB) and covers them with a bare textile to enhance comfort and conceal the underlying technology. This design prevents failures in areas with high curvature, such as the nose, eyelids, and lips, making it an excellent example of practical design optimization. Figure 7b provides a schematic of the textile-based OLED’s layered structure, detailing the arrangement of the textile substrate and OLED components. Figure 7c–e show the electro-optical properties of the fabricated textile OLEDs. Since OLEDs are highly susceptible to moisture, encapsulation on the top and bottom is necessary. The encapsulation structure, shown in Fig. 7f, utilizes an organic/inorganic one-dyad layer structure to achieve both moisture protection and flexibility. The inorganic layer consists of a nanolaminate of Al2O3 and TiO2, which provides high moisture barrier performance even at low temperatures (40 °C), minimizing thermal deformation in polyester textiles4. Parylene-C was selected for the organic layer due to its biocompatibility and its ability to be deposited via CVD without spin coating, making it ideal for large-area textile-based OLEDs. The improved lifetime of the OLED, shown in Fig. 7g, demonstrates its enhanced durability. Additionally, as seen in Fig. 7h and Supplementary Movie 3, the OLED continues to function normally even when submerged in water. Finally, the fully assembled textile-based OLED mask was integrated with the FPCB, demonstrating a lightweight, flexible, and planar light source, as shown in Fig. 7i and Supplementary Movie 4. The final textile-based display, optimized through these processes, would significantly reduce the stress typically associated with rigid and heavy wearable devices. The enhanced accessibility and comfort of this platform make it a highly desirable solution for future wearable devices, aligning with evolving technological demands and user preferences. This approach not only represents a critical advancement toward the future of wearable devices but also sets a foundational benchmark for the design and development of textile-based displays in wearable technology.
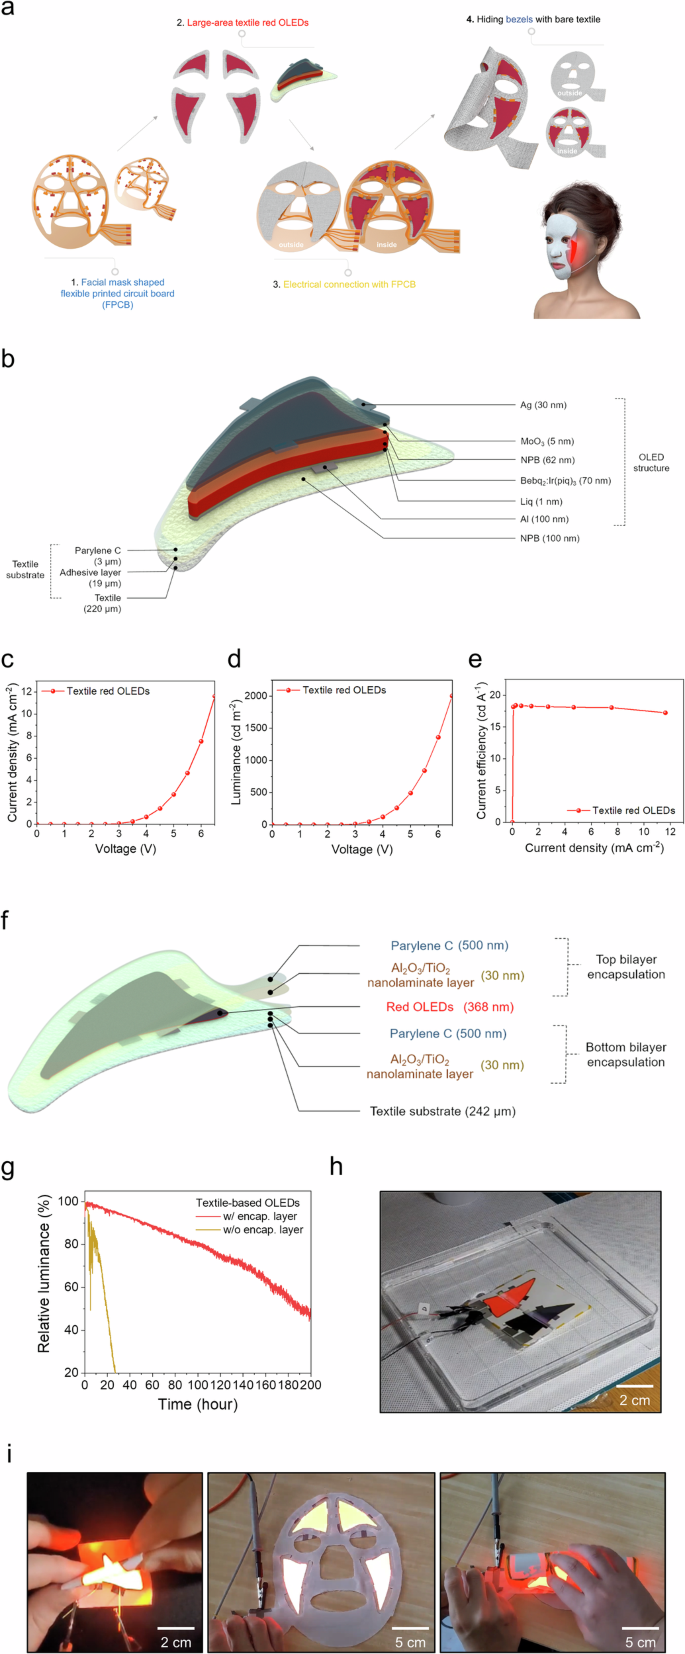
a Fabrication steps of the textile-based OLEDs facial mask. b Schematic illustration of the textile-based OLEDs structure, showing the layers of the textile substrate and the upper OLEDs components. c Current density of textile-based OLEDs as a function of the voltage (J–V). d Luminance of textile-based OLEDs as a function of the voltage (L–V). e Current efficiency-current density (CE–J) characteristics of textile-based OLEDs. f Schematic illustration of the upper and lower encapsulation layers of the textile-based OLEDs. g Operating lifetime of the textile-based OLEDs with/without encapsulation. h Photograph of the textile-based OLEDs immersed in water. i Left: Textile-based OLEDs in a bent state for use in the facial mask; Middle: Demonstration of the textile-based OLEDs facial mask in use; Right: Facial mask with textile-based OLEDs in a bent state.
The comprehensive approach for analyzing strain in textile-based OLEDs, integrating finite element analysis (FEA), digital image correlation (DIC), and the newly developed analytic model, has been successfully demonstrated. The validation of the proposed energy-based equation with empirical data from DIC and FEA simulations confirms the accuracy and robustness of the method. Close alignment of the calculated strain values across varying bending radii validates the precision of the analytic model, reinforcing its applicability for predicting strain distributions in complex, multi-layered textile substrates. Experimental validation with actual textile-based OLEDs further demonstrates the practical benefits of the modeling approach. The integration of OLEDs on textile substrates, while maintaining flexibility and mechanical integrity under extreme bending conditions, highlights the utility of the proposed method for real-world applications. The model’s ability to predict failure points, optimize material choices, and reduce strain through tailored substrate design provides a robust tool for advancing flexible, wearable display technologies. The importance of considering the unique mechanical properties of textiles, particularly the effects of bending curvature and fiber structure, has been underscored, addressing complexities often oversimplified in traditional strain analysis methods. By introducing an effective radius of curvature, a more accurate representation of strain in textile-based displays under bending and deformation has been achieved. Ultimately, the findings offer a solid foundation for future development of durable and flexible OLEDs for wearable applications. The methods and models developed here enhance the understanding of mechanical behavior in textile-based displays and have significant implications for the design and engineering of next-generation wearable technologies. Further refinement of the analytic model, incorporating factors such as shear strain and material fatigue, is expected to improve predictive accuracy and broaden the applicability across diverse flexible electronic devices.
Methods
Criteria for selecting materials for planarization and adhesive layers
The planarization layer was developed using a parylene-C coating applied via the CVD method to enhance the fabrication and operational stability of OLEDs on textiles. This layer effectively smooths the rough textile surface (Supplementary Fig. 7), ensuring a flat surface that is crucial for the stable operation of the OLEDs. Parylene-C was chosen not only for its high flexibility in response to bending but also for its non-stretchable nature31, which minimizes strain transfer from textile deformation to the OLEDs, particularly the electrode layer, thereby reducing mechanical stress and protecting the device. Moreover, the material offers favorable thermal properties, such as a low coefficient of thermal expansion and a high glass transition temperature, making it suitable for heat-involved processes like encapsulation or TFT fabrication while providing better thermal stability compared to other materials typically used in textiles. Additionally, its hydrophobic nature effectively protects the OLEDs from moisture exposure, such as sweat and washing, by minimizing water penetration32. Furthermore, its non-toxic and biocompatible properties make it safe for direct skin contact, which is particularly advantageous for wearable applications33.
To ensure strong adhesion between the textile and the planarization layer, a Si-based RTV elastomer was selected as the adhesive layer due to its superior adhesion strength compared to conventional adhesives. Furthermore, in a three-layer structure, where a material with a lower modulus of elasticity is sandwiched between materials with a higher modulus of elasticity, multiple neutral axes may arise12,34,35,36. This phenomenon occurs due to the differences in bending stiffness between the layers, which result from variations in elastic moduli and shear deformation within the adhesive layer. Consequently, the presence of multiple neutral axes leads to variations in the strain experienced at the topmost layer during bending. To effectively control these neutral axes, we selected an adhesive material with a lower modulus of elasticity compared to both the upper planarization layer and the lower bare textile. The Si-based RTV elastomer offers high elongation and softness, contributing to the overall flexibility of the textile-based OLEDs. In addition, its durability is maintained across a wide temperature range, ensuring resistance to environmental conditions such as moisture, which is essential for wearable applications. By carefully selecting materials that meet key criteria, such as surface flatness, flexibility, thermal stability, moisture resistance, biocompatibility, adhesion strength, and durability, enhanced mechanical stability and performance in textile-based OLEDs were achieved.
Textile substrate fabrication
First, a fluorinated polymer with low surface energy, specifically KEM-1700 from Kemis Co., Ltd., was spin-coated onto an 8.5 cm × 8.5 cm × 0.7 t guide glass to facilitate the easy detachment of the parylene-C film. Next, a 3 µm-thick parylene-C thin film, which serves as a planarization layer, was deposited onto the guide glass and the fluorinated polymer substance using a CVD process. Then, to bond the parylene-C thin film to the actual textile, elastomer-based silicone RTV, specifically SE9187 L WHITE from DOWSIL Co., Ltd. was spin-coated onto the parylene-C thin film at a rotation speed of 4000 rpm. Subsequently, the bare textile, in this case, a polyester textile approximately 220 µm thick, was placed on top of the adhesive layer and subjected to physical compression with a force of 20 N for a day to allow natural curing. Finally, the completed textile substrate was detached from the guide glass, resulting in a textile substrate with an ultra-thin planarization layer. A schematic of the entire process is presented in Supplementary Fig. 5.
Tensile tests of PET and textile substrates
The tensile tests were conducted at a speed of 2 mm/min, and the strain changes during the tests were measured using digital image correlation (DIC). The tensile tests were performed using a universal testing machine (AGS-X, SHIMADZU, Japan). The DIC setup included a light-emitting diode (LED) lighting system and two 6-megapixel CCD cameras, which were calibrated to measure the appropriate area (30 ×24 mm) to facilitate the acquisition of high-resolution images. For strain measurements, white speckle patterns were randomly generated on the surfaces of the specimens using a commercial ceramic spray (SF 7900, LOCTITE, Germany). Images of the specimens were captured at a rate of 3 Hz by the two CCD cameras during the tests.
Fabrication of OLEDs
Red phosphorescent OLEDs were constructed on a polyester textile substrate, which had a planarization layer and a bottom encapsulation barrier applied. The following structure was employed: Al (100 nm) / Liq (1 nm) / Bebq2: Ir(piq)3 (70 nm) / NPB (62 nm) / MoO3 (5 nm) / Ag (30 nm). The devices were fabricated by means of thermal evaporation in a vacuum environment (2 × 10⁻⁶ Torr or lower). For the cathode and electron injection layer (EIL), Al and Liq were utilized, respectively. The emitting layer (EML) was co-deposited with bis(10-hydroxybenzo[h]quinolinato) beryllium complex (Bebq2) and tris(1-phenylisoquinoline) iridium (Ir(piq)3) at a concentration of 8 wt%. For the hole transport and injection layer (HTL and HIL), N,N’-bis(1-naphthyl)-N,N’-diphenyl-1,1’-biphenyl-4,4’-diamine (NPB) and molybdenum trioxide (MoO3) were used, respectively. Finally, semi-transparent Ag served as the anode. The Bebq2 was deposited at a rate of 3 Å/s, Ir(piq)3 at 0.24 Å/s, MoO3 at 0.5 Å/s, and the others at 1 Å/s.
Measurement
The opto-electrical performances of the textile-based red OLEDs were measured by a spectroscopic radiometer (CS2000, Konica Minolta Inc.) equipped with a close-up lens (CS-A35) and a source meter (2400 series, Keithley Inc.), while the mechanical performance of the textile trOLEDs was analyzed by a bending test machine (Sciencetown Inc.).
Encapsulation fabrication
The Al2O3/TiO2 nanolaminate layers were deposited7 using atomic layer deposition (ALD) at near-room-temperature, specifically at 40 °C, to prevent thermal damage to the organic electronic devices and textile substrates. TiO2 deposition was achieved using tetrakis(dimethylamino)titanium (TDMAT) as the titanium precursor and H2O as the reactant. For Al2O3 deposition, trimethylaluminum (TMA) was employed as the aluminum precursor, with H2O as the reactant. The deposition process involved alternately pulsing the precursors into the ALD chamber, followed by purging with nitrogen gas after each precursor pulse to remove excess materials and by-products. The nanolaminate structure was built by alternating Al2O3 and TiO2 layers, with each sub-layer precisely 3 nm thick, leading to a total thickness of 30 nm. This layering sequence was designed to optimize the film properties, with the deposition process carefully controlled to ensure uniform layer formation and accurate thickness throughout the structure.


Responses