Application of decision analytic modelling to cardiovascular disease prevention in Sub-Saharan Africa: a systematic review
Introduction
Cardiovascular diseases (CVDs) are the leading causes of non-communicable disease (NCD) morbidity and mortality globally1,2. Recent estimates indicate that CVDs (ischaemic heart disease [IHD], intracerebral haemorrhage and stroke) were the highest contributors of age-standardised disability-adjusted life years (DALYs) in 20222,3. The NCD burden is higher in low- and middle-income countries (LMICs), which account for more than three-quarters of all NCD related deaths and more than four-fifths of the premature deaths (occurring before the age of 70) attributed to NCDs1.
In sub-Saharan Africa (SSA), the NCD burden has increased over the last three decades from about 18.6% (of all DALYs) in 1990 to 29.8% in 20194. As globally, CVDs are the major causes of NCD deaths in SSA and were responsible for 13% and 37% of all-cause and NCD-related mortality in 2019, respectively5. The rising burden of CVD and their risk factors in the SSA region can be attributed to the demographic and epidemiological transitions, rapid urbanisation and lifestyle changes that have occurred in the past decades6,7.
In order to reverse the trend of CVDs in SSA, there is a need for the adoption and scale-up of effective and high-impact prevention interventions. The three main approaches to CVD prevention include8,9: (1) Primordial prevention, which targets individuals without CVD risk and aims at maintaining a low CVD risk status; (2) Primary prevention, which focuses on individuals who already have increased CVD risk with the aim of avoiding the onset of CVD; (3) Secondary prevention that targets individuals with CVD and aims at preventing complications including recurrent CVD events. In a setting like SSA where health infrastructure is weak and health systems are traditionally built to provide interventions for communicable diseases, it is particularly important to identify interventions that are not only effective but cost-effective and equitable at scale. Moreover, it is important to examine the equity impact of such interventions to inform viable options for attaining universal health coverage (UHC) in SSA.
Decision analytic modelling (DAM) is a valuable tool that can help to evaluate the health, economic and equity impact of different interventions for CVD prevention to inform priority setting. DAM involves the synthesis of evidence from multiple sources and the application of relevant mathematical techniques and computer software to predict the long-term impact of implementing a particular intervention10. The use of DAMs allows for the extrapolation of intervention costs and impacts beyond the study periods. Different cohort and individual patient level DAM approaches are available for modelling the impact of public health interventions for NCDs, with the model choice dependent on the nature of the decision problem11,12.
Three previous reviews related to this topic focused on identifying cost-effective interventions for CVD prevention interventions in LMICs13,14,15. With primary focus on synthesising cost effectiveness evidence, these reviews included studies of different methodologies, including economic evaluations that did not use DAMs. Similarly, another review specific to the SSA setting appraised the sources of data used in economic evaluation studies of different NCD interventions but also included non-DAMs16. Moreover, none of the studies examined the methods used in modelling equity dimensions in existing DAMs for CVD prevention.
Our review adds to this literature by focussing on the use of DAMs in modelling CVD prevention interventions in the SSA setting. This review appraises the characteristics and quality of existing DAMs, the types of prevention interventions modelled, how CVD progression was modelled, and approaches to incorporating equity impacts of interventions. The review also appraises the quality of existing DAMs using the Phillips et al. checklist17 and identifies existing gaps for future modelling studies. The specific objectives of the review included: 1) to identify the CVD prevention interventions and policies for which DAMs have been applied in SSA and existing gaps; 2) to examine the structure and characteristics of DAMs for CVD prevention interventions and policies in SSA; 3) to examine how equity is incorporated in model-based economic evaluations of CVD prevention in SSA; and 4) To assess the quality and identify the gaps in existing model-based economic evaluations for CVD prevention in SSA.
Methods
We used the Preferred Reporting Items for Systematic Reviews and Meta-Analyses (PRISMA) 2020 guidelines to conduct and report the review18. The systematic review protocol was registered on PROSPERO (CRD42023457106).
Study eligibility criteria
The review sought to identify model-based economic evaluations of interventions and policies targeting cardiovascular disease prevention in SSA. Decision analytic models were defined as studies applying mathematical modelling techniques to predict the impact of interventions or policy options either in terms of their cost or health outcomes. We excluded economic evaluations performed alongside clinical trials or observational studies that did not extrapolate their results beyond the study period. Model-based evaluations of interventions targeting primordial, primary, and secondary CVD prevention among adult populations in SSA countries were included.
To be eligible, the studies must have modelled adult CVD with established prevention strategies (coronary heart diseases, stroke, heart failure or their variants) as outcomes. Articles evaluating interventions targeting rheumatic heart disease (RHD) were excluded from the review because RHD is caused by Streptococcus pyogenes bacteria and tends to affect the younger age groups19,20. Only published articles in peer-reviewed journals, in the English language, were included in the review. As such, conference proceedings, dissertations, opinion pieces, descriptive studies and letters to the editor were excluded. We also excluded grey literature. Table 1 summarises the study inclusion and exclusion criteria.
Literature search
An iterative process was used to develop the strategy involving review of existing systematic reviews of economic evaluation studies and identification of relevant synonyms, discussions with other members of the review team and consultation of an information specialist from the University of Sheffield library. The strategy was developed by combining the four parts of the review question using appropriate Boolean operators as follows:
(Decision analytic models OR synonyms) AND (cardiovascular disease OR synonyms) AND (prevention OR synonyms) AND (SSA OR SSA countries OR synonyms).
The initial search strategy was piloted in the MEDLINE database and reviewed by the team before being adapted to suit the other databases. The final search was performed in seven databases that include MEDLINE via Ovid, EMBASE, APA PsycInfo, Scopus, Web of Science, EconLit and CINAHL from inception until September 12, 2023. Hand searching of reference lists of existing reviews13,15,21 was also done to identify additional references for inclusion in the review. Detailed search strategies for each of the databases are presented in Supplementary Methods.
Study selection process
Search results were exported into the Endnote reference manager where duplicates were identified and removed. After deduplication, the references were converted into an Endnote XML file and imported into Covidence software, where additional duplicates were automatically removed prior to the screening. All titles and abstracts and full texts were screened by two reviewers (JO and any of EW, PK, and CA). Conflicts were resolved by a third reviewer, not among the two initial reviewers.
Data extraction
An Excel-based data extraction tool was used to capture data on the most important elements of the studies. The data extracted included study characteristics, type of intervention, model type, CVD outcomes, risk equations used, data sources, uncertainty analyses, and equity analysis among others.
Quality assessment
We used the Philips checklist to assess the quality of the included studies17. Each study was appraised based on the extent to which it met each element of the checklist. We assigned a score of 1 (Y) for each criterion that was fully met, 0.5 score (U) where the criterion was partially met. A score of zero (X) was assigned where the authors did not report or include required information against the dimension of the checklist. An element of the checklist was tagged as “not applicable(N/A)” where it was not relevant to the study being evaluated. The quality assessment was performed by JO and reviewed by EW, PK, CA, PB and PD.
Data synthesis
A narrative synthesis was conducted to assess the DAMs for CVD prevention in SSA based on the identified criteria. The studies were first categorised based on their characteristics, settings and types of interventions and policies modelled. We then compared the studies based on how they approached the modelling of CVD progression, their equity considerations, assumptions, and limitations. All statistical analyses were performed using R software (version 4.4.1). Results were presented in a narrative format. The extracted data were presented using tables and graphs.
Reporting summary
Further information on research design is available in the Nature Portfolio Reporting Summary linked to this article.
Results
Out of an initial 2033 results retrieved from the database search, the final review included 27 papers22,23,24,25,26,27,28,29,30,31,32,33,34,35,36,37,38,39,40,41,42,43,44,45,46,47,48. Figure 1 presents the PRISMA flow diagram.
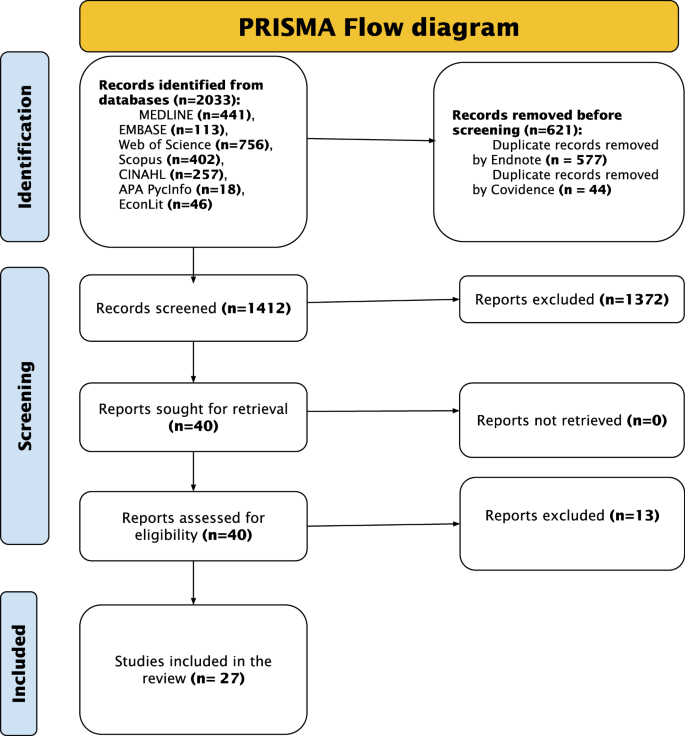
The PRISMA (Preferred Reporting Items for Systematic Reviews and Meta-Analyses) flow diagram outlines the study selection process. The numbers show the studies selected or excluded at each step of the study selection.
Characteristics of the included studies
Figures 2 and 3 present the characteristics of the included studies, with specific details presented in Supplementary Data 1.
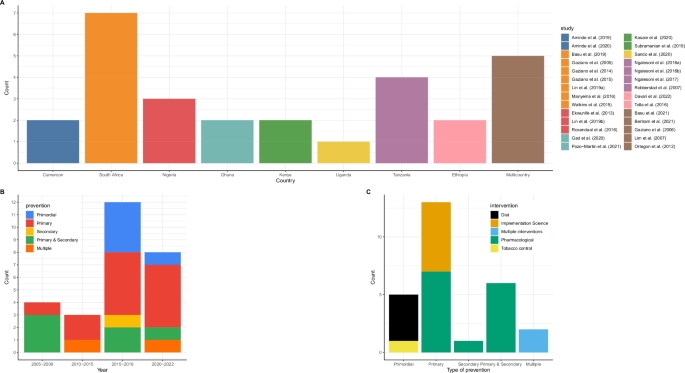
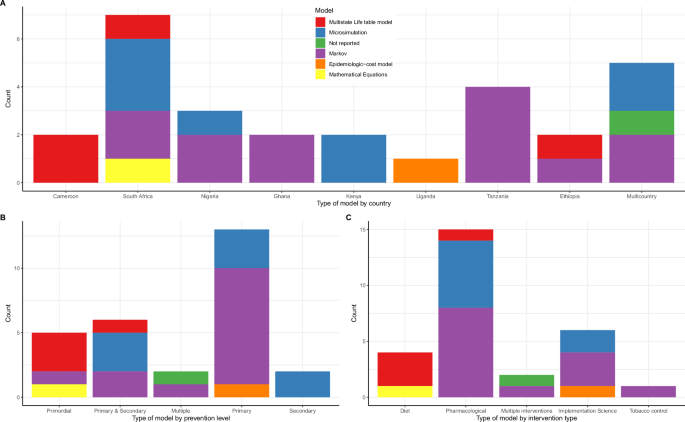
A Distribution of studies by country. Each country has a unique colour, which corresponds with the colour of the studies. Brown colour represents multi-country studies. B Distribution of studies by type of prevention and year of publication. Blue colour represents primordial prevention; red for primary prevention; yellow for secondary prevention and green are studies that modelled interventions targeting both primary and secondary prevention. C Distribution of studies by type of intervention and level of prevention. The colour codes represent the different types of interventions-black represents diet interventions, yellow for implementation science interventions, blue for studies modelling multiple interventions, green for pharmacological interventions and yellow for interventions targeting tobacco control.
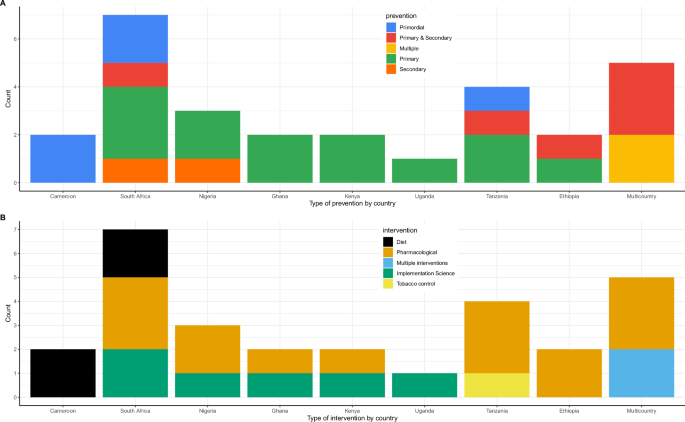
A A graph characterizing the level of prevention by country. Each colour uniquely represents a level of prevention. B A graph presenting the type of intervention by country. Each colour represents an intervention.
Figure 2A presents the distribution of the studies by country. South Africa had the highest number (seven) studies24,30,32,33,36,37,48 followed by Tanzania with four studies38,39,40,43 while Nigeria had three28,36,44. Cameroon22,23, Ethiopia27,47, Ghana29,42 and Kenya34,46 had two studies each, while Uganda had one study45. In five studies, several LMICs were grouped together, and the impact of interventions or policies evaluated at regional or multicountry level25,26,31,35,41. All the studies were published after 2005, with the majority (20/27) being published after 2015 (Fig. 2B).
Types of interventions evaluated
Regarding the level of CVD prevention, 13 studies22,23,27,28,29,30,32,33,34,37,38,39,40,42,44,45,46,48 evaluated interventions targeting primary prevention, five studies22,23,37,40,48 evaluated interventions targeting primordial CVD prevention while eight studies focused on multiple interventions targeting both primary and secondary prevention24,25,26,31,35,41,43,47. One study36 focused on secondary CVD prevention only (Fig. 2C).
Pharmacological interventions (mainly antihypertensives and statins) were the most evaluated either as single24,25,26,27,28,29,30,31,35,36,38,39,41,43,46,47 or combined interventions34,42,44,45. Six studies32,33,34,42,44,45 evaluated implementation science interventions for hypertension screening and treatment. Diet interventions were evaluated in four studies22,23,37,48 while only one study in Tanzania40 evaluated interventions targeting tobacco control. Figure 3A and B present the distribution of the evaluated interventions by country.
Characteristics of the decision analytic models
Figure 4, 5, and Supplementary Data 1 present the characteristics of the DAMs.
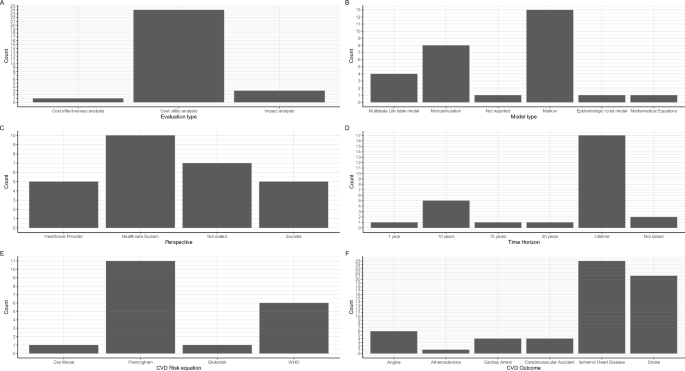
A A graph presenting the type of evaluation performed. B A graph showing the type of model used. C A graph presenting the study perspective adopted. D A graph presenting the time horizon adopted. E A graph showing the cardiovascular disease (CVD) risk equation used. WHO stands for World Health Organization. F A graph presenting the CVD outcomes modelled.
A A graph presenting the distribution of model types by country. Each colour is unique to a model type. B A graph showing the model type by the level of prevention modelled. Each colour is unique to a model type. C A graph presenting the model type by intervention modelled. Each colour is unique to a model type.
Types of evaluations and models
All but three studies22,39,48 were full economic evaluations involving the comparison of costs and health outcomes of which the majority (23/27) were cost-utility analyses23,24,25,26,27,28,29,30,31,32,33,34,36,37,38,40,41,42,43,44,45,46,47 (Fig. 4A). Thirteen studies were Markov models27,28,29,30,31,32,38,39,40,41,42,43,44 whereas seven were microsimulation models24,25,33,34,35,36,46. Markov modelling approach was used by studies evaluating the cost-effectiveness of providing antihypertensive treatment27,28,29,30,31,38,39,43, multicomponent community-based hypertension interventions42,44, community health worker interventions32 and tobacco policies40. Microsimulation models were used to evaluate the impact of pharmacological interventions24,25,35,36,46, and multicomponent interventions involving both screening and treatment33,34. Three studies used multistate life tables to evaluate the impact of sugar taxation37 and salt reduction policies22,23. The WHO-CHOICE methods were used in three studies to model the impact of multiple interventions26,41,47 while one study did not specify the model type but reported using an epidemiologic-cost model45 (Fig. 4B). In South Africa, four different model types were used while most countries had only one model type (Fig. 5).
Study perspectives
Healthcare system perspective of analysis was the most used23,24,26,29,34,36,37,40,43,46 followed by provider28,35,44,45,47 and societal perspectives27,31,38,39,42. Six studies did not explicitly state the perspective of evaluation25,30,32,33,41,48, while the perspective was not relevant in one study that focused on health outcomes only22(Fig. 4C).
Time horizon, cycle length and discounting
The starting age of patients included in 20 models ranged from 15–45 years24,25,27,28,29,30,31,32,33,35,36,37,38,39,40,41,42,43,44,45,46. Three studies22,23,48 modelled whole populations while the starting age of patients was not clear in two studies26,34,47. Lifetime horizon was adopted by 17 studies22,23,24,26,27,29,31,36,37,38,39,40,41,43,44,46,47 while eight studies adopted 10–30 year horizons23,25,28,30,34,35,42,45. In one study48, the analyses were performed over one year whereas the horizon was not stated nor clear in two studies32,33(Fig. 4D). Annual cycle lengths were the most adopted in 19 studies22,23,24,25,27,28,29,30,32,33,34,36,38,39,40,42,43,44,46 while the remaining eight studies did not specify their cycle length26,31,35,37,41,45,47,48. None of the studies mentioned performing half-cycle correction. Three percent discount rate was used in all the 22 studies22,23,24,25,26,27,28,29,30,31,33,34,36,38,40,41,42,43,44,45,46,47 where discounting was performed.
CVD outcomes modelled
Figure 4F presents the CVD outcomes included in the DAMs. The sum of complications from the graph exceeds the number of studies because all but two studies26,37 modelled multiple CVD outcomes as health states. Fifteen studies modelled two CVD states24,27,28,31,35,36,38,39,40,41,42,43,44,45,47, six studies modelled four CVD states22,23,30,34,46,48, four studies modelled three states25,29,32,33, while one study modelled only one CVD state37. Atherosclerotic CVDs were the commonest health states modelled in all DAMs that specified outcomes, while only six studies22,23,24,25,29,48 included hypertension complications as health states.
Ischaemic/coronary heart disease and/or stroke were the most common CVD outcomes in all studies except one study26, which reported CVD as an outcome but did not specify type of CVD (Fig. 4F). Twenty three studies22,23,24,25,27,28,29,31,32,34,36,37,38,39,40,41,42,43,44,45,46,47,48 modelled stroke as an outcome while three studies30,31,35 included cerebrovascular accidents (CVA). Angina and cardiac arrest were modelled in seven27,30,31,32,33,34,46 and five27,30,33,34,46 studies, respectively. Two studies modelled ischaemic and haemorrhagic stroke as separate outcomes22,23 and also separated hypertensive from ischaemic heart diseases.
CVD risk equations
Framingham risk equations were the most used to compute 10-year CVD risk in 11 studies23,27,28,30,31,32,34,38,43,44,46 (Fig. 4F). Four studies used the World Health Organization (WHO) absolute risk-based approach for computing the 10-year CVD risk24,25,39,47. Pozo-Martin et al.42 used the Framingham risk equation for the base case but performed sensitivity using the WHO CVD risk charts for Western sub-Saharan Africa. Basu et al.24 used both WHO/International Society of Hypertension (ISH) risk equations and Harvard/National Health and Nutrition Examination Survey (NHANES) to compute CVD risk for patients treated using different guidelines24. Gaziano et al.33 fitted two cox proportional hazards models using the US NHANES 1 dataset to predict the risk for IHD and CVA. In their cost-epidemiologic model, Sando et al.45 used the Globorisk equations to compute 10-year CVD risk among HIV patients in Uganda.
Health outcomes and Equity considerations
Supplementary Data 1 presents the outcome measures included in the models. Majority (18/27) of the studies used disability adjusted life years (DALYs) as the generic measure of the health outcomes24,25,26,27,29,32,34,36,37,38,40,41,42,43,44,45,46,47. Four studies used the quality adjusted life years (QALYs)28,30,31,33 while two studies used the health adjusted life years outcome measures22,23. Lim et al35. reported deaths averted only. Five studies reported either CVD events or deaths averted alongside a generic measure of health outcome23,25,34,36,45. Robberstad et al.43 used the life years gained as a surrogate outcome. Seven studies performed different types of equity analyses22,24,34,37,39,45,48. Subgroup analysis was used in five studies22,24,34,37,45, while one study each used extended cost effectiveness analysis (ECEA)48 and distributional cost effectiveness analysis (DCEA)39 methodologies. Gender inequalities were the most assessed in four studies that explored the difference in health outcomes between males and females22,24,37,45. Three studies24,39,48 assessed the impact of interventions across different socioeconomic groups. Ngalesoni et al.39 used life expectancy, Gini coefficient, and achievement index as measures of equity impact of primary CVD prevention. Similarly, Watkins et al.48 used deaths averted, catastrophic health expenditure averted, and poverty cases averted to measure the equity impact of salt reduction policies in South Africa. Only one study each focused on ethnic24 and regional inequalities34.
Uncertainty and budget impact analyses
Eighteen studies22,23,27,29,30,31,32,34,36,37,38,40,41,42,43,44,47 performed both one-way and probabilistic sensitivity analyses (PSA) whereas seven studies24,26,33,35,45,46,48 performed only one-way sensitivity analyses. One study performed PSA only28 while two studies25,39 did not report performing any sensitivity analyses. Seven studies28,29,34,38,43,44,47 presented cost-effectiveness acceptability curves (CEAC) or frontiers (CEAFs) showing the relative probability of cost-effectiveness of alternative interventions. Only two studies performed value-of-information (VOI) analysis28,38. Similarly, only five studies conducted budget impact analyses for the evaluated interventions24,29,34,36,37.
Model adaptation and validation
Five studies adapted previously developed models in international settings to suit their decision problems27,29,32,33,47. The CVD policy model, a validated model previously developed for the US population, was adapted to the Ethiopian27 and South African33 settings. In Ghana, one study adapted a 2006 model initially used by the UK NICE to update the hypertension guidelines29. Another study47 adapted the WHO CHOICE model for East Africa to suit the Ethiopian setting. Only three studies reported conducting some form of model validation27,30,33. However, the details of the validation were not adequately reported to establish the types of validation performed or the process undertaken. Model calibration was reported in two studies30,36 while four studies provided details of stakeholder elicitation processes to obtain expert opinion23,29,42,45.
Quality assessment based on Philips checklist
Supplementary Data 1 presents the quality appraisal of the included models against the different dimensions of the Philips et al.17 checklist. The mean quality score of the papers based on the Philips checklist was 68.9% and ranged from 46.4% to 85.1% (median = 72.3%). Fifteen studies scored above 70%, while only two studies scored below 50%. Based on the models’ dimensions of quality: the structure dimension scored the highest (84.9%), data dimension averaged 58.0% while the consistency dimension scored the least at 45.8%.
In all the studies, the decision problems were clearly defined and were consistent with the objectives of the evaluations and models specified. However, only 15 studies specified the primary decision maker22,23,24,29,30,32,37,38,39,40,42,44,46,47,48. Fourteen studies did not include all the feasible options in the evaluations27,28,29,33,34,36,40,42,43,44,45,46,47,48. The disease states included in almost all the studies reflected the underlying pathophysiology of the disease. Six studies did not define or justify the cycle length26,37,41,42,45,47.
The data used to construct most models (22/27) were aligned with the objectives of the evaluations. Regarding cost data, 17 studies reported using local sources either from administrative sources or from primary data collection23,24,27,28,29,34,37,38,39,40,42,43,44,45,46,47,48. However, none of the studies assessed the quality of the data used. Almost half of the studies (12/27) did not justify the choices made between different data sources26,28,30,31,32,33,39,40,41,42,43,46. The majority of the studies did not report the processes used to elicit expert opinion (21/27). None of the studies performed all the four principal types of uncertainty analyses (methodological, structural, heterogeneity, and parameter). Parameter uncertainty was the most assessed through sensitivity analyses while structural uncertainty was the least addressed.
Nine studies reported performing tests of the mathematical logic of the model before use. However, only two studies30,36 reported performing model calibration against independent data, but the details were very scanty. The majority of the studies (21/27) compared their results with those of previous models.
Discussion
We included a total of 27 studies in this systematic review from eight SSA countries. The majority of the studies were published after 2015 and focused on pharmacological interventions, with the fewest number focusing on lifestyle interventions for CVD prevention. There was heterogeneity in the modelling methods used with Markov models being the most used to evaluate the impact of CVD prevention. The most captured CVD outcomes were ischaemic heart disease and stroke. Framingham CVD risk equations were the most used to predict the 10-year CVD risk for patients included in the model. Lifetime horizon was the most adopted, but some studies used shorter time horizons. Gender and socioeconomic dimensions were the most examined by the equity-focused studies. The majority of the studies had a high mean quality score, but consistency and data dimensions scored the least. Data limitations, especially for key parameters like treatment effect and CVD risk, were recurrent themes across most studies.
Consistent with previous reviews13,14,15, this review found that most studies focused on primary CVD prevention, with the majority evaluating pharmacological interventions especially antihypertensives. It is not surprising that antihypertensives were the most evaluated intervention given the high burden of hypertension in SSA, which affects almost half of the population aged above 25 years and has a significant impact on household incomes49,50. Despite the high prevalence, only about a quarter (27%) of the hypertensive individuals in SSA are aware about their status, 18% are on treatment, and a paltry 7% attaining blood pressure control51. In this review, only six studies32,33,34,42,44,45 evaluated different primary healthcare interventions for hypertension screening and management. Stronger primary healthcare (PHC) systems have been identified as the most feasible way towards the attainment of UHC and other health-related SDGs52. It is important to evaluate alternative PHC approaches that can be implemented to increase the coverage of CVD prevention interventions, especially among the unreached populations in SSA. This includes identifying different population groups that would be impacted by the interventions by examining the health and financial risk impacts.
Interventions targeting primordial prevention, specifically behavioural risk factors, in SSA, were the least evaluated. For instance, only one study evaluated tobacco interventions in Tanzania40 while salt22,23,48 and sugar37 interventions were evaluated only in two countries (South Africa and Cameroon). Lifestyle interventions fall within the ‘WHO best buys’ and their implementation can significantly reduce the onset of CVDs in SSA. Evidence shows that about 81% of adults in SSA consume more than the recommended 2 g sodium per day53 and that SSA has experienced the highest rise in sugar-sweetened beverage (SSB) consumption compared to other regions54. For SSA to significantly reduce the CVD burden, it is imperative that there is sustained focus towards primordial prevention, which requires health economic evidence to inform decision-making.
We observed an increasing number of model-based studies since 2010, with almost three-quarters of the studies being published after 2015. Similarly, we observed an increasing number of prevention interventions being evaluated, especially after 2015. This can be attributed to increased global commitments to meeting CVD prevention and control targets by 202555, the UN sustainable development goals56, and enhanced collaboration within and without the region57. Governments and other stakeholders in SSA increasingly recognize the need for using economic evidence in the design of health benefit packages, especially with the quest towards attaining UHC58. However, given the diversity within the African continent and differences in settings, additional modelling studies are required for context-specific evidence that can inform priority setting in individual countries.
Conceptual modelling and model selection processes were poorly documented despite modelling approaches being aligned to the decision problem of interest. Markov models, microsimulations and multi-state cohort life table models were the most used methods. Previous reviews found that Markov models were the commonest modelling methods in LMICs13,16. The multistate cohort life table modelling approach was adopted mainly by studies modelling whole populations to examine the impact of salt and sugar policies on multiple diseases in Cameroon22,23 and South Africa37. Compared to cohort-based approaches that model aggregate populations, individual patient level models follow individual trajectories as they experience events of interest and average their costs and outcomes to derive population averages. Individual patient level models permit the modelling of patient heterogeneity and suit complex interventions59 but are also data hungry and computationally intensive. The trade-off between different modelling methods depends on the nature of the decision problem, data availability and resources. It is important for modellers to conduct and properly document the conceptual modelling process to inform the model selection process.
The review found that only seven studies incorporated equity dimensions in their analyses22,24,34,37,39,45,48, of which five performed subgroup analyses while only two40,48 used generic equity metrics. Gender, age, and socioeconomic dimensions were the most explored, while only one study each examined the differential impact of interventions on ethnicities24 and regions34. A review in LMICs reported an increasing focus on equity analysis in recent economic evaluations60. Only two studies in our review used ECEA48 or DCEA39 methodologies to undertake their equity analyses. While most equity-focused studies perform subgroup analyses, newer methods like extended (ECEA) and distributional (DCEA) cost-effectiveness analyses are being adopted to undertake equity focused economic evaluation60. However, these methods have not been extensively applied in existing DAMs for CVD prevention in SSA. Incorporating equity dimensions in economic evaluations of CVD prevention is particularly relevant to the SSA context considering the need to scale up intervention coverage targeted at various population groups while at the same time ensuring that the financial barriers to accessing healthcare are eliminated.
Whereas most studies used country-specific data sources to inform baseline population and cost parameters, critical data gaps were observed relating to intervention effectiveness and CVD risk equations. There was a lack of local data for generating 10-year CVD risk equations relevant to the SSA context. Where 10-year CVD risks were estimated, the Framingham risk equations and WHO/ISH risk prediction charts were the most common approaches. In a few cases, the Globorisk algorithm and cox proportional hazards models were fitted using data from other settings. All the CVD risk prediction models differ in terms of their sensitivity and hence may underestimate or overestimate the risk of CVD in a particular population61,62. This review highlights the need for longitudinal studies in SSA, especially cohort studies, that involve long-term follow-up of patients with different risk profiles to better understand the natural history and probability of developing CVDs. Another critical data gap relates to the utility values used to compute QALYs gained from alternative interventions. For instance, all the four studies28,30,31,33 that used QALYs as health outcome measures derived their utility values from developed country settings. This finding calls for individual countries in SSA to invest in health valuation studies using multi-attribute utility instruments like the EQ5D so as to generate local value sets that can be used to compute QALYs for future modelling studies.
Despite a high overall quality score, we observed heterogeneity in the methods applied in modelling CVD prevention interventions in SSA. While there exist different health economic evaluation guidelines17,63,64,65,66,67,68,69, we used the Philips checklist17 due to its suitability in assessing the quality of DAMs. The model structure dimension scored the highest while the consistency dimension scored the least. Most studies did not report evaluating the quality of data included in the models, consistent with the findings from previous review16. Uncertainty analyses were also not adequately performed in some models, with structural uncertainty being the least addressed. While VOI analysis can be useful to quantify uncertainty and better inform decision-makers, none of the studies performed VOI analysis. In addition, model validation and calibration were rarely done and where done, scantily reported. Stakeholder engagement and elicitation processes were also not adequately reported in most models. It is imperative that modellers consider effective stakeholder engagement during the modelling process to inform the assumptions, and enhance transparency and use of the evidence70. Model validation guidelines70 should be adhered to in order to promote model accuracy and stakeholder confidence. Given the resource constraints in SSA, it is important not only to rely on cost-effectiveness but budget impact of interventions. However, the majority of the studies did not perform budget impact analysis, which does not provide a comprehensive picture about the consequences of adopting new interventions. All the included studies used a 3% discounting rate, but some studies did not perform any sensitivity analysis to assess the effect of varying the discounting rate on the results. Haacker and colleagues71,72 recommend the use of a discounting rate of at least 5% for low and lower-middle income countries and 4% for upper-middle income countries. At the very least, modellers should conduct sensitivity analyses around the discounting rate to assess the effect of different rates on the result. These findings highlight the need for modellers in SSA to adhere to best practices while building their DAMs. As much as possible, DAMs should be relevant to the context and should use local data to ensure that the analyses are useful to the setting. Modellers should also ensure that they assess the different types of uncertainty to test the robustness of their results under different scenarios.
This review has some limitations. We only included articles published in the English language and also did not include grey literature which could exist outside the academic databases searched. Moreover, the heterogeneity in the interventions and modelling types made model comparisons unfeasible. Nevertheless, the review provides a comprehensive picture on the application of DAMs for evaluating interventions targeted at CVD prevention in SSA.
Conclusion
This systematic review provides an overview of the existing literature on model-based economic evaluations of interventions targeting CVD prevention in SSA. The review finds a paucity of studies modelling the impact of primordial prevention interventions and those targeting the scale up of screening and treatment of CVD risk factors to prevent CVD onset, especially among the undiagnosed but high-risk individuals in SSA. Appropriate modelling methods should be used for complex interventions, especially those with heterogeneity and interactions. Moreover, there is a need to explore equity dimensions in economic evaluations of CVD prevention in order to expand intervention coverage and reach the significant proportion of the SSA population without access. The review also highlights the need for longitudinal studies in SSA to facilitate more appropriate CVD risk prediction and for local and context specific health outcome valuation studies. Modellers should adhere to modelling best practices and improve their transparency in model building, validation, documentation.
Responses