Archeological exploration via integrated shallow geophysical methods: case study from Saqqara, Giza, Egypt

Introduction
The Saqqara necropolis, a paramount archeological site in Egypt, has functioned as a burial ground for millennia, featuring monuments and tombs from the Early Dynastic Period to the New Kingdom1,2. The significance of comprehending ancient Egyptian civilization is shown by the various and complex funeral structures concealed beneath the sands3. Conventional excavation techniques, however essential, frequently encounter constraints when employed in isolation, as they could compromise delicate subsurface artifacts and do not consistently offer a thorough understanding of the spatial intricacies of underlying formations. Consequently, archeologists are progressively utilizing non-invasive geophysical methods for comprehensive and delicate site investigation while preserving site integrity4,5,6,7.
The archeological structures in the Saqqara necropolis can be classified into two main categories; the most frequently encountered are: (1) Greco-Roman burials, comprising sarcophagi and mummies placed either directly within aeolian sand layers or, less commonly, in shallow depressions carved into the limestone bedrock; and (2) remnants of brick and stone cult chapels, coupled with corresponding burial shafts from the late Old Kingdom, ~2000 years of ancient Egyptian history2,8.
Since the completion of the inaugural magnetic survey in 1987, geophysical investigations in the Saqqara region have been essential to archeological research9. This initial investigation intended to detect probable underground burial complexes in 2004 and led to the major finding of the lavishly adorned tomb of Merefnebef from the late Old Kingdom period10. Subsequent large geophysical surveys in 2012 had considerably expanded our understanding of the Saqqara necropolis, finding hundreds of buried buildings from different historical periods11. These findings have substantially increased our knowledge of the spatial arrangement and historical development of the Saqqara necropolis.
Since 2001, seismic methods have been employed in the Saqqara necropolis to examine archeological structures from the Early Dynastic period. A collaborative team of geophysicists from Egypt and Switzerland conducted seismic tomography and ultra-shallow seismic reflection surveys in the northern section of the study area to investigate the structural composition of an Early Dynastic mastaba12. Results from the study reveal two distinctive geoseismic layers and a sharp boundary between them, with low velocity anomalies below the boundary probably representing tunnels or chambers. Additionally, another investigation applied seismic refraction and Wavepath Eikonal Travel-time Tomography (WET) in the northwest part of our study area13. A roughly triangular-shaped seismic velocity anomaly was detected, which represented a man-made artifact.
One of the most cutting-edge techniques in geophysical prospecting (GPR), it was recently used to investigate the Saqqara necropolis. In order to find possible subsurface sepulchral structures, the Polish-Egyptian archeological expedition carried out GPR surveys in the West Saqqara region during the 2012 field campaign8. The research results demonstrated that there were three primary categories of archeological structures: burial shafts, mobile bodies (solid rock blocks that were segments of tombs), and sarcophagi and mummies. To create high-resolution subsurface images of Saqqara’s archeological structures. A new 3-D GPR system with a rotary laser positioning system (RLPS) was presented by the authors14. Many hyperbolic reflections from subterranean structures, such as shafts, mud-brick walls, and perhaps the remains of old temple bases, were imaged.
Previous investigations concerning electrical properties were conducted in the study area. 2D and 3D Vertical Electrical Sounding (VES) to study possible effects of watertable on the subterranean artifacts (1, 2). 1D and 2D interpretations of VES data had identified two water-bearing units that could be damaging the monuments. The 3D resistivity model produced in this study provided a more integrated image of the subsurface, suggesting a connection between the two aquifers. A 2000-year-old tomb with the name ‘Iwrhya,’ who served under King Sethi I and his son Ramesses II, was discovered during the initial phase (phase I) of this project utilizing Quasi 3D ERT15. This research is part of Cairo University’s collaborative archeological-geophysical investigation project, and it is regarded as phase I.
The lack of an integrated approach of the above-mentioned three techniques in the vicinity of our area of study prompted the research of the second phase of the project to formulate an integrated approach to optimally approach the artifacts mounted there. In order to achieve such an endeavor, this study focuses on the application of three integrating geophysical techniques: SRT, GPR, and ERT. Due to the trade-offs for each tool with respect to resolution, depth penetration, and material sensitivity, their combined application is very useful in various geological settings16,17,18.
To discover hidden structures and cavities, Seismic refraction analyzes the travel-times of seismic waves through different layers, providing insights into the subsurface stratigraphy19. Because of its capacity for high-resolution imaging, GPR is an excellent tool for identifying small features like walls, voids, and burial holes17,20. By investigating lateral and vertical variations in the electrical resistivity, ERT technique provides a distinctive paradigm to map materials nondetectable by seismic or electromagnetic techniques15,17,19,21,22,23,24.
Our understanding of the subsurface archeological landscape in the Saqqara region could be greatly improved through the implementation of these geophysical techniques7. The integration of SRT, GPR, and ERT produced a more comprehensive subsurface image compared to single-technique studies, enabling the identification of anomalies that suggest previously undetected tombs and architectural features. This contributes to a more complete mapping of burial patterns and site organization23,25.
Geological background
One of the most valuable archeological sites in the world is the Saqqara necropolis, which is situated on the west bank of the River Nile about 15 km southwest of Cairo (Fig. 1a). It is located on a limestone plateau with a gentle 5–7° westward slope that climbs to a height of 40–58 m above sea level. A noticeable cuesta that divides the plateau from the Nile floodplain marks the plateau’s eastern edge. From a geological standpoint, the plateau is composed of carbonate rocks from the Upper Eocene Paleogene, notably the Upper Calcareous Beds of the Saqqara Member within the Maadi Formation, which are a 22-m-thick sequence of firm, compact limestones mixed with softer marly limestones26.

a Aerial photograph of Egypt showing the position of Saqqara in the southern Nile Delta. b A zoomed-in image highlighting the research area within the concession owned by Cairo University, with a red dashed rectangle marking the survey region.
Over the past 6000 years, extensive eolian sands have accumulated in the Saqqara region due to the retreat of the last Holocene pluvial, particularly the Nabta pluvial27. These sands, ranging from 0.5 to 3 m in thickness, overlay the older geological formations. The most recent deposits include calcareous debris of anthropogenic origin from the early Old Kingdom period (circa 4600 B.P.), which resulted from significant building activities related to the construction of royal tombs. This combination of natural and cultural deposits contributes to the complex stratigraphy of the Saqqara plateau4.
Our study focuses on the Cairo University concession, situated in Saqqara (Fig. 1b). This area, which dates to the New Kingdom level almost 2000 years earlier, features tombs aligned along an east-west axis, arranged in a single row that extends southward and culminates at a prominent hill, above which are older tombs from the Old Kingdom. Central to this site is a substantial mastaba, an Old Kingdom tomb, which remains only partially investigated. Previous research conducted in the 1980s was hindered by the lack of precise surveying technology, leaving many details of this significant structure unexplored28.
Materials and methods
This study employed a systematic application of three geophysical techniques: SRT, ERT, and GPR to survey targeted areas within the Saqqara region. Each method was selected for its unique ability to provide complementary subsurface data, enabling a thorough analysis of the archeological landscape (Fig. 2).

Flowchart representing the workflow of the three different geophysical techniques and their integration for joint interpretation.
Seismic refraction tomography (SRT)
In seismic exploration, seismic waves are produced, and their arrival timings are tracked as they move from the source to a number of geophones18,22,29. Seismic measurement techniques are divided into two categories: reflection and refraction methods. These categories are based on the Earth’s subsurface wave propagation geometry. Seismic refraction has become a common investigative tool recently in archeological surveys19,30,31.
This technique is especially effective for mapping shallow subsurface layers, determining layer thicknesses, and providing preliminary lithological information32. Seismic refraction helps evaluate the essential parameters of subsurface materials and addresses geological challenges related to mining, construction, and environmental conditions33. In this method, seismic energy travels through the subsurface and returns to the surface along refracted ray paths. The first seismic waves detected by a geophone located at a distance from the seismic source are typically those that have traveled along direct or refracted paths, offering critical data about the subsurface structure34.
The seismic refraction data was acquired along three profiles with geophone separation of 3 m fixed in all lines, resulting in a total profile length of 72 m (Fig. 3a). The refraction surveys were carried out using a multichannel (OYO-McSEIS-SX48) seismograph (24 channels), equipped with 40 Hz vertical geophones (Fig. 3b, c). Seismic energy was generated using a 20 kg sledgehammer as a controlled seismic source, which is positioned at several locations along the profile line to ensure comprehensive coverage.

a Map showing the research area with survey lines for ERT, SRT, and GPR. b Seismic data acquisition using a sledgehammer. c Multichannel seismograph setup. d GPR data acquisition using a MALA ProEx 100 MHz antenna. e GPR survey conducted across the grid. f Electrical resistivity data acquisition using the SYSCAL Pro system.
Data processing begins with the analysis of seismic data to pick the intervals at which seismic waves initially arrive. These initial arrivals are then used to construct a velocity tomogram that represents the different subsurface layers. By interpreting these velocity tomograms, the depths and composition of these layers can be estimated, and key subsurface interfaces can be identified, providing a clearer understanding of the geological structure beneath the location.
Ground penetrating radar (GPR)
Using a 100 MHz shielded antenna and MALA ProEx GPR equipment, GPR surveys were carried out (Fig. 3d) depending on the required depth and resolution based on previous studies conducted on the study area, and as mentioned in the “Introduction” section, the archeological setting consists of two categories: (1) Greco-Roman underlain by (2) Old Kingdom period architectures, with research in the area confirming target depths ranging from a fraction of a meter to a maximum depth of 8 m. Furthermore, the need to study the limestone bedrock below the archeological setting to search for any deep-seated shafts. With a 100 MHz radar antenna, the predicted horizontal and vertical resolutions match the main study target, which investigates medium to large-sized architecture. The GPR system was systematically moved across the survey grid with EM wave velocity 0.1 m/ns, which consists of 3 inline profiles with separation distance 3 m and profile length 40 m, and 4 crossline profiles with separation distance 4 m and profile length 5 m along the inline profiles to get more details about the subsurface (Fig. 3e).
Before GPR data can be utilized for excavation and interpretation, it must undergo a thorough processing flow35. Raw GPR profiles often contain significant noise and clutter, resulting from factors such as antenna “ringing”, varying energy coupling with the soil, and multiple reflections between the surface and the antenna17. To transform this complex data into usable images, a series of processing steps are necessary. Initially, the focus is on highlighting anomalous features within the GPR field sections36. The complete dataset is then processed using REFLEXW software (version 9.5.7), which includes several key steps: removing background noise to eliminate horizontal lines caused by surface reflections, moving start time in order to remove all data in front of the time zero, subtracting mean(dewow) to remove a very low-frequency component, applying a band-pass filter to discard unwanted high-frequency components, and using F-K filtering alongside manual gain control to enhance the clarity of subsurface features. The processed GPR data yielded high-resolution images of the subsurface and generated 2D profiles to visualize subsurface features at various depths37,38,39,40.
Electrical resistivity tomography (ERT)
With 24 electrodes, the IRIS SYSCAL Pro Switch unit automates the switching procedure to collect profile data (Fig. 3f). The construction of a mixed-sounding/profiling section involves adjusting the pairings of transmitting and receiving electrodes, with the overall cable length playing a major role in determining the maximum depth of study41. Various electrode designs are used, each with unique benefits and drawbacks regarding vertical penetration depth and lateral resolution, such as Wenner, Pole-Pole, Dipole-Dipole, and Schlumberger arrays42,43,44,45,46.
The dipole-dipole configuration was chosen for our investigation to get better horizontal resolution since it is very useful for mapping vertical structures and is extremely sensitive to fluctuations in horizontal resistivity47. Making it particularly useful for identifying archeological features that exhibit distinct vertical and horizontal resistivity contrasts. This setup allows for the detailed mapping of vertical structures, such as walls, pillars, and buried enclosures, as well as for detecting subtle resistivity changes that may indicate horizontal elements like floors, pathways, or layers of occupational debris. We acquired three profiles with a 3-m electrode spacing, resulting in a total profile length of 69 m (Fig. 3a). This configuration allowed us to achieve a penetration depth of 14–16 m, covering the same area as the seismic refraction survey.
Subsurface resistivity distribution in two dimensions was created by processing the resistivity data. Inversion techniques were applied to convert the raw apparent resistivity data into resistivity values, which were then interpreted to reveal the distribution of different subsurface materials. These resistivity models were cross-referenced with seismic and GPR data to enhance interpretation accuracy and ensure the validity of the results23,48.
Results
The findings from the combination of three geophysical methods: SRT, GPR, and ERT are shown and discussed in this section.
Seismic refraction tomography (SRT)
As we mention in the geology section, Saqqara consists of a limestone plateau covered by sandstone sediment. Following the determination of the seismic waves’ first arrivals, each survey line’s velocity model is created by several iterations and extensive testing. Using established interpretation techniques, we refined these models and proceeded to construct tomographic inversions for each line, providing a detailed representation of the subsurface.
We can divide the result according to their P-wave velocities into two layers as follows:
-
The first subsurface layer exhibits P-wave velocities ranging between 400 and 1100 m/s, which can be interpreted as sandstone. This layer is situated at depths ranging from 0.5 to 7 m, indicating the presence of moderately compacted, weathered material near the surface.
-
The second subsurface layer exhibits P-wave velocities ranging between 1200 and 1900 m/s, which can be interpreted as limestone. This layer started at a depth of 7 m, indicating the bedrock of the Saqqara Necropolis.
The three seismic tomograms reveal two primary seismic strata, consistent with the stratigraphic framework of the study area as outlined by previous researchers15 (Fig. 4). Most of the tomographic sections display regions with notably low velocity values (Vp < 600 m/s). These low-velocity anomalies (basin-shaped) likely indicate the presence of a potentially large hall filled with friable sand. The two anomalies, A1 and A2, have almost the same dimensions (approx. 6 by 2 m) at the same depth of 1.5 m. The interpretations align with the stratigraphic framework of the study area and correlate quite well with the excavations of Phase I15, and provide valuable insights into the subsurface features, aiding in the ongoing exploration and integration with the other techniques.

a–c Tomographic inversion results for Profiles SP-1, SP-2, and SP-3. The black dashed line represents the interface between the first layer (sandstone) and the second layer (limestone). Archaeological features A1 and A2 are identified as low-velocity zones, displayed as spherical forms in green and red.
Ground penetrating radar (GPR)
GPR surveys produced high-resolution subsurface images that allow to identify a system of linear features that are probably the remains of old walls, roads, or other man-made constructions. The precision of the GPR data enabled detailed mapping of these subsurface elements, offering valuable insights for guiding further archeological investigations.
Anomalies are observed in the GPR profiles at depths of 0.5 to 4 m and at distances of 8 to 12 m, 27 m, and 34 to 38 m (Fig. 5). Some of these anomalies exhibit low amplitude, suggesting the presence of potential subsurface rooms or chambers filled with high-conductive materials such as shales or clays, highlighted by green spherical shapes, and appeared at depth 2 m as shown in Fig. 6a–c. In contrast, high-amplitude anomalies due to the nature of construction materials, mainly mud bricks, manifest in two distinct forms within the GPR data. The first is highlighted by black rectangular shapes, interpreted as a wall, while the second consists of yellow spherical shapes appeared as flat anomalies, which may indicate the presence of a flat hall. The third one is highlighted with a red spherical shape due to its shape; it may be a subsurface chamber (Fig. 6).

GP-1, GP-2, and GP-3 are presented as (a–c), highlighting subsurface reflections and potential archaeological features.

a–c Interpreted GPR profiles GP-1, GP-2, and GP-3. High-amplitude anomalies are represented by red and yellow spherical shapes and a black rectangle. Low-amplitude anomalies are indicated by the green spherical shape.
The crossline GPR (GP-4 to GP-8) is also processed and interpreted to show the same anomalies at same locations to confirm our interpretation (Fig. 7).

a–e Processed GPR profiles representing crosslines GP-4 to GP-8. f–j Interpreted GPR profiles for GP-4 to GP-8, with each color indicating the same anomaly across the inline profiles.
The results of GPR responses are presented as a 2D GPR record acquired within the grid, combining inline profiles GP-1, GP-2, and GP-3 and crossline profiles GP-4 to GP-8 (Fig. 8), the data clearly indicates the presence of objects visible across multiple profiles. This multi-line visibility strengthens the interpretation of the detected feature, providing a more comprehensive understanding of its size and spatial orientation within the subsurface.
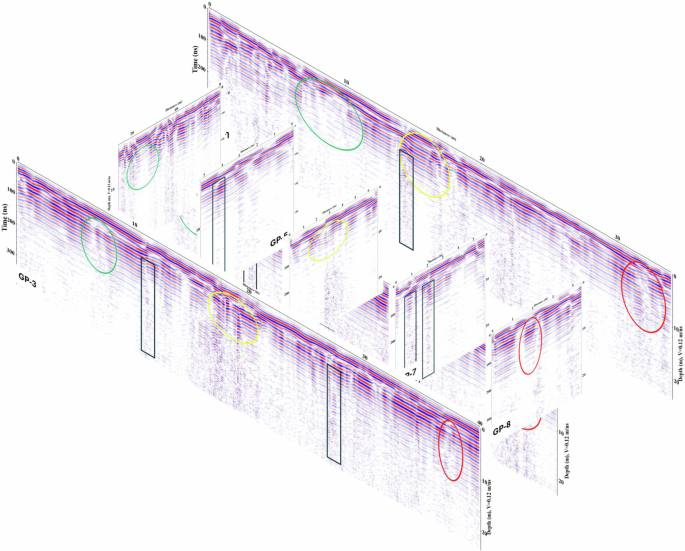
The 2D GPR profiles in 3D pseudo-presentation according to their positions and lengths.
Electrical resistivity tomography (ERT)
In this study, a 2D resistivity tomogram was developed to determine resistivity distribution consistent with field measurements. A forward modeling approach is used in the inversion process to determine apparent resistivity values. The difference between estimated and observed resistivity values is then minimized using a reliable, iterative inversion process, beginning with an initial model. The difference between these values is expressed as absolute error, which is reduced through successive iterations. The model is continually refined until the lowest absolute error is achieved, ensuring an accurate representation of the subsurface resistivity profile15,17,49.
The electrical resistivity survey data collected at the Saqqara site was inverted to generate a resistivity pseudosection, processed using the RES2DINV software. The resulting profile reveals distinct zones, with high-resistivity areas displayed in warm colors (red), enclosed by a green rectangle (Fig. 9), which likely correspond to limestone blocks, started at depth range 6 to 8 m, the dominant geological feature of the plateau in our study area.
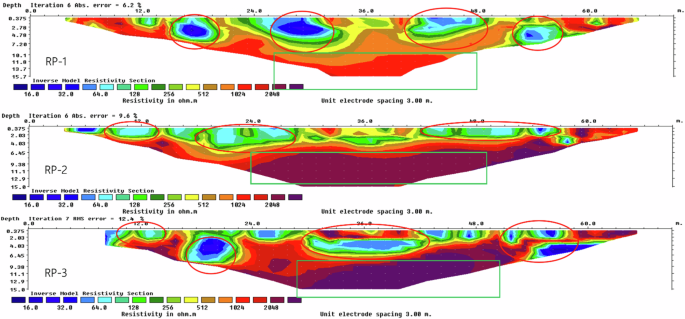
The expected anomalies marked by red spherical shapes; limestone plateau marked by green rectangle.
The primary anomalies in the inverted results are represented by low-resistivity zones, shown in cool colors (blue and green) and marked by red circles (Fig. 9). These anomalies may suggest the presence of clay and loose sediment-filled voids or structures constructed from mud bricks, the predominant building material in the region. The low resistivity values are characteristic of mud bricks, attributed to the presence of clay minerals within the material.
Discussion
This study was primarily conducted to identify potential remnants of ancient structures within the survey area through the integration of three shallow geophysical techniques: SRT, GPR, and ERT. The results from the first profiles of each method (SP-1, GP-1, and RP-1) are presented in combination to demonstrate the effectiveness of their integration (Fig. 10). The alignment of the profiles according to the layout of the survey. By integrating the results from the three methods, there are three main anomalies (A-1, A-2, and A-3) that can identified in all profiles.

Marked the anomalies represented by different colors.
Anomaly A-1 appeared on the GPR profile as a low-amplitude reflection and on the ERT profile as a low-resistivity area and from the SRT it is indicated as the low velocity zone. This is likely due to the nature of nearby archeological structures constructed from mud bricks, shown in Fig. 3b, which exhibit high conductive properties. All three techniques indicate A-1’s depth to be ~2 m, with dimensions of around 2 by 6 m. These findings imply that A-1 could be a mud brick-built room, potentially filled with conductive materials.
Anomaly A-2 is displayed as a flat anomaly on the GPR profile and a low-resistivity feature on the ERT profile. This anomaly is interpreted as a hall surrounded by low-resistivity sediments and is further characterized by a low-velocity zone on the SRT profile. Located at an approximate depth of 1.5 m and extending about 6 m, A-2’s structure aligns with the design of adjacent tombs, such as the Ptahmose tomb structure, as shown in Fig. 3a.
Anomaly A-3 is characterized by a low-amplitude response on the GPR profile, a sharp low-resistivity feature on the ERT profile, and a low-velocity anomaly on the SRT profile. Based on these responses and their proximity to nearby tomb structures, A-3 likely represents a subsurface chamber, approximately 2 by 6 m and a depth of around 1 m. An additional low-resistivity feature appears in the ERT profile, possibly a subsurface shaft leading to another chamber, warranting further exploration in future excavations.
A 3D visualization of P-wave velocity distribution was developed to enhance the display of the subsurface structure. This was further integrated with a 3D iso-resistivity surface, providing a detailed representation of subsurface variations, as shown in Fig. 11. The iso-resistivity surface, with values between 100 and 400 ohm.m and color-coded in cooler tones like green, highlighted areas of low resistivity that aligned with low-velocity zones in the 3D P-wave velocity visualization. This integration supports the interpretation of a complex subsurface layout comprising a connected room, hall, and chamber, in line with surrounding architectural patterns.

a A quasi-3D display of the iso-resistivity surface, showing the locations of expected anomalies. b A 3D P-wave model to visualize the low-velocity zones more clearly.
This multi-method approach allows for a detailed, non-invasive detection and mapping of subsurface features, guiding targeted excavations and enhancing understanding of the historical site’s structure and significance.
Conclusion
This research highlights the successful integration of three geophysical techniques: SRT, GPR, and ERT for archeological investigation in the Saqqara region. By integrating data from various methods, we can achieve a comprehensive interpretation that enhances our understanding of subsurface features and offers significant archeological insights. This approach allows for a more detailed and accurate identification of buried structures, helping us assess their archeological significance and better understand the site’s historical context. Through this analysis, we aim to correlate geophysical anomalies with potential archeological features, contributing valuable information to the ongoing exploration and preservation efforts.
The collective interpretation of these datasets identified anomalies A-1, A-2, and A-3 as potential room, hall, and chamber structures at an approximate depth 2 m, reflecting architectural patterns observed in adjacent tombs. The integration of these geophysical methods overcame the limitations inherent to individual techniques, offering a robust, accurate subsurface model that enables targeted excavation while minimizing risk to delicate archeological materials. By utilizing these non-invasive techniques, the archeological integrity of the site is preserved, while still obtaining valuable insights into its structural and historical context.
The outcomes of this research significantly advance the efforts in the preservation and archeological exploration of Saqqara, demonstrating the critical role that geophysical methods play in modern archeology. Future research could expand the surveyed area and incorporate additional techniques, further enriching our understanding of this culturally significant site.


Responses