ARNT-dependent HIF-2α signaling protects cardiac microvascular barrier integrity and heart function post-myocardial infarction

Introduction
Despite many therapeutic advancements, acute myocardial infarction (MI) remains the leading cause of death in Western countries1. The ischemic damage initiated by an intracoronary thrombus precipitates severe hypoxia, inflammation, and edema2. While many organs can tolerate mild to moderate edema, even small increases in interstitial fluid volume can significantly compromise cardiac function3. A fundamental cause of edema is an increase in vascular permeability. Current evidence supports the potential of vascular leakage inhibitors to improve cardiac outcomes by reducing hyperpermeability in cardiac microvascular endothelial cells (CMVECs) and limiting neutrophil infiltration4. However, the mechanisms governing cardiac microvascular permeability remain underexplored as therapeutic targets in ischemic heart diseases.
The cellular response to hypoxia leads to the stabilization of Hypoxia-inducible Factors (HIFs), including Hif1α and Hif2α (HIF1A and HIF2A in humans)5,6,7, which form heterodimeric complexes with aryl hydrocarbon receptor nuclear translocator (ARNT) to activate hypoxia-inducible genes8,9,10,11. Hif1α and Hif2α have been linked to several physiological and pathological processes that have a role in heart disease. However, the two isoforms appear to function independently in cell-type–specific manner. Hif1α is ubiquitously expressed in all cell types and is recognized for cardioprotective role during ischemic12,13,14, where it helps reduce infarct size and protect cardiac cells. In contract, Hif2α expression is predominantly expressed in endothelial cells (ECs), and its role in cardiac pathology is more complex and variable15.
For example, in a mouse model of ischemia-reperfusion injury, the specific deletion of HIF2a in cardiomyocyte (but not Hif1α) led to larger infarct sizes8, However, pulmonary hypertension (PH) and right heart failure, HIF2a inhibition, such as PT2567 has shown promising effects16, reversing right heart failure and improving pulmonary vascular remodeling and hemodynamics in several preclinical models17,18. Interestingly, while hypoxia induces coronary microvascular dilation to enhance oxygen delivery to the myocardium, it triggers constriction in the pulmonary arteries19,20,21. This distinct vascular response raises important questions about the effects of HIF2α inhibition. The inhibition may offer benefits for pulmonary vascular conditions, as observed in pulmonary hypertension, but it could potentially impair oxygen delivery in ischemic heart conditions. Consequently, the net impact of HIF2α inhibition on ischemic heart disease, whether beneficial or detrimental, remains to be clarified.
Although HIF1α is generally considered to be the primary mediator of the hypoxia response pathway5,6,7, Hif2α expression has a protective role in kidney ischemia and myocardial ischemia-reperfusion injury8,22. Homozygous deletions of Hif2α are lethal during embryonic development23,24,25; However, mice with EC-specific deficiencies in Hif2α survive with various aberrant phenotypes23,26. Despite the evident role of Hif2α in myocardial disease, its specific functions in cardiac microvascular barrier function post-MI remain unclear. To address this knowledge gap, we generated a mouse model with an inducible, EC-specific Hif2α knockout (Hif2α iΔEC) to explore its role in this condition.
Our findings reveal that endothelial Hif2α deletion leads to increased cardiac microvascular permeability, disrupted barrier function, and elevated IL-6 expression in endothelial cells. Notably, ARNT overexpression reversed these effects in vitro, whereas an ARNT point mutation did not. Further, we demonstrate that Hif2α indirectly regulates IL-6 expression through ARNT binding at the IL-6 promoter. These results highlight a regulatory Hif2α/ARNT mechanism supporting vascular integrity and reducing inflammation post-MI.
Results
Endothelial Hif2α deletion impairs endothelial barrier function after MI
Our breeding program began with Hif2αflox/flox mice (C57BL/6 background; The Jackson Laboratory) and transgenic mice expressing tamoxifen-inducible Cre recombinase (CreERT2) under the control of the EC-specific VE-Cadherin promoter (Fig. 1A)27. After two generations, the Hif2αflox/flox+Cre offspring were fed tamoxifen chow for 2 weeks to generate the experimental ecHif2α–/–mice and control assessments were conducted with either Hif2αflox/flox mice fed tamoxifen chow or with Hif2αflox/flox+Cre mice fed normal (tamoxifen-free) chow. (Supplementary Fig. 1A, B). Mouse genotypes were verified via PCR (Fig. 1B), and the efficiency of ecHif2α knockout induction was confirmed via analysis of Hif2α protein expression and Hif2α mRNA abundance in primary ECs isolated from Hif2αflox/flox mice fed tamoxifen chow and ecHif2α–/– mice upon completion of the feeding protocol (Fig. 1C, D). The mice were phenotypically normal, with no significant changes in body weight, heart weight, blood pressure, or cardiac function (Supplementary Figs. 2–4). As neither control group showed any noticeable difference at baseline, for our study, we selected Hif2αflox/flox mice as the control group, minimizing animal use without losing experimental rigor.

Endothelial Hif2α Deletion Impairs Barrier Function in MI. A Schematic of the breeding strategy to generate endothelial cell-specific inducible Hif2α knockout mice (Hif2αiΔEC) B Genotyping was determined by PCR. C, D Western blot (WB) analysis of isolated cardiac microvascular endothelial cells (CMEVCs) lysates isolated from the indicated mice. One-way ANOVA with Tukey’s test, n = 3–5. E Quantification of Evans Blue dye extravasation from mouse hearts 24 h after MI. F, G Ex vivo ECIS assays for CMVECs from ecHif2α–/– and control (Ctr) mouse hearts. Confluent (90–100%) monolayers of control and ecHif2α–/– CMVECs were cultured in collagen-coated ECIS 8W10E+ arrays and treated with 1 mM DMOG to induce hypoxia. Data represent the mean ± SEM for n = 3 independent experiments. Statistical significance was determined using a two-way ANOVA with Sidak’s multiple comparisons test, with p < 0.05 considered significant. H Immunofluorescence staining of VE-Cadherin in control and ecHif2α–/– CMVECs, with (lower panel) quantification of VE-Cadherin intensity. I Immunofluorescence staining of VE-Cadherin in primary Human CMVECs) transfected with or without siHif2α and treated with 1% oxygen overnight. Nuclei were stained with DAPI (blue), and VE-Cadherin with Alexa Fluor (red). Scale bar: 30 µm. J WB analysis of whole cell lysates from HCMVECs transfected with either scrambled or siHif2α and treated with 1% oxygen for 16 h. Unpaired t-test. K Quantification of VE-Cadherin protein levels (n = 4). Unpaired t-test. L, M In vitro permeability measurement in HCMVECs treated with the HIF2α inhibitor PT2567 and exposed to hypoxia (12 h)-reoxygenation for 6 h. Nuclei were stained with DAPI (blue), VE-Cadherin with Alexa Fluor (red), and leakage was measured by fluorescein-streptavidin (green). Scale bar: 30 µm. N ELISA measurement of plasma IL-6 levels in MI-induced ecHif2α–/– and control mice. Unpaired t-test, n = 4–6. Results are shown as mean ± SEM.
MI was induced in ecHif2α–/– mice and in Control mice via ligation of the left anterior descending (LAD) coronary artery, and another group of ecHif2α–/– mice (the Sham group) underwent all surgical procedures for MI induction except coronary artery ligation (Supplementary Fig. 5). Evans Blue dye was injected into the tail veins of mice 12 h after MI induction or Sham surgery, and hearts were harvested 30 min later after Evans blue injection. Measurements of Evans blue extravasation were significantly greater in ecHif2α–/– hearts than in the hearts of Control or Sham mice (Fig. 1E), but significant differences were not observed between the two groups for organs under normoxic condition (Supplementary Fig. 6). In ex vivo measurements using the ECIS system, transendothelial resistance (TER) was significantly lower in monolayers of mouse cardiac microvascular endothelial cells (mCMVECs) from ecHif2α–/– mice than in control mCMVEC monolayers (Fig. 1F). Since the ECIS system cannot serve as a hypoxia chamber, we used DMOG (dimethyloxalylglycine) to mimic a hypoxic condition. Under these DMOG-induced hypoxic conditions, the differences were evident (Fig. 1F, G), but absent under normoxia (Supplementary Fig. 9). Furthermore when cells were cultured under hypoxic conditions, VE-cadherin was significantly less abundant in CMVEC isolated from ecHif2α–/– hearts than from Control hearts (Fig. 1H) and in human microvascular endothelial cells (HCMVECs) (Fig. 1I–K) as well as HUVEC (Supplementary Fig. 7) transfected with Hif2α siRNA than in control siRNA transfected cells. In addition, the expression of Zonula occludens-1 (ZO-1), a tight junction protein that plays a critical role in endothelial barrier function, was also reduced in HCMVECs with Hif2α deficiency under hypoxia conditions. (Supplementary Fig. 8).
Similarly, in vitro permeability assays using a hypoxia-reperfusion (HR) model showed increased leakage in HIF2A-inhibited HCMVECs (Fig. 1L, M). These results indicate that endothelial-specific loss of Hif2a expression increases vascular permeability in infarcted hearts, reduces junctional protein expression in cultured endothelial cells (ECs), and impairs barrier function in mCMVEC monolayers. Notably, 12 h post-MI, ecHif2α–/– mice exhibited elevated serum IL-6 levels, a pro-inflammatory cytokine compared with controls, implicating Hif2a in modulating inflammatory responses to cardiac injury, via IL-6 at least (Fig. 1N). In contrast, no significant changes in TNFα or IL-1β levels were observed (Supplementary Fig. 10). These data indicate that Hif2a plays a key role in maintaining endothelial integrity and regulating inflammation, likely mediated in part by IL-6, in response to cardiac injury.
Loss of ecHif2α increased mouse mortality and cardiac remodeling following myocardial infarction
Cardiac function was assessed using echocardiography (Fig. 2A) at baseline (prior to MI induction), as well as on days 7 and 28 post-MI. Initial evaluations of left ventricular ejection fraction (EF, Fig. 2B), fractional shortening (FS, Fig. 2C), and cardiac output (Fig. 2D) revealed no significant differences between ecHif2α–/– and Control mice. However, by day 7, EF had notably decreased in ecHif2α–/– mice, and by day 28, reductions were evident across all three parameters in this group. Examinations of hearts harvested on day 28 revealed that ecHif2α deletion resulted in pronounced heart enlargement, increased heart weight (Fig. 2E), elevated myocardial fibrosis, and greater inflammatory cell infiltration (Fig. 2F, G). The expression of Col13a1 and Lox3, genes involved in fibrotic processes, was markedly increased (Fig. 2H and Supplementary Fig. 11A), aligning with enhanced pathway activity related to fibrosis and heart failure, as depicted in Fig. 3. Corresponding to these alterations, heart failure markers, such as Bnp and Npr3, were significantly higher in ecHif2α–/– mice (Fig. 2I, J), suggesting a molecular underpinning for the observed phenotypic changes (Fig. 2H, I). Critically, survival rates substantially declined in ecHif2α–/– mice compared to their Control (Fig. 2K), demonstrating the potential of ecHif2α as a key factor in survival post-MI.
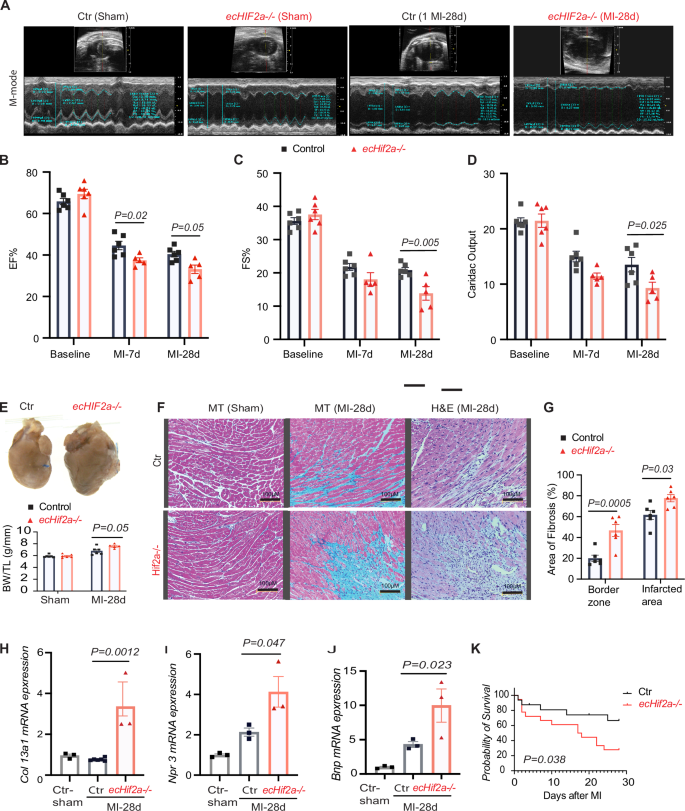
A Comparison of cardiac function in Control and ecHif2α–/– mice, assessed at 7- and 28-days post-MI with representative M-mode echocardiography images. B–D Measurements of ejection fraction (EF), fractional shortening (FS), and cardiac output at various time points post-MI (n = 5, 6). E Representative images of hearts at 28 days post-MI, with a summary of heart weight normalized to tibia length shown below. F Histological analysis of heart sections stained with hematoxylin-eosin (H&E) and Masson’s trichrome (MT). G Quantitative analysis of fibrosis using ImageJ software. H–J qPCR assessment of mRNA levels for selected genes Col13a1, Npr3, and Bnp in heart tissues. Data are represented as mean ± SEM. K Kaplan–Meier survival curve post-MI, n = 34, p = 0.038. Two-way ANOVA with Bonferroni post hoc tests for echocardiographic measures. (n = 5, 6 mice per group). For fibrosis quantification and mRNA levels, apply one-way ANOVA with Tukey’s test (n = 3–6 samples per group).
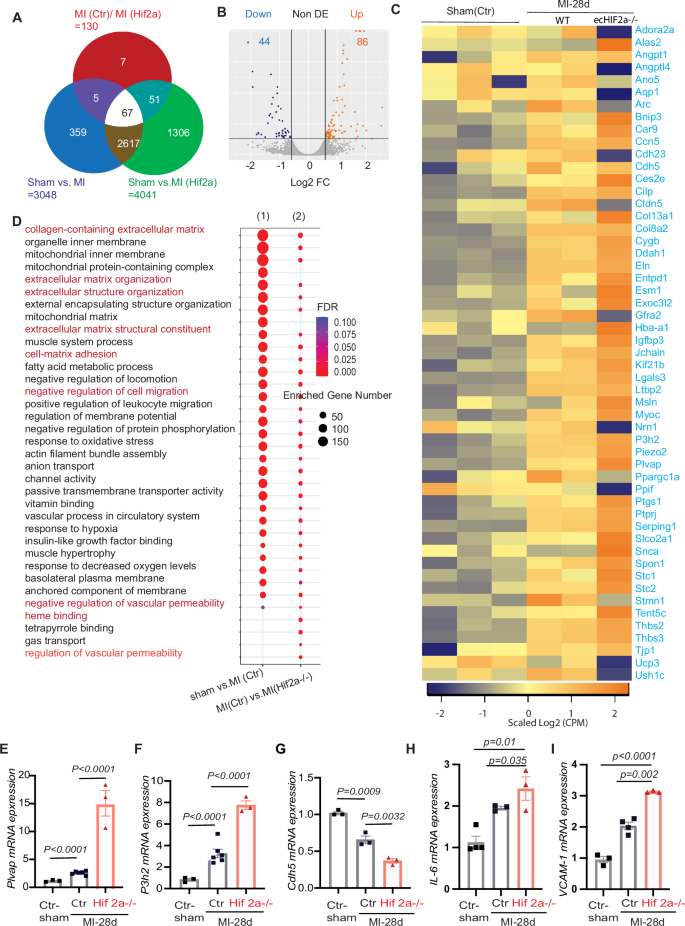
A Venn diagram showing the overlap of MI induced genes between controls and ecHif2α–/– heart tissues. B Volcano map of differentially expressed genes between controls and ecHif2α–/– heart tissues. Orange dots represent the upregulated genes, and dark blue dots represent the downregulated genes. C Heatmap of differentially expressed genes in MI induced controls and ecHif2α–/– heart tissues. D KEEG pathway enrichment analysis of differentially expressed genes in controls and ecHif2α–/– samples shows dysregulation of multiple signaling pathways associated endothelial barrier function. mRNA expression analysis of Plvap (E), P3h2 (F), Cdh5 (G), IL-6 (H), and Vcam-1 (I) in controls and ecHif2α–/– samples after 28 days of MI. Data are presented as mean ± SEM. DESeq2 for RNA-Seq differential expression analysis with adjusted p-values for gene comparisons (n = 3 biological replicates per group). KEGG pathway enrichment analysis includes adjusted p-values for significance. qRT-PCR: one-way ANOVA with Tukey’s multiple comparisons test, n = 3–4 biological replicates per condition.
Differential gene expression profiles in ecHif2α
–/– mice reveal altered vascular dynamics post-myocardial infarction
Heart tissues subjected to bulk RNA sequencing 28 days post-myocardial infarction (MI) or sham operation unveiled distinct changes in gene expression in ecHif2α–/– mice compared to controls. Of 130 differentially expressed genes (DEGs), 86 were upregulated, and many were implicated in increasing vascular permeability and promoting fibrosis. (Fig. 3A, Supplementary Table 1). Conversely, the remaining 44 downregulated DEGs included many of those that promote vascular barrier function (Fig. 3B, C). These observations were supported by pathway enrichment analysis, which indicated that genes involved in vascular permeability, cell migration, and cell-matrix adhesion were significantly enriched in the DEGs (Fig. 3D). Moreover, measurements of mRNA abundance confirmed that regulators of vessel-permeability and collagen synthesis (plvap and P3h2 respectively) were more highly expressed (Fig. 3E, F). In contrast, key regulators of endothelial barrier function (such as cdh-5, tjp-1, and angpt-2) exhibited diminished expression compared to Control hearts (Fig. 3G, H and Supplementary Fig. 11B, C). Notably, the ecHif2α deletion was also associated with a significant increase in mRNA levels for the inflammatory IL-6 and VCAM-1 (Fig. 3H, I), while ICAM and e-selectin expression tended to be greater (though not significantly) in infarcted ecHif2α–/– hearts than infarcted Control hearts (Supplementary Fig. 12) which is consistent with our observation that the MI-induced cardiac infiltration of inflammatory cells was more significant in ecHif2α–/– mice than in control mice.
Hif2α deficiency impairs angiogenetic activity and promotes apoptosis in cultured endothelial cells (ECs) under hypoxia
Because vascular permeability and angiogenesis are closely linked28,29, we investigated whether the aberrations in vascular barrier function associated with ecHif2α deletion were accompanied by changes in the angiogenic activity of ECs. Using a tube formation assay on Hif2α-silenced HUVECs, we observed a marked decrease in the complexity of the angiogenic network under hypoxic conditions, as evidenced by fewer nodes and junctions compared to control cells (Fig. 4A). This impairment was quantifiable; both the meshwork and the total length of the tubes formed were considerably reduced in Hif2α-deficient cells in both normal and low-oxygen environments (Fig. 4B–E).
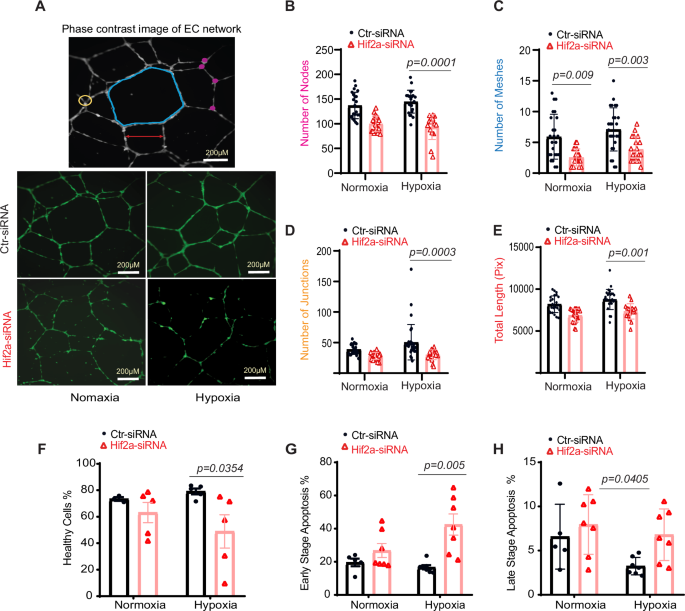
A HUVEC network visualization via Image J. Top: meshes (blue), nodes (pink), junctions (yellow), and segment lengths (red). Bottom: capillary-like structures from 6 to 16 h post-seeding. Metrics for nodes (B), meshes (C), junctions (D), and total length (E), n = 24. F–H Apoptosis in HUVECs post Hif2α silencing. Cells were transfected with Hif2α siRNA or control and subjected to 1% oxygen or normoxia. Flow cytometry assessed healthy (F), early apoptotic (G), and late-apoptotic cells (H) using 7-AAD labeling. Statistical analysis via two-way ANOVA with Sidak’s test.
Further analysis under normal oxygen conditions showed no significant differences in cellular health or apoptosis between Hif2α-deficient HUVECs and controls (Fig. 4F–H). However, under low oxygen, a condition mimicking the post-MI environment, Hif2α-silenced HUVECs exhibited a marked increase in early-stage apoptosis (Fig. 4G). These observations collectively imply that Hif2α is essential for maintaining angiogenic processes and endothelial cell survival, particularly in hypoxic conditions like those found in infarcted myocardial tissue.
Restoration of endothelial barrier integrity by ARNT overexpression in Hif2α-deficient endothelial cells
Given the heterodimeric function of Hif2α with ARNT11, we investigated whether ARNT overexpression could mitigate the deleterious effects of Hif2α deficiency in ECs. Experiments were conducted in HCMVECs and HUVECs that were transfected with siHif2α or control (scrambled) siRNA, and co-transfected with vectors coding for wild-type ARNT (ARNTWT) or an ARNT mutant)30. The nuclear localization of overexpressed ARNT was confirmed and behaved as anticipated. (Supplementary Fig. 13). Notably, overexpression of ARNTWT, but not ARNTmut, reduced hypoxia-induced apoptosis (Fig. 5A) and restored VE-cadherin (VE-CAD) expression to normal levels in HIF2a-deficient HCMVECs (Fig. 5B). To further investigate barrier integrity, we employed Electric Cell-substrate Impedance Sensing (ECIS) to assess monolayer barrier function in HUVECs. Under hypoxic conditions induced by dimethyloxalylglycine (DMOG), barrier integrity was compromised, while normoxic conditions showed no significant barrier disruption (Fig. 5C, D). Measurements of minimum resistance, taken 40 min after hyperpermeability induction via thrombin treatment, revealed enhanced barrier function in HUVEC monolayers transfected with both siHif2α and ARNTWT compared to cells transfected with siHif2α alone or siHif2α with ARNTmut (Fig. 5E). (Note: The ECIS system cannot directly induce hypoxia; DMOG is employed to generate cellular hypoxia mimetic to assess cellular barrier integrity.
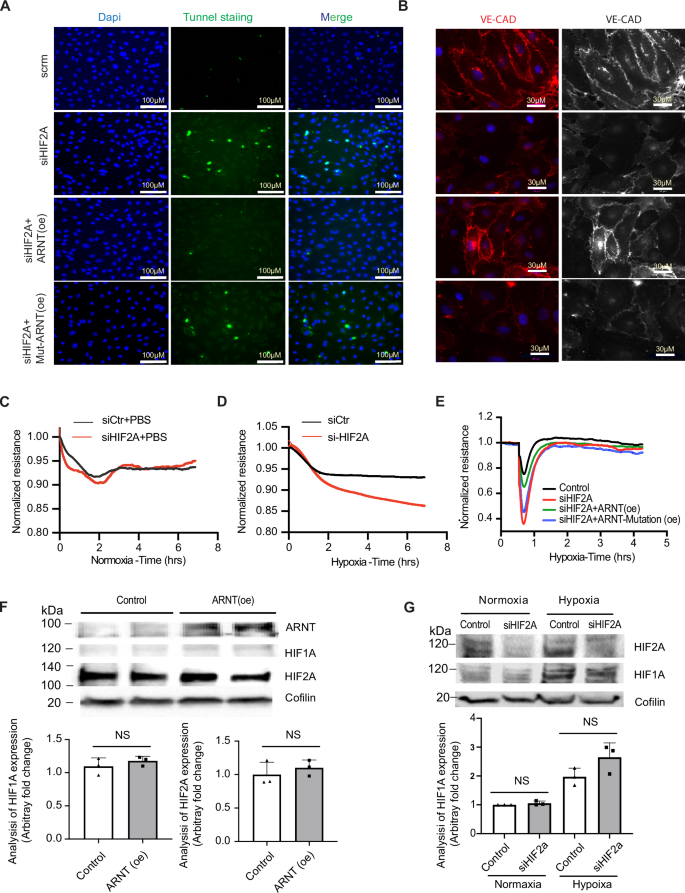
A Tunnel staining in HCMVECs transfected with siHif2α and overexpressed with either ARNT-WT or Mutant-ARNT post 1% O₂ exposure for 16 h. B Immunofluorescence of VE-Cadherin in HCMVECs with Hif2α silencing and either ARNT-WT or Mutant-ARNT overexpression. ECIS post Hif2α silencing and treatment with PBS (C) or DMOG (D), n = 4. E ECIS in HCMVECs post Hif2α silencing and overexpression of either ARNT-WT or Mutant-ARNT, followed by 16 h DMOG exposure, n = 3–4 independent experiments. F, G Western blots showing levels of ARNT, HIF1A, and HIF2A after different transfections, Coflin as control. Data represented as mean ± SEM; NS indicates no significance. Statistical analysis: for TUNEL staining, VE-Cadherin quantification, and ECIS measurements, use one-way ANOVA with Tukey’s test for different ARNT variants (n = 3–5 independent experiments). Two-way ANOVA for treatment comparisons with/without DMOG (n = 3 experiments per condition).
Analysis of HIF1α protein levels under hypoxic conditions following ARNT overexpression or Hif2α knockdown indicated stable HIF1α levels, suggesting that observed phenotypic changes were not due to compensatory effects of HIF1α (Fig. 5F, G). Similarly, data from HUVECs revealed that deletion of either HIF2α or ARNT did not alter HIF1α levels, nor did ARNT levels change under hypoxia with HIF1α or HIF2α deletion (Fig. 6A–G). Notably, deletion of either HIF1α or ARNT resulted in elevated HIF2α protein levels, indicating a regulatory balance between these factors.
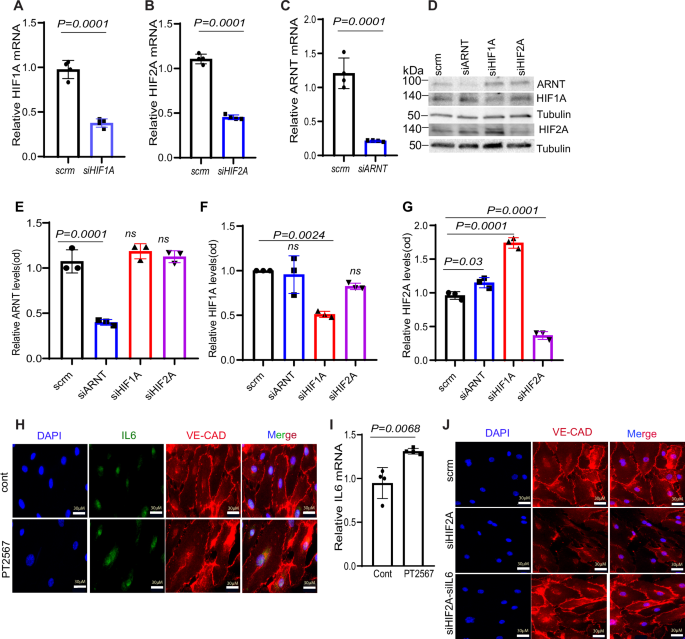
A–C qPCR analysis reveals the significant reduction in mRNA levels of HIF1A, HIF2A, and ARNT in HUVECs following transfection with the specified siRNAs. D Representative Western blot demonstrating the impact of siRNA-mediated knockdown on ARNT, HIF1A, and HIF2A protein levels in HUVECs exposed to 1% oxygen for 16 h. E–G: Quantitative analysis of protein levels for ARNT, HIF1A, and HIF2A using ImageJ. (n = 3–4). H Immunofluorescence staining illustrates IL-6 suppression in HCMVECs treated with 10 μM PT2567 (an HIF2A inhibitor) under hypoxia. DAPI (nucleus, blue), IL-6 (green), and VE-Cadherin (red) staining. Scale bar = 30 μm. I RT-PCR analysis of IL-6 mRNA levels demonstrates a marked reduction in PT2567-treated HCMVECs exposed to hypoxia, J Immunofluorescence images display VE-Cadherin distribution in HCMVECs following IL-6 and HIF2α knockdown via siRNA. Cells were subjected to 1% hypoxia overnight. Statistical analysis: one-way ANOVA with Tukey’s test for qPCR and Western blot quantification of HIF pathway components (n = 3–5 biological replicates per group). For immunofluorescence quantification, use Student’s t-test.
In HCMVECs, we knocked down HIF2A using siRNA, and ARNT overexpression rescued this reduction (Supplementary Fig. 14). Moreover, treatment with the HIF2α inhibitor PT2567 led to enhanced IL-6 expression, which was associated with reduced VE-cadherin expression, a critical component of endothelial barrier integrity (Fig. 6H). The PT2567-induced increase in IL-6 mRNA was confirmed (Fig. 6I). Notably, the reduction in VE-cadherin expression caused by HIF2α deficiency was reversed by IL-6 knockdown via siRNA, suggesting that HIF2α may regulate barrier integrity, at least partially, through IL-6-mediated disruption of junctional proteins (Fig. 6J).
HIF2α regulates IL-6 expression through direct binding of ARNT to the IL-6 promoter
Our study explored the mechanisms by which ARNT may counteract increased inflammation associated with Hif2α reduction. In human cardiac microvascular endothelial cells (HCMVECs), the absence of ARNT alone elevated levels of IL-6 protein expression and other increased inflammatory and immune marks, inducing IL-6, ICAM, VCAM-1, and TNFα mRNA (Fig. 7A–D).
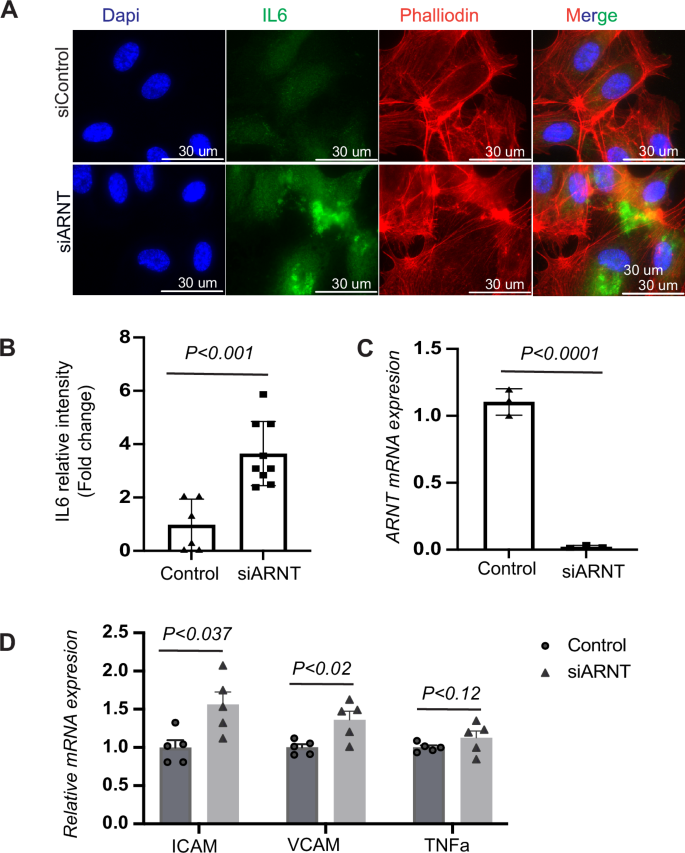
A Analysis of IL-6 expression and intensity following ARNT deletion in HCMVECs. HCMVECs underwent siRNA mediated ARNT knockdown for a period of 48–72 h, followed by an exposure to 1% hypoxia overnight. Immunofluorescence staining illustrates IL-6 expression highlighted in green, with the nuclei counterstained in blue using DAPI. The scale bar denotes 30 μM. B Quantitative analysis of IL-6 intensity from the immunofluorescence staining. C Analysis of ARNT mRNA levels post-siRNA treatment. Data are presented as mean ± SEM. D Analysis of inflammatory marker expression post-ARNT deletion. Human microvascular endothelial cells (HCMVECs) underwent siRNA-mediated ARNT knockdown for 48–72 h and were subsequently subjected to 1% hypoxia overnight. Control siRNA treatment is represented as scramble (Scrm). Assessed genes encompass the intercellular adhesion molecule (ICAM), vascular cell adhesion molecule (VCAM), and tumor necrosis factor alpha (TNFα). Data are denoted as mean ± SEM. Statistical analysis: one-way ANOVA with Tukey’s test for IL-6 intensity and mRNA levels of inflammatory markers (n = 3–6 per group). For two-group comparisons, use Student’s t-test.
Notably, ARNT overexpression reversed the increase in IL-6 levels induced by HIF2α knockdown in HCMVECs (Fig. 8A). Similar trends were observed in TeloHAECs (human aortic endothelial cells) under hypoxic conditions, where co-transfection with siHIF2α and ARNTWT resulted in reduced levels of IL-6, ICAM, VCAM-1, and TNFα mRNA (Fig. 8A–F).
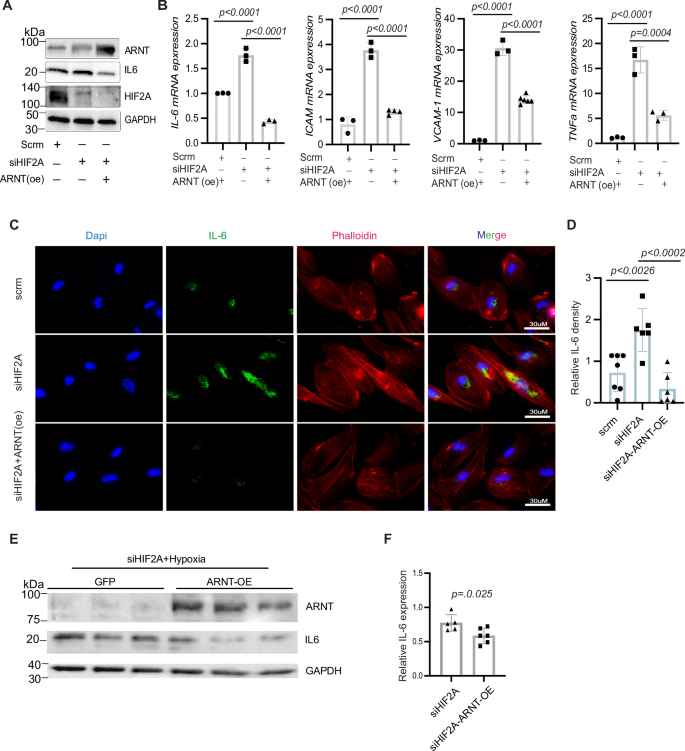
A Western blot analysis of ARNT, IL-6, and Hif2α in HCMVECs transfected with Hif2α siRNA and either overexpressed with ARNT or an empty vector under hypoxic conditions. B Analysis of mRNA expression levels of IL-6, ICAM, VCAM-1, and TNFα in HAECs. 18 s rRNA serves as an internal control. C Immunofluorescence staining of IL-6 in HAECs; phalloidin staining highlights cellular skeletal structure. D Quantitative analysis of IL-6 fluorescence intensity in HAECs. E Western blot of ARNT and IL-6 in HAECs transfected with Hif2α siRNA, either overexpressed with ARNT or GFP serves as a control and exposed to 1% O₂ for 16 h. Data represented as mean ± SEM. F Quantification of IL-6 levels. Statistical analysis: one-way ANOVA with post hoc Tukey’s test for Western blot and fluorescence intensity quantification of IL-6, ICAM, VCAM-1, and TNFα (n = 3–5 experiments). Use Student’s t-test for two-group comparisons.
Further experiments using an IL-6-luciferase reporter in HEK293 cells showed decreased luciferase activity under hypoxia (Fig. 9A, B). In contrast, siHIF2α transfection alone led to increased activity, which was effectively reduced by co-transfection with siHIF2α and ARNTWT but not with ARNTmut (Fig. 9C). Chromatin immunoprecipitation followed by qPCR (ChIP-qPCR) confirmed direct binding of ARNT and HIF1α, but not HIF2α, to the IL-6 promoter (Fig. 9D–F), indicating ARNT’s regulatory role in IL-6 expression within the HIF2α signaling pathway.
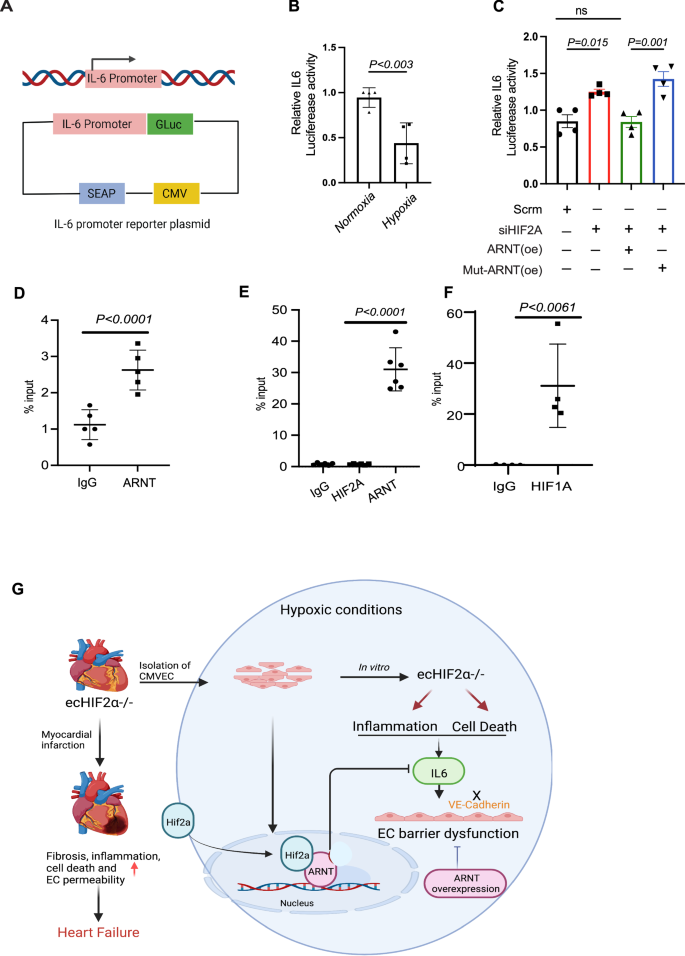
A Schematic representation of the IL-6 promoter reporter construct. B Analysis of normalized IL-6 promoter activities in HEK293 cells. Cells transfected with the human IL-6 dual-reporter promoter construct were either exposed to ambient oxygen levels or subjected to 1% oxygen for 24 h (n = 4). C Protocol followed in HEK293 cells: Initial transfection was with or without controls and Hif2α siRNA. Post 24 h, a dual-reporter vector containing the human IL-6 promoter was introduced and allowed to incubate overnight. Concurrently, cells underwent transfection with lentiviral vectors encoding ARNT-WT or ARNT-Mut. This was followed by a 1% oxygen treatment for 24 h prior to sample collection (n = 4). D–F ChIP-qPCR analysis of IL-6. HEK293 cells either underwent a 1% oxygen treatment or were transfected with an ARNT-encoding lentivirus before exposure to 1% oxygen. Chromatin immunoprecipitation was performed using the indicated antibodies. Data represented as mean ± SEM G Diagram of Mechanism of Hif2α/ARNT-mediated regulation of cardiac endothelial barrier function and cardiac function during myocardial infarction. Statistical analysis: one-way ANOVA with Tukey’s test for IL-6 promoter activity analysis and ChIP-qPCR data (n = 3–4 replicates per condition). For two-group comparisons, use Student’s t-test.
Discussion
In this study, we identify the HIF2α/ARNT axis as a critical regulator of cardiac microvascular endothelial barrier integrity following myocardial infarction (MI). Our findings reveal that endothelial-specific Hif2α deficiency exacerbates vascular permeability and exacerbates cardiac remodeling by impairing junctional protein expression, such as VE-cadherin and Zonula occludens-1. Additionally, the elevated serum IL-6 levels and impaired angiogenic response in Hif2α-deficient endothelial cells emphasize its pivotal role in modulating inflammation and angiogenesis under hypoxic conditions. Importantly, the suppression of IL-6 transcription through ARNT overexpression highlights the therapeutic potential of the HIF2α/ARNT axis in improving recovery after MI. Collectively, our findings align with previous reports linking microvascular dysfunction to a variety of pathological processes, including inflammation, apoptosis3,31 and impaired angiogenesis32,33 emphasize the critical role of Hif2α/ARNT heterodimers in preserving endothelial barrier integrity and function in ischemic hearts.
Impact of endothelial HIF2α deficiency on vascular permeability following MI
The use of inducible endothelial cell-specific Hif2α knockout mice (Hif2αiΔEC) allowed for a targeted investigation into the role of Hif2α within the endothelium in adult mice, revealing that its absence led to increased vascular permeability and reduced expression of junctional proteins like VE-cadherin and ZO-1. VE-cadherin, a primary tight junction protein, is crucial in maintaining endothelial barrier integrity34. The perturbed integrity of the endothelial barrier in ecHif2α–/– mice was further validated by the pronounced Evans Blue extravasation in infarcted hearts and decreased transendothelial resistance (TER) observed with the ECIS system. We selected the permanent ligation (PL) model for this study as it reflects the long-term effects of sustained ischemia, enabling us to focus on chronic heart failure and its impact on endothelial function and cardiac remodeling. This model provides valuable insights into prolonged ischemic injury, which is critical for assessing the protective role of HIF2α in a chronic setting. While the ischemia-reperfusion (I/R) model may offer more clinical relevance for studying reperfusion injury, our primary objective was to explore the consequences of chronic ischemia on vascular permeability and inflammation. The I/R model would highlight more acute changes in HIF2α/ARNT signaling, potentially yielding different dynamics.
To address this limitation of MI animal model, we supplemented experiments with hypoxia-reoxygenation (HR) experiments in vitro using human cardiac microvascular endothelial cells (HCMVECs) to mimic ischemia-reperfusion injury. These experiments allowed us to assess the role of HIF2α in maintaining endothelial barrier function under conditions that simulate reperfusion injury. Together with the findings from the PL model, these results offer valuable insights into how sustained ischemia affects endothelial integrity and cardiac function, laying the groundwork for future studies on both acute and chronic ischemic injury. These findings align with the current understanding that endothelial junctional disruption correlates with increased vascular permeability in pathological conditions35,36. The decline in endothelial barrier integrity leads to cardiac vascular leakage and edema, likely facilitating the infiltration of inflammatory cells and substances into the myocardium, thereby worsening cardiac injury and remodeling. These changes were mirrored by a significant decline in cardiac function in ecHif2α–/– mice, particularly noted in the deterioration of ejection fraction, fraction shortening, and increased myocardial fibrosis. However, a study also reported that increased microvascular permeability in the heart Induced diastolic dysfunction independently of inflammation, fibrosis, or cardiomyocyte dysfunction37.
Link between endothelial HIF2α deletion and cardiac fibrosis post-MI
Our findings reveal a significant association between endothelial HIF2α deletion and the upregulation of fibrotic genes following myocardial infarction (MI). The absence of HIF2α in endothelial cells appears to impair barrier function, leading to increased vascular permeability and allowing inflammatory mediators to infiltrate cardiac tissue. This vascular dysfunction likely exacerbates myocardial injury and may drive fibroblast activation, creating conditions conducive to fibrosis. Elevated IL-6 levels in HIF2α-deficient endothelial cells suggest that HIF2α plays a role in modulating inflammation after MI, with IL-6 potentially promoting fibroblast activation and collagen synthesis, contributing to cardiac tissue stiffening.
Additionally, our study identifies the upregulation of pro-fibrotic genes, such as Col13a1 and Lox3, in HIF2α-deleted models, suggesting a potential link between HIF2α and fibrotic processes. While direct evidence for HIF2α’s regulation of EndMT in fibrosis was not established in our study, these gene expression changes may indicate a preparatory state for fibrotic remodeling. Future studies are necessary to dissect the pathways through which HIF2α might influence EndMT and fibrosis progression, particularly by examining whether HIF2α deficiency predisposes endothelial cells to transition towards a mesenchymal phenotype under specific conditions.
HIF2α’s role in angiogenesis and inflammatory modulation
Our study broadens the established functions of HIF2α to include its involvement in angiogenesis under hypoxic conditions. The observed reduction in angiogenic activity, as demonstrated by impaired tube formation in Hif2α-silenced HUVECs, suggests that Hif2α is essential for the angiogenic response following hypoxic stress. This is particularly critical in the post-MI healing process, where angiogenesis is crucial for tissue repair and recovery. Moreover, Hif2α appears to regulate inflammatory processes differently in endothelial cells compared to cardiac myocytes, as demonstrated by the negative regulation of IL-638. The elevated IL-6 levels in ecHif2α–/– mice post-MI correlate with increased vascular permeability and inflammation. Previous studies show that HIF activation is often associated with inflammation39,40,41 and that inflammation destabilizes junctional proteins, increasing permeability42,43,44,45. IL-6 is a prominent regulator of both inflammation and vascular permeability46. IL-6 can disrupt VE-cadherin-mediated adherens junctions by promoting VE-cadherin phosphorylation or associated proteins such as β-catenin. This leads to the internalization or degradation of VE-cadherin, weakening cell-cell adhesion and increasing barrier permeability47. Although the role of IL-6 induction in the ECs of infarcted hearts has yet to be thoroughly characterized31,48,49, inhibition of IL-6 attenuates inflammation and prevents endothelial barrier disruption in retinal ECs50. Here, we provided direct evidence that limiting IL-6 expression can restore VE-cadherin expression impaired by HIF2a deficiency, reinforcing the importance of HIF2α in regulating endothelial barrier integrity.
Therapeutic potential of targeting the HIF2α/ARNT axis
Our identification of the HIF2α/ARNT axis as a modulator of IL-6 transcription presents a promising target for therapeutic interventions to reduce inflammation and preserve endothelial function in ischemic heart disease. In our study, it was found that Hif2α does not directly bind to the IL-6 promoter but rather indirectly through ARNT. Although HIF2α does not directly bind to the IL-6 promoter, its influence through ARNT underscores the therapeutic potential of ARNT in attenuating inflammatory responses. The role of Hif2α in regulating inflammation appears to be intensely dependent on cell type17,51,52,53. The HIF2α/ARNT axis, with its role in gene regulation in endothelial cells, provides a mechanistic basis for why different cell types might respond differently to hypoxic stress.
Hypoxia is a primary pathological component in ischemic cardiovascular conditions, particularly ischemic heart disease, its effects being mediated on a molecular level largely by hypoxia- inducible factors (HIFs)54. Our study aligns with the existing studies on the therapeutic benefits of hypoxia in cardiovascular diseases54,55,56, suggesting that the HIF2α/ARNT axis within the microvasculature exerts a protective role during MI. Controlled hypoxia thus emerges as a viable therapeutic avenue54. Our study demonstrated that overexpression of ARNT can counteract the inflammatory and permeability effects observed in HIF2α-deficient human microvascular endothelial cells. However, further in vivo studies are needed to investigate the role of ARNT overexpression after MI. While mice carrying a non-inducible EC-specific Hif2α knockout mutation develop normally23, the EC-specific deletion of ARNT leads to liver necrosis, cardiac hemorrhage, and embryonic lethality57, emphasizing that ARNT may have critical, cell-specific functions across various tissues. Future studies could investigate how the HIF2α/ARNT axis impacts endothelial function in other pathological conditions, broadening our understanding of its role in tissue-specific responses to injury and inflammation58.
Collectively, this study demonstrates the potential therapeutic value of targeting the HIF2α/ARNT pathway for MI. Further research should focus on the broader roles of the Hif2α/ARNT axis in different pathologies, as well as the in vivo effects of ARNT overexpression post-MI recovery. These avenues could provide valuable insights and drive the development of therapeutic strategies for cardiovascular diseases.
Methods
Study design
Following left anterior descending (LAD) coronary artery ligation-induced myocardial infarction, mice were randomly assigned to one of four groups: (1) Sham-operated control, (2) Sham-operated ecHif2α–/–, (3) Control MI, and (4) ecHif2α–/– MI. Mice that did not survive the operation were excluded from the analysis. To ensure unbiased analysis, all echocardiographic, cellular, and molecular assessments were conducted in a blinded manner.
Animal studies and ethical approval
We have complied with all relevant ethical regulations for animal use. The animal research in this study was conducted in accordance with the National Institutes of Health (NIH) Guide for the Care and Use of Laboratory Animals and was approved by the Institutional Animal Care and Use Committee (IACUC) of the University of Chicago. All procedures were performed following ethical guidelines to minimize animal suffering and reduce the number of animals used. We generated adult endothelial-specific inducible Hif2α-deficient mice using the CreERT2/Lox system. Experiments were performed on 10- to 12-week-old female and male mice weighing 22–25 g. Inducible ecHif2α–/– mice were generated by crossing mice carrying a loxP site flanking exon 2 of the endothelial PAS domain protein 1 (EPAS1) with transgenic mice under the control of the VE-Cadherin promoter. VE-cadherin-CreERT2 mice were generated by The Jackson Laboratory using sperm from the VE-Cadherin-CreERT2 mouse line, which was a gift from Yoshiaki Kubota (Keio University, Tokyo, Japan) to Dr. James Liao. Hif2α flox/flox mice were purchased from the Jackson laboratory. Deletion of Hif2α was achieved via oral administration of tamoxifen (30 mg/kg) for 2 weeks. After 2 weeks of normal chow, the mice underwent experimental protocol. The system was shown to be successful in knocking out ARNT59. Two groups served as the control groups (littermate Hif2α flox/flox treated with tamoxifen or Cre, Hif2α flox/flox without tamoxifen).
Genotyping
According to the manufacturer’s protocol, genetic DNA was isolated from the mouse tails using a DNA isolation kit (QIAGEN DNA isolation kit). Genotyping of Hif2α mice was determined by PCR amplification. Hif2αfl/fl mice were determined by PCR amplification (forward primer: 5′-AGGCAGTATGCCTGGCTAATTCCAG-3′; reverse primer: 5′-TCT TCCATCATCTGGGATCTGGGAC-3′). Primers were also used for genotyping VE-Cadherin-CreERT2 mice (forward primer: 5′-GCG GTC TGG CAG TAA AAA CTA TC-3′; reverse primer: 5′-GTG AAA CAG CAT TGC TGT CAC TT-3′).
Coronary artery ligation-induced myocardial infarction model in mice
The myocardial infarction (MI) animal model was used as previously described with some modifications60. In summary, mice were anesthetized using isoflurane, with induction at 3% and maintenance at 1.5–2% (mixed with 100% oxygen to maintain anesthesia throughout the procedure). The animals were placed in a supine position on a heating pad to maintain normothermia (about 37 °C). Electrocardiogram (ECG), heart rate, and respiratory rates were continuously monitored. Mice were then intubated and ventilated with a tidal volume of 200 μl and a rate of 105 breaths/min using a rodent ventilator Harvard Apparatus rodent ventilator). MI was induced by permanent ligation of the LAD coronary artery using an 8–0 nylon suture about 1 mm under the tip of the left atrium. Successful ligation was verified by the pallor of the anterior wall of the left ventricle and by ST-segment elevation and QRS widening on the ECG. Sham surgeries were performed using an identical procedure, except no sutures on the coronary artery were placed. The chest was then closed in layers. The mice were kept warm with heating pads and were given 100% oxygen via nasal cannula. Animals were given buprenorphine for post-operative pain.
In vivo blood vessel permeability assessment
Cardiac vascular permeability in vivo was assessed with Evans Blue as described61. To summarize, 0.5% Evans Blue was injected into the tail veins of mice 30 min before sacrificing them. The level of cardiac vascular permeability was assessed by quantitative measurement of the Evans Blue incorporated per milligram of tissue in the control versus experimental mouse heart. The concentration of Evans Blue was measured spectrophotometrically at 620 nm and expressed as milligrams of dye per gram of wet tissue weight.
Echocardiographic image acquisition
The echocardiography was conducted using a Visual ASonics Vevo 2100 with MS400 linear array transducer machine in mice under anesthesia at baseline, 14th day, and 28th day after MI as previously described59. Animals were anesthetized with 1% isoflurane and were placed in a supine position. Both parasternal long and short-axis M-mode images were recorded, and analyses were performed. At least 10 independent cardiac cycles per experiment were obtained. The echocardiographer was blinded to the mouse genotype.
Measurement of blood pressure by tail-cuff plethysmography
To evaluate the effect of Hif2α deletion on blood pressure, we measured the blood pressure of mice 1 week after completing tamoxifen treatment and compared it to the blood pressure of control mice. We utilized a noninvasive blood pressure acquisition system specifically designed for mice and performed all measurements through tail-cuff plethysmography, as previously described62. To ensure accurate readings, mice were habituated to the measurement procedure for at least 1 week prior to recording baseline blood pressure values.
Histology
After 1 month of MI induction, the mouse hearts were harvested under 3% isoflurane anesthesia. The hearts were then immediately fixed in 10% PBS-buffered formalin for 24 h at room temperature. Following fixation, the hearts were dehydrated in graded alcohol, cleared in xylene, and embedded in paraffin. Serial sections of 5-μm thickness were cut using a microtome and mounted on slides. The sections were then stained with hematoxylin and eosin (H&E) to visualize the tissue architecture and Masson’s trichrome stain to evaluate the extent of fibrosis. The stained sections were imaged using an Echo Revolve microscope and analyzed using ImageJ software. The evaluation of histological sections was performed in a blinded manner by an independent pathologist/investigator of the University of Chicago to avoid observer bias.
Cell culture
Human Microvascular Endothelial Cells (HMVEC; Cell Biologics, Catalog No. H-6024), Human Umbilical Vein Endothelial Cells (HUVEC; ATCC, Catalog No. PCS-100-013), immortalized human aortic endothelial cells (TeloHAEC; ATCC, Catalog No. CRL-4052), murine cardiac microvascular endothelial cells (HCMVEC), and HEK293 cells (ATCC, Catalog No. CRL-1573) were utilized in this study. HCMVECs were cultured in endothelial cell growth medium (Cell Biologics). HUVECs and TeloHAECs were maintained in M-199 medium (Invitrogen) supplemented with 20% fetal calf serum (Gibco), 25 mM HEPES, 2 mM L-glutamine, 100 U/mL penicillin G, 100 µg/mL streptomycin sulfate (BioWhittaker), 100 µg/mL heparin (Sigma), and 100 µg/mL Endothelial Cell Growth Supplement (ECGS; Biomedical Technologies, Inc.). All endothelial cells were cultured in T75 flasks at 37 °C under normoxic conditions (21% O2, 5% CO2). For hypoxia experiments, endothelial cells were exposed to 1% O₂ (balanced with 5% CO2 and 95% N2) for 16 h using an InVivo₂400 hypoxia workstation (Ruskinn Technologies).
Cell line authentication and quality control
None of the cell lines used in this study were listed in the International Cell Line Authentication Committee (ICLAC) or NCBI BioSample databases of commonly misidentified cell lines. All cell lines were routinely tested for mycoplasma contamination. Endothelial cell lines were further verified through the quantification of CD31 expression by qRT-PCR.
Isolation of murine cardiac microvascular endothelial cells
Mouse hearts from ecHif2α–/– and control mice were harvested and cut into pieces, digested with collagenase, and then labeled with CD31 conjugated magnetic beads for EC positive selection, as we previously reported9.
Isolation of cardiomyocytes from mouse hearts
Cardiomyocytes (CMs) were isolated from both control and hif2a −/− hearts to serve as controls for the endothelial hif2a deletion. The procedure adhered to the established method detailed in ref. 63. Briefly, mice were euthanized in compliance with institutional guidelines, and their hearts were immediately excised and immersed in an ice-cold Ca²⁺-free perfusion buffer containing (in mM): 113 NaCl, 4.7 KCl, 0.6 KH₂PO₄, 0.6 Na₂HPO₄, 1.2 MgSO₄, 10 HEPES, 12 NaHCO₃, 10 KHCO₃, 10 Glucose, and 30 Taurine, adjusted to pH 7.4. The heart’s aorta was subsequently cannulated and then mounted onto a Langendorff apparatus for perfusion at a rate of 3 ml/min. Following a 4–5-min perfusion with the Ca²⁺-free buffer, the solution was changed to an enzyme-rich buffer containing 0.2% collagenase type II and 0.025% protease. This continued until the heart tissue exhibited a softened consistency, approximately after 8–12 min. Subsequently, ventricles were minced and combined with the enzyme buffer. Through gentle agitation, cardiomyocytes were liberated, and the resultant mixture was passed through a 100 μm mesh filter. After a brief centrifugation at 20 × g for 2 min, the cells were resuspended in a stop buffer enriched with 10% FBS and incremental additions of CaCl₂ (ranging from 50 μM to a final concentration of 1 mM). The final cell preparation was suspended in M199 medium fortified with 10% FBS and 1% penicillin/streptomycin. The viability of the isolated cardiomyocytes was determined using a trypan blue exclusion test.
siRNA transfection
A predesigned small interfering RNA (siRNA) targeting Hif2α (siHif2α) (Silencer Select Pre-Designed siRNA, Cat#: AM16708) and a non-targeted control siRNA (siCont) (Silencer Select Negative Control, #4390843) were purchased from ThermoFisher Scientific (Waltham, MA). to transfection, siRNAs were premixed with Dharmafect transfection reagent (ThermoFisher Scientific) in serum-free medium and incubated for 20 min. Cells were then transfected by incubation with this siRNA mixture for 24–48 h and treated with or without 1% hypoxia for 24 h.
ARNT lentivirus construction and overexpression
We used a human ARNT ORF cDNA clone (Aryl Hydrocarbon Receptor Nuclear Translocator, transcript variant 1, mRNA) in the pReceiver-Lv105 vector (Genecopoeia, catalog #EX-C0312-Lv105) for lentiviral overexpression. Mutated ARNT constructs were generated in the pReceiver-Lv105 vector using the QuickChange Site-Directed Mutagenesis Kit (Agilent), with primers designed to introduce a single S77D mutation. Lentiviral vectors for expression of ARNT, mutant ARNT, or a scramble control were packaged and titrated by the Northwestern Genomic Editing and Screening Core (GET iN Core), as previously described64.
Western blot analysis
Cell pellets were collected and resuspended in RIPA buffer (50 mM Tris-HCl pH 7.4, 150 mM NaCl, 1% NP-40, 0.5% sodium deoxycholate, 0.1% sodium dodecyl sulfate (SDS) containing protease inhibitor (cOmplete Protease Inhibitor—EDTA Cocktail, Roche). A total of 30 μg of protein lysate per sample was separated by electrophoresis using 12% Mini-PROTEAN® TGX™ Precast Protein Gels (Bio-Rad) and transferred to membranes using the Trans-Blot Turbo System (Bio-Rad). Membranes were blocked for 1 h at room temperature with 5% nonfat milk in TBST, followed by incubation with primary antibodies overnight at 4 °C with gentle shaking. The primary antibodies used were: IL-6 (#P620, Invitrogen, 1:2000), VE-Cadherin (#sc-9989, Santa Cruz, 1:500), ARNT (#5537, Cell Signaling, 1:500), GAPDH (#5174, Cell Signaling, 1:5000), HIF-1α (#NB100-479, Novus, 1:500), and HIF-2α (#NB100-122, Novus, 1:500). Secondary antibodies included HRP-conjugated anti-rabbit IgG (#31460, Invitrogen, 1:10000) and anti-mouse IgG (#62-6520, Invitrogen, 1:10000). The chemiluminescent signal was developed using Clarity Max ECL Western Blotting Substrates (Thermo Fisher Scientific) and imaged with the ChemiDoc XRS (Bio-Rad). Quantification of bands was performed using ImageJ. Uncropped images of WB are shown in Supplementary Fig. 15.
Quantitative real-time PCR (qRT-PCR)
Total RNA was isolated from cultured cell lines using TRIzol™ Reagent (Invitrogen) according to the manufacturer’s protocol. Five hundred nanograms of total RNA were reverse transcribed into cDNA using iScript Reverse Transcription Supermix (Bio-Rad) according to the manufacturer’s protocol. cDNA was diluted 5-fold and qRT-PCR was performed using iTaq Universal SYBR Green Supermix (Bio-Rad) in CFX Connect Real-time System (Bio-Rad). qPCR results were normalized to the expression of the endogenous control 18S. Primer sequences used in qRT-PCR analysis can be found in the indicated supplementary data.
Immunofluorescence staining
Cells were cultured on top of glass slides and transfected with siHif2α and lentivirus containing indicated ARNT overexpressing vector and then treated with 1% hypoxia for 24 h. Cells were washed twice with DPBS and then fixed with 4% paraformaldehyde for 15 min at room temperature. Slides were then washed three times with DPBS for 5 min and permeabilized with 0.25% Triton X-100 in DPBS for 15 min at room temperature. Cells were blocked using 20% goat serum plus 3% BSA for 1 h at room temperature to prevent non-specific binding. Cells were incubated with indicated primary antibodies overnight at 4 °C. Cells were then washed three times with PBST for 5 min each and incubated with secondary antibodies for 1 h in the dark at room temperature. Cells were then washed three times with PBST for 5 min each, and images were taken using ECHO Motorized Fluorescence microscope. A minimum of five different images were obtained for each sample.
In vitro permeability assay
Microscopic glass coverslips were coated with biotin-conjugated gelatin following the manufacturer’s instructions (In Vitro Vascular Permeability Imaging Assay, Sigma-Aldrich, Cat: 17-10398). Human Microvascular Endothelial Cells (HCMVECs) were cultured on the coverslips until they reached 90–98% confluence. The cells were then exposed to hypoxic conditions (1% O2, balanced with 5% CO2 and 95% N2) using an InVivo2400 hypoxia workstation (Ruskinn Technologies) for 4 h, with or without PT2567 treatment. Following this, the cells were incubated under normoxic conditions for an additional 6 h. After incubation, the cells were washed with DPBS and incubated with fluorescein-streptavidin for 5 min before fixation with 4% formaldehyde in DPBS. The coverslips were washed three times with DPBS for 5 min each and permeabilized with 0.025% Triton X-100 in DPBS for 5 min at room temperature. To block non-specific binding, cells were incubated with 10% goat serum plus 3% BSA for 1 h at room temperature. The cells were then incubated with the indicated primary antibodies overnight at 4 °C. The following day, cells were washed three times with PBST for 5 min each and incubated with secondary antibodies for 1 h in the dark at room temperature. After a final wash with PBST three times for 5 min each, images were captured using an ECHO Motorized Fluorescence Microscope. A minimum of five different images were obtained for each sample.
TUNEL staining
HMVEC were cultured on Lab-Tak II chamber slides and fixed with 4% paraformaldehyde. TUNEL immunofluorescent staining was performed using a In Situ Cell death Detection kit, Fluorescein (Roche), according to the manufacturer’s instructions. Images were taken using an ECHO Motorized Fluorescence microscope.
ELISA
Blood samples from controls and Hif2α–/– mice were collected 12 h after MI using the superficial temporal vein phlebotomy technique (ref). Inflammatory cytokines, including IL-6, IL-1β, and TNFα in plasma, were measured using ELISA kits (DY410-05, DY406-05, DY401-05, R&D Systems, MN) according to manufacturer instructions.
Endothelial barrier function by ECIS
Endothelial cell barrier function was analyzed by an electrical cell impedance assay (ECIS). Briefly, arrays (8W10E+ Applied Biophysics, NY, USA) were coated with 1% gelatin (Sigma) for 30 min at 37 °C. Cells were cultured with complete cell medium until cell confluence reached 95–100%. Endothelial barrier disruption was induced by treatment with human alpha-thrombin (0.5 U/well). Endothelial barrier disruption was measured using an electric cell-substrate impedance sensing (ECIS) Zθ device (Applied Biophysics, Troy, NY). Resistance measurements were taken continuously at 3-min intervals.
Tube formation assay
Early passage HUVEC cells were cultured at a density of 1.2 × 10⁵ with complete growth medium in 24 well plates coated with 300 μl of Growth Reduced Matrigel (Corning, NY, United States). After 17 h, the formation of tube-like structures was visualized under a microscope. Images were taken, and the number of meshes, number of extremities, length of branches, and segment length were measured and analyzed by the angiogenesis analyzer for Image J as we published before9,65.
Apoptosis assays
HUVEC cells were transfected with either control siRNA or Hif2α-siRNA in 6 well plates. Cells were then treated with or without 1% oxygen for 24 h. Cells were collected and pelleted for apoptosis assays using the manufacturer’s instructions (Moxi GOII– Early-Stage Apoptosis Monitoring with FITC Annexin V and Propidium Iodide (PI)). Briefly, cell pellets were resuspended with Annexin-V Binding Buffer. 1 × 10⁵ cells of each resuspended sample were further mixed with 3 µl of FITC Annexin-V conjugate. Cells were incubated for 15 min at room temperature after mixing in the dark, followed by the addition of 300 µl of Annexin-V binding buffer. Next, 2 µl/ml of propidium iodide (PI) was added to the cells, followed by 5 more minutes of incubation. Cells were measured for apoptosis in Moxi GO II (Orflo) using the “Apoptosis (Annexin V—FITC&PI)” app.
RNA sequencing
The total RNA was extracted from control and Hif2α–/– heart tissues 28 days post-MI, using RNeasy Fibrous Tissue Mini Kit (74704, Qiagen, MD) according to the manufacturer’s protocol. The RNA integrity was confirmed using a Cytation3 microplate reader (BioTek, VT). The mRNA profiling was conducted using Illumina NovaSeq 6000 sequencer by the University of Chicago Genomics Facility (Chicago, IL). The libraries were prepared using Illumina TruSeq Small RNA Sample Preparation Kit (RS-930-1012, Illumina, CA). Three biological replicates were sequenced for each treatment.
Luciferase reporter assays
Luciferase reporter assays were used to measure IL-6 promoter activity using the Secrete-Pair™ Dual Luminescence Assay Kit (GeneCopoeia) following the manufacturer’s instructions. Briefly, human IL-6 dual-reporter promoter clones were transfected into cells, which expressed both Gaussia Luciferase (GLuc) and Secreted Alkaline Phosphatase (SEAP). After 48 h, the cell culture medium was collected, and luminescence was measured using a SpectraMax ID3 plate reader. The luciferase activities were normalized to the secreted alkaline phosphatase activity of the internal control.
Chromatin immunoprecipitation
Hif2α and ARNT chromatin immunoprecipitation (ChIP) assays were performed using a SimpleChIP® Plus Sonication Chromatin IP Kit (Cell Signaling Technology #56383) according to the manufacturer’s instructions. We verified the quality and length of the digested fragments on 1.5% agarose gels. Hif2α and ARNT protein-DNA complexes were immunoprecipitated using antibodies against Hif2α (No. NB100-122, Novus Biologicals, USA), ARNT (D28F3, Cell Signaling Technology, USA), and normal anti-rabbit IgG (No. #3900, Cell Signaling Technology, USA). The immunoprecipitated protein-DNA complexes were purified by proteinase-K digestion, and purified DNA was then quantified by qRT-PCR using iTaq Universal SYBR Green Supermix (Bio-Rad) in CFX Connect Real-time System (Bio-Rad). Enrichment of the IL-6 promoter was detected with the specific primers 5’- CTGGCAGAAAACAACCTGAACC-3’ (forward) and 5’- AGGCAAGTCTCCTCATTGAATCC-3’ (reverse) and normalized to the total input control.
Statistics and reproducibility
All data are presented as mean ± SEM unless otherwise specified. Statistical analyses were performed using GraphPad Prism software (version 8.3.0, GraphPad, San Diego, CA). For comparisons between the two groups, an unpaired two-tailed Student’s t-test was used. For multiple group comparisons, one-way ANOVA followed by Tukey’s multiple comparison test or two-way ANOVA with Bonferroni post hoc analysis was employed, depending on the number of experimental variables. A p-value of <0.05 was considered statistically significant. For in vivo experiments, sample sizes were determined based on power analyses to achieve sufficient statistical power (80%) while adhering to ethical guidelines on animal use. For each experimental group, at least 5–6 mice were used, unless otherwise stated. Blinding was implemented during data collection and analysis to minimize potential bias. In vitro experiments, including Western blotting, qRT-PCR, and immunofluorescence, were performed with at least three independent biological replicates, each repeated in technical duplicates or triplicates. Reproducibility was ensured by verifying consistent results across all replicates. Effect sizes were estimated for all major comparisons to complement p-values using GraphPad Prism.
Reporting summary
Further information on research design is available in the Nature Portfolio Reporting Summary linked to this article.


 in oxygen homeostasis")
Responses