Arthropod autophagy molecules facilitate Anaplasma phagocytophilum infection of Ixodes scapularis tick cells

Introduction
In the United States, Ixodes scapularis and Ixodes pacificus are the predominant vectors that transmit Anaplasma phagocytophilum, the agent of human granulocytic anaplasmosis, to humans and animals1,2,3. A. phagocytophilum enters the tick vector when these arthropods take a blood meal from an infected reservoir host1,2,3,4. The developmental life stages of these ticks involve eggs, larvae, nymphs, and adults. The larvae take a blood meal and molt into nymphs5,6. If these larvae acquire an infectious blood meal containing A. phagocytophilum, they molt into infected nymphs5,6. A. phagocytophilum is transmitted to humans and animals upon a bite from an infected nymph5,6. After taking a blood meal, nymphs molt into either male or female adult ticks. Adult female ticks take a blood meal, mate with male ticks, and lay eggs. In nature, this cycle continues. However, A. phagocytophilum cannot undergo transovarial transmission in these ticks. Adult ticks could also transmit A. phagocytophilum if uninfected nymphs took an infectious blood meal and molt into adults3.
A. phagocytophilum is an obligate intracellular gram-negative coccoid bacterium that colonizes neutrophils in the vertebrate host and salivary glands in the I. scapularis tick vector7,8,9. When A. phagocytophilum invades a host cell, it forms a host-derived vacuole known as a morulae3,8,10. The bacteria will grow and multiply in the morulae and later will exit from the morula and the host cell to spread to the neighboring host cells3,8,10. A. phagocytophilum can survive in the mammalian host cell by modulating several cellular processes including cytoskeleton remodeling, manipulating the defense response by epigenetic silencing, autophagy, decreasing the NADPH oxidase, and delaying apoptosis3,11,12,13,14,15. In ticks, A. phagocytophilum modulates several cellular processes for its acquisition, replication, survival, and transmission16,17,18,19,20,21,22,23,24,25,26,27,28,29.
Intracellular signaling inside a host cell is initiated and terminated with enzymatic proteins called kinases and phosphatases30. Kinases will induce an activation or deactivation of a protein through phosphorylation, and a phosphatase will do the same function through the dephosphorylation of a protein or a complex30. A. phagocytophilum induces phosphorylation of several host proteins such as ROCK1, PAK, and actin for its survival and infection in mammalian and tick cells21,31. In addition, it has been reported that phosphorylation of A. phagocytophilum protein AnkA by host Abl-1 tyrosine kinase is important for its infection in mammalian cells32. Recently, we reported that A. phagocytophilum induces expression of Src tyrosine kinase and p38 MAPK for its survival in tick cells18,23. Treatment with Src or p38 MAPK dsRNAs or inhibitors affected A. phagocytophilum growth and replication in ticks and tick cells18,23. These studies indicate that kinases and phosphatases are important for A. phagocytophilum survival in both mammalian and tick cells.
A. phagocytophilum activates phosphoinositide 3-kinase (PI3K) for its survival in ticks and tick cells21. Studies have elucidated that SH-2 domain-containing protein SHP-2 acts upstream to PI3K and modulates the PI3K signaling pathway33,34. SHP-2 is a tyrosine phosphatase that localizes near the intracellular surface of the cell35,36. PI3K is involved in the conversion of phosphatidylinositol 4,5-biphosphate (PI4, 5P2, or PIP2) into phosphatidylinositol 3,4,5-triphosphate (PI3, 4, 5P3, or PIP3)33. This conversion leads to the recruitment of phosphoinositide-dependent kinase 1 (PDK1) followed by AKT phosphorylation and activation of the mammalian target of rapamycin (mTOR)33,34,36,37. Autophagy is the process of self-degradation, and this process is balanced through the activity of mTOR37,38. The autophagy mechanism involves multiple steps including initiation, maturation, and termination of the autophagosome formation37,38. Autophagosome is a double-membrane vesicle and several molecules such as ATG13, ULK1, ATG14, ATG101, and Beclin-1 participate in the formation of this vesicle37,38. mTOR complex 1 (mTORC1) is the protein complex that is responsible for the inhibition of autophagosome formation38. mTORC1 regulates the autophagosome activity in a cell by interacting with autophagy-related proteins that are responsible for initiation, maturation, and termination of the autophagosome37,38.
A. phagocytophilum effector protein AnkA recruits SHP-1 phosphatase upon phosphorylation39. This phenomenon is important for A. phagocytophilum infection in mammalian cells39. In addition, a study has reported that A. phagocytophilum effector protein Ats1 interacts with beclin-1 to recruit autophagosome for its growth in mammalian cells15. In mammalian cells, A. phagocytophilum prevents host-derived vacuoles from fusing with lysosome40. Several autophagy-related markers were noted to be localized on the A. phagocytophilum-containing vacuole40. These studies indicate that A. phagocytophilum subverts autophagy for its survival in mammalian cells. While much is known on the role of SHP phosphatases, mTOR, and autophagy pathway upon A. phagocytophilum infection in mammalian cells very little is known from the vector side. In this study, we provide evidence that A. phagocytophilum infection modulates the expression of SHP-2 and mTOR proteins in tick cells. In addition, we noted that inhibition of mTOR or RNAi-mediated-silencing of autophagy genes favors A. phagocytophilum infection in tick cells.
Results
Comparison of Ixodes scapularis SHP-2 tyrosine phosphatase to insect and mammalian orthologs
Ixodes scapularis ticks encode SHP-2 ortholog in their genome. We amplified the shp-2 tyrosine phosphatase transcripts in ticks (GeneBank acc. No. XP_029830587) (Supplementary Fig. 1). QRT-PCR was used to amplify the (164 bp) product from cDNA prepared from total RNA of I. scapularis unfed nymphs (Supplementary Fig. 1). ClustalW alignment of I. scapularis SHP-2 amino acid sequence showed 53% identity with Drosophila melanogaster (GeneBank Acc. No. NP_477131.1) and 66% identity with Aedes aegypti (GeneBank acc. no. XP_021705063.1), Mus musculus (GeneBank Acc. No. NP_035332.1) and Homo sapiens (GeneBank acc. no. XP_054228694.1) SHP-2 orthologs (Supplementary Figs. 2 and 3A, B). The domain analysis of the I. scapularis SHP-2 protein revealed the presence of two SH-2 domains, a PTP-type protein phosphatase domain, and a tyrosine-specific domain (Supplementary Fig. 3C). The active site for I. scapularis SHP-2 tyrosine phosphatase is tyrosine residue 449. The phylogenetic tree analysis revealed that I. scapularis SHP-2 forms a separate clade when compared to the other analyzed insect and mammalian orthologs (Supplementary Fig. 3D). Human and mouse SHP-2 orthologs fall within one clade and Drosophila melanogaster and Aedes aegypti SHP-2 orthologs formed a different clade (Supplementary Fig. 3D). Furthermore, posttranslational modification analysis revealed four N-glycosylation sites, seven N-myristoylation site, eleven Casein kinase II, and eleven protein kinase C sites (Supplementary Fig. 4A). In addition, we noted that SHP-2 orthologs from D. melanogaster, A. aegypti, M. musculus and H. sapiens also contained several of N-glycosylation sites, N-myristoylation site, Casein kinase II, and protein kinase C sites (Supplementary Fig. 4B–E). Collectively, these results reveal that even though tick SHP-2 forms a divergent clade, the functional domains and types of posttranslational modification sites were noted to be similar to the mammalian orthologs.
Expression of shp-2 is variable in different developmental stages of I. scapularis ticks
We first analyzed the expression of shp-2 transcripts in all the different life cycle stages of I. scapularis ticks. QRT-PCR analysis showed that there were significantly (P < 0.05) higher levels of shp-2 transcripts in larvae when compared to nymph and adult male ticks (Fig. 1A). There were also significantly (P < 0.05) higher levels of shp-2 transcripts in adult female ticks when compared to nymph and adult male ticks (Fig. 1A). No significant differences were observed in the shp-2 transcript levels between larvae and female ticks or between nymphs and male ticks (Fig. 1A). The significant increase in shp-2 expression suggests an important role for this molecule in larvae and adult female life stages of this vector.

A QRT-PCR analysis showing the expression of I. scapularis shp-2 transcripts at different developmental stages (larvae, nymphs, female, and male) of ticks. Each dot for larvae samples corresponds to data from a pool of about ten ticks, and each dot for nymphs and adults represents data from one tick. The shp-2 transcript levels were normalized to 5.8S ribosomal RNA levels. QRT-PCR analysis showing shp-2 transcripts at day 1 (B) or at day 3 (C) post-infection (p.i.) in uninfected or A. phagocytophilum-infected tick cells. Each dot represents data from samples collected from one culture well. The mRNA levels of shp-2 were normalized to tick beta-actin mRNA. D QRT-PCR analysis showing shp-2 transcript levels in unfed (D), 48 h during feeding (E), and 48 h post-feeding (repleted) uninfected (UI) or A. phagocytophilum-infected (ApI) ticks. For B–F, open circles represent data from uninfected (UI), and closed circles represent data from A. phagocytophilum-infected (ApI) tick cells (B, C) or ticks (D–F). In E, F shp-2 transcript levels were normalized to 5.8S rRNA levels. P values for panel (A) from one-way ANOVA and (B–F) from non-paired t-test are shown. ns indicates not significant. G Immunoblotting analysis of SHP-2 protein amounts in uninfected (UI) or A. phagocytophilum-infected unfed nymphs is shown. The Ponceau-S-stained image serves as a loading control image. The asterisk indicates the band considered for normalization in densitometric analysis. The arrow indicates tick SHP-2 protein with a size of around 90 kDa. M indicates a marker in kDa. The marker sizes are shown on the left side of the Ponceau-S-stained image.
A. phagocytophilum upregulates the expression of shp-2 in unfed nymphs and in ISE6 tick cells
The role of SHP-2 in I. scapularis-A. phagocytophilum has not been studied. We first analyzed the expression of SHP-2 RNA and protein levels upon A. phagocytophilum infection in the tick vector. QRT-PCR results showed a significant (P < 0.05) increase in shp-2 transcript levels in A. phagocytophilum-infected tick cells at tested time points of days 1 and 3 post-infection (p.i.) compared to the levels noted in uninfected control (Fig. 1B, C). In addition, we noted a significant (P < 0.05) increase in shp-2 transcript levels in A. phagocytophilum-infected unfed nymphs when compared to the levels noted in uninfected controls (Fig. 1D). However, we did not observe any significant differences in the expression of shp-2 transcripts in A. phagocytophilum-infected ticks either during feeding (Fig. 1E) or after feeding (Fig. 1F) when compared to the levels noted in the respective uninfected control groups (Fig. 1E, F). In addition, we did not observe any significant difference in the shp-2 transcript levels during transmission of A. phagocytophilum from infected ticks to the naïve murine host when compared to the levels noted in uninfected ticks (Supplementary Fig. 5A). Immunoblotting performed with commercially available antibody against a vertebrate SHP-2 showed increased levels of arthropod SHP-2 in A. phagocytophilum-infected unfed nymphal ticks when compared to the levels noted in uninfected control (Fig. 1G and Supplementary Fig. 5B). The Ponceau-S-stained image served as a loading control image for the protein amounts that were used in the immunoblot analysis (Fig. 1G). Collectively, these results show that A. phagocytophilum upregulates SHP-2 in unfed nymphs and in tick cells.
RNAi-mediated silencing and functional inhibition of arthropod SHP-2 increases A. phagocytophilum burden in tick cells
The upregulation of SHP-2 in ticks and tick cells suggests an important role for this molecule in A. phagocytophilum-tick interactions. To further evaluate the role of SHP-2, we performed RNAi-mediated silencing analysis in tick cells. We amplified the shp-2 fragment (329 bp) and cloned it into the pL4440 vector to generate shp-2-dsRNA. Similarly, multiple cloning site region in the pL4440 vector was considered for the generation of mock-dsRNA. Tick cells were treated with shp-2 or mock-dsRNA followed by A. phagocytophilum infection. QRT-PCR analysis revealed significant (P < 0.05) lower levels of shp-2 transcripts in shp-2-dsRNA-treated A. phagocytophilum-infected tick cells compared to the levels noted in mock-treated control at 24 h p.i., (Fig. 2A). Interestingly, we noted a significant (P < 0.05) increase in A. phagocytophilum burden in shp-2-dsRNA-treated tick cells when compared to the bacterial burden noted in mock-dsRNA-treated control (Fig. 2B). Furthermore, we performed in vitro studies with a PTP type 11 SHP-2 inhibitor. Tick cells were treated with a 25 µM (final concentration) dose of the SHP-2 inhibitor and an equivalent amount of DMSO as mock control. We did not observe any morphological differences between tick cells treated with mock or SHP-2 inhibitor following A. phagocytophilum-infection (Supplementary Fig. 6A, B). QRT-PCR analysis revealed no significant differences in the shp-2 transcripts upon treatment of A. phagocytophilum-infected tick cells with SHP-2 inhibitor in comparison to the levels noted in mock controls at 24 h p.i. (Fig. 2C). However, we noted a significant (P < 0.05) increase in A. phagocytophilum burden in SHP-2 inhibitor-treated tick cells when compared to the bacterial burden noted in mock-treated controls (Fig. 2D). These results indicate that genetic knockdown of shp-2 expression or functional inhibition of SHP-2 protein facilitates A. phagocytophilum infection in tick cells.
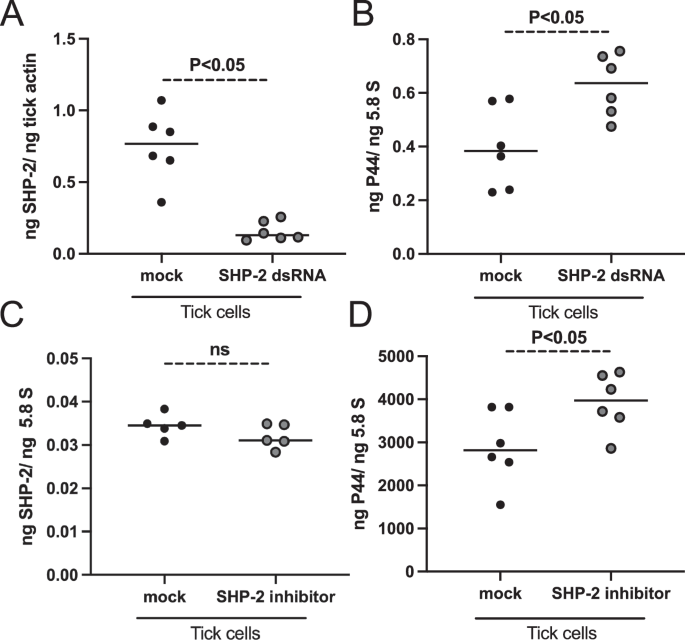
A QRT-PCR analysis showing shp-2 transcript levels (A, C) or bacterial burden (B, D) at 24 h p.i. in mock-dsRNA-treated (A, B) or shp-2-dsRNA-treated (A, B) or mock solution (DMSO)-treated (C, D) or SHP-2-inhibitor-treated (C, D) A. phagocytophilum-infected tick cells. Black circles represent data from mock-dsRNA-treated or mock-solution-treated, and the gray circles represent data from shp-2-dsRNA-treated or SHP-2 inhibitor-treated A. phagocytophilum-infected tick cells. In all panels, each circle represents data for samples collected from one individual cell culture plate well. The shp-2 mRNA levels and p44 DNA levels were normalized to 5.8S rRNA levels. The P value from the non-paired t-test is shown. ns indicates not significant.
Comparison of I. scapularis mammalian target of rapamycin (mTOR) to insect and mammalian orthologs
The upregulation of SHP-2 phosphatase in A. phagocytophilum-infected tick cells prompted us to delineate the downstream singling in this cascade. SHP-2 is reported to activate the mTOR pathway in the mammalian cells33. We, therefore combed the genome of I. scapularis and identified a mammalian ortholog of mTOR (GeneBank Acc. No. XP_042146895). The mTOR is a kinase that was initially identified in mammals37,38. The role of mTOR in I. scapularis has not been studied. QRT-PCR was used to amplify the mTOR transcript product (252 bp) from cDNA prepared from total RNA of I. scapularis unfed nymphs (Supplementary Fig. 7). ClustalW alignment of I. scapularis mTOR amino acid sequence showed a 56% identity with D. melanogaster mTOR (GeneBank Acc. No. NP_001260427), 58% identity with A. aegypti mTOR (GeneBank acc. no. AAR97336.1), 64% identity with M. musculus mTOR (GeneBank Acc. No. NP_064393.2) and 64% identify with H. sapiens mTOR (GeneBank Acc. No. NP_001373429.1) (Supplementary Figs. 8A, B and 9A, B). Domain analysis of I. scapularis SHP-2 revealed the presence of a FAT domain, a PI3K/PI4K catalytic domain, and a FATC domain (Supplementary Fig. 9C). A phylogenetic tree analysis of mTOR revealed that I. scapularis mTOR formed a separate clade from other analyzed SHP-2 orthologs. (Supplementary Fig. 9D). The human and mouse mTORs form one clade and mTORs from D. melanogaster and A. aegypti form a different clade. Posttranslational modification analysis of I. scapularis mTOR revealed two amidation sites, five cAMP phosphorylation sites, seven N-glycosylation sites, 28 N-myristoylation sites, 32 Casein kinase II sites, and 30 protein kinase C sites (Supplementary Fig. 10A). In addition, we noted that mTOR orthologs from D. melanogaster, A. aegypti, M. musculus and H. sapiens also contained several of N-glycosylation, N-myristoylation, amidation, cAMP phosphorylation, Casein kinase II, and protein kinase C sites (Supplementary Fig. 10B–E). Overall, a high degree of percent identity in amino acid sequence and conservation of domains and types of posttranslational modification sites in I. scapularis mTOR suggests a similar role for tick molecule in various signaling pathways like its mammalian counterpart.
Expression of mTOR in different developmental stages of I. scapularis
We then analyzed whether mTOR is expressed in all developmental stages of I. scapularis ticks. QRT-PCR analysis revealed significantly (P < 0.05) higher levels of mTOR transcripts in larvae when compared to nymph and adult male ticks (Fig. 3A). No significant difference in mTOR transcripts was evident between nymphal and adult ticks. These data show that mTOR transcripts are highly expressed in larvae when compared to other developmental stages of ticks.
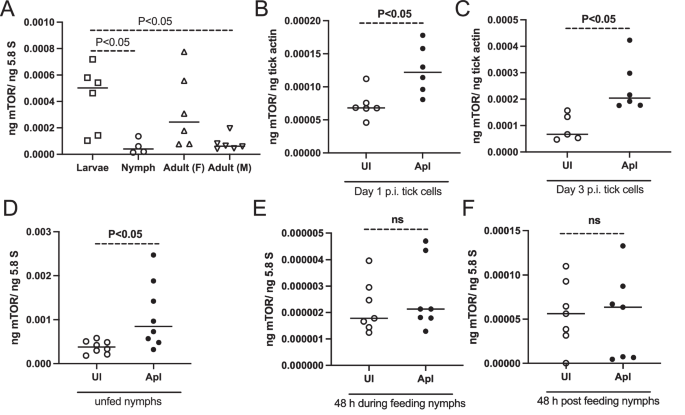
A QRT-PCR analysis showing levels of I. scapularis mTOR transcripts at different developmental stages (larvae, nymphs, female, and male) of ticks. For larvae samples, each dot corresponds to data from a pool of about ten ticks. For nymphs and adult samples, each dot represents data from one tick. The mTOR transcript levels were normalized to 5.8S rRNA levels. QRT-PCR analysis showing mTOR transcripts at days 1 (B) or day 3 (C) post-infection (p.i.) in uninfected or A. phagocytophilum-infected tick cells. Each dot represents data from samples collected from one culture well. The mRNA levels of mTOR were normalized to tick beta-actin mRNA levels. D QRT-PCR analysis showing expression of mTOR transcripts in unfed (D), 48 h during feeding (E), and 48 h post-feeding (repleted) uninfected (UI) or A. phagocytophilum-infected (ApI) ticks. B–F Open circles represent data from uninfected (UI) and closed circles represent data from A. phagocytophilum-infected (ApI) tick cells (B, C) or ticks (D–F). In E, F mTOR transcript levels were normalized to 5.8S rRNA levels. P values for panel A from one-way ANOVA and panels B-F from non-paired t-test are shown. ns indicates not significant.
A. phagocytophilum upregulates the expression of mTOR in unfed nymphs and in tick cells
As SHP-2 activates mTOR, we reasoned whether A. phagocytophilum infection has any impact on mTOR expression. QRT-PCR analysis revealed significant upregulation of mTOR transcripts in A. phagocytophilum-infected tick cells at both tested time points of 1 and 3 p.i. when compared to the levels noted in uninfected tick cells (Fig. 3B, C). In addition, we noted that mTOR transcripts were significantly upregulated in A. phagocytophilum-infected unfed nymphal ticks compared to the levels noted in uninfected unfed controls (Fig. 3D). However, we did not observe any significant differences (P > 0.05) in the mTOR transcripts in A. phagocytophilum-infected ticks during feeding (Fig. 3E) or after feeding (Fig. 3F) when compared to the levels noted in respective fed uninfected ticks (Fig. 3E, F).
Functional inhibition of mTOR increases A. phagocytophilum loads in tick cells
Furthermore, in vitro studies were performed with rapamycin, an inhibitor of mTOR. No morphological differences were noted between tick cells treated with mock or rapamycin following A. phagocytophilum-infection (Supplementary Fig. 11A, B). QRT-PCR analysis revealed significantly (P < 0.05) reduced levels of mTOR transcripts in rapamycin-treated A. phagocytophilum-infected tick cells when compared to the levels noted in mock-treated controls (Fig. 4A). In addition, QRT-PCR analysis revealed significantly (P < 0.05) increased A. phagocytophilum burden in rapamycin-treated tick cells when compared to the bacterial burden noted in mock-treated control (Fig. 4B). We then performed immunoblotting analysis to determine levels of activated mTOR (phospho-mTOR). Immunoblotting analysis showed a decrease in the phospho-mTOR levels in rapamycin-treated A. phagocytophilum-infected tick cells when compared to the levels noted in mock-treated control (Fig. 4C and Supplementary Fig. 12A). In addition, we also noted a reduced phospho-mTOR levels in shp-2-dsRNA-treated (Fig. 4D and Supplementary Fig. 12B) and SHP-2 inhibitor-treated (Fig. 4E and Supplementary Fig. 12C) A. phagocytophilum-infected tick cells compared to the levels noted in respective mock-treated controls (Fig. 4D, E). Collectively, these results not only demonstrate that SHP-2 acts upstream of mTOR and is important in the activation of the water molecule but also show that functional inhibition of mTOR increases A. phagocytophilum burden in tick cells.
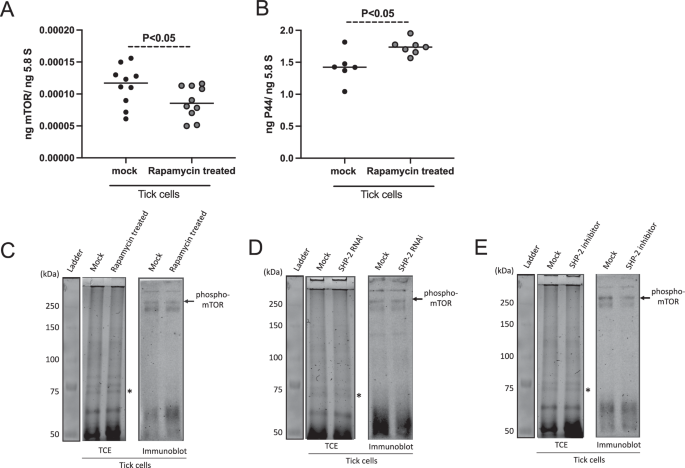
QRT-PCR analysis showing mTOR transcripts (A) and bacterial burden (B) in mock (DMSO) or rapamycin-treated A. phagocytophilum-infected tick cells. Each dot represents data from one independent culture plate well. The mRNA levels of mTOR and p44 DNA levels were normalized to 5.8S rRNA levels. P value from the non-paired Student’s t-test is shown. Immunoblot analysis showing phospho-mTOR levels in mock- or rapamycin-treated (C) or mock-dsRNA- or shp-2-dsRNA-treated (D) or mock- or SHP-inhibitor-treated (E) A. phagocytophilum-infected tick cells. For C, D, and E, the phospho-mTOR protein is shown with the black arrow at approximately 289 kDa position. All tick cell samples were infected with A. phagocytophilum and were collected at 24 h post-infection. TCE gel image serves as a loading control image. The asterisk indicates the band considered for normalization in densitometric analysis. Protein sizes in kDa are shown on the left side of the TCE gel image.
A. phagocytophilum upregulates the expression of several autophagy markers in unfed nymphs and ISE6 tick cells
It has been reported that mTOR inhibits autophagy induction, nucleation at the endoplasmic reticulum, autophagosome elongation, and autophagosome maturation38. We, therefore, reasoned to analyze the expression of autophagy markers in tick and tick cells upon A. phagocytophilum infection. QRT-PCR analysis revealed that autophagy markers that are responsible for autophagosome formation and maturation including Atg13, ULK1, Atg14, beclin-1, and p300 were all significantly (P < 0.05) upregulated in A. phagocytophilum-infected unfed nymphal ticks compared to the levels noted in uninfected controls (Fig. 5A–E). In tick cells, atg13 expression did not show any significant differences at both tested time points of day 1 and day 3 p.i. (Fig. 6A, F). The ulk1 expression was significantly (P < 0.05) upregulated in A. phagocytophilum-infected tick cells compared to the expression noted in uninfected control at day 1 and 3 p.i. (Fig. 6B, G). At day 1 p.i., the expression of atg14 was not affected (Fig. 6C) but at day 3 p.i. the expression of this gene was significantly upregulated in A. phagocytophilum-infected tick cells compared to the expression noted in uninfected control (Fig. 6H). The expression of beclin-1 and p300 was unaltered in A. phagocytophilum-infected tick cells compared to the expression noted in uninfected controls at both day 1 (Fig. 6D, E) and day 3 post-infection time points (Fig. 6I, J).
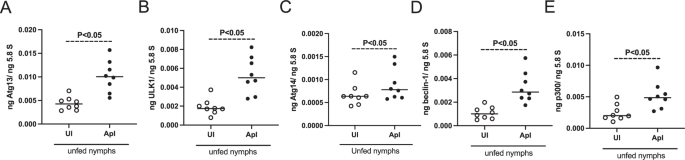
QRT-PCR analysis showing transcript levels of atg13 (A), ulk1 (B), atg14 (C), beclin-1 (D), and p300 (E) in uninfected (UI) and A. phagocytophilum-infected (ApI) unfed nymphal ticks. In all panels, open circles represent data from uninfected unfed nymphal ticks and the closed circles represent data from A. phagocytophilum-infected unfed nymphal ticks. The transcript levels of autophagy molecules were normalized to 5.8S rRNA levels. P value from the non-paired t-test is shown.
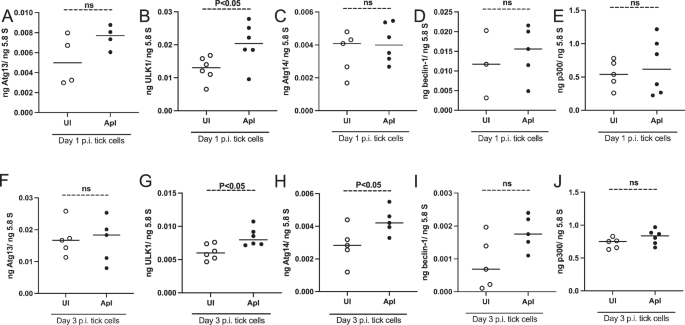
QRT-PCR analysis showing transcript levels of atg13 (A), ulk1 (B), atg14 (C), beclin-1 (D), and p300 (E) in uninfected (UI) and A. phagocytophilum-infected (ApI) tick cells at days 1 (A–E) or day 3 (F–J) p.i. In all panels, open circles represent data from uninfected tick cells and the closed circles represent data from A. phagocytophilum-infected tick cells. The transcript levels of autophagy molecules were normalized to 5.8S rRNA levels. P value from the non-paired t-test is shown. ns indicates not significant.
Rapamycin treatment has no effects on the expression of several autophagy markers in tick cells
We then tested whether rapamycin treatment affects the expression of autophagy markers. QRT-PCR analysis revealed that expression of atg13 (Fig. 7A), ulk1 (Fig. 7B), atg14 (Fig. 7C), and beclin-1 (Fig. 7D) was unaltered in A. phagocytophilum-infected ticks cells treated with rapamycin compared to the expression levels noted in cells treated with mock control (Fig. 7A–D). A similar observation was noted in uninfected tick cells (Fig. 7E–H). These results suggest that blocking mTOR function with rapamycin treatment has no effects on the transcript levels of atg13, ulk1, atg14, and beclin-1.
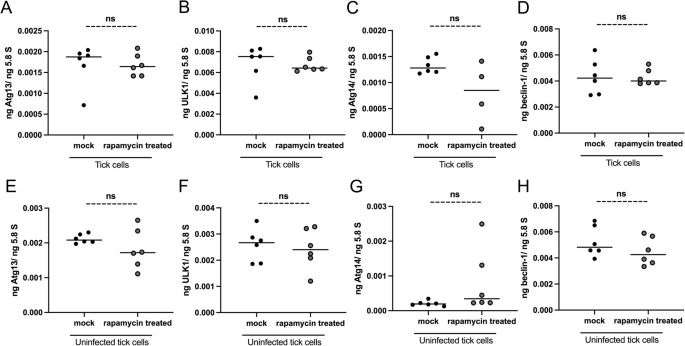
QRT-PCR analysis showing transcript levels of atg13 (A, E), ulk1 (B, F), atg14 (C, G), and beclin-1 (D, H) in mock- or rapamycin-treated A. phagocytophilum-infected (A–D) or uninfected (E–H) tick cells. Each dot represents data from the sample collected from one culture plate well. Black circles represent data from mock (DMSO)-treated, and gray circles represent data from rapamycin-treated A. phagocytophilum-infected (A–D) or uninfected (E–H) tick cells. The transcript levels of autophagy molecules were normalized to 5.8S rRNA levels. P value from the non-paired t-test is shown. ns indicates not significant.
RNAi-mediated silencing of atg14 or ulk1 expression affects A. phagocytophilum loads in tick cells
Upregulation of atg14 and ulk1 expression in ticks and tick cells upon A. phagocytophilum infection prompted us to test whether RNAi-mediated silencing of the expression of these genes has any impact on bacterial growth. Tick cells were treated with atg14– or ulk1– or mock-dsRNA followed by A. phagocytophilum infection. QRT-PCR analysis revealed that atg14 transcripts were significantly (P < 0.05) less in atg14-dsRNA-treated A. phagocytophilum-infected tick cells compared to the levels noted in the mock-treated control group (Fig. 8A). In addition, we noted significantly (P < 0.05) decreased levels of bacterial burden in atg14-dsRNA-treated A. phagocytophilum-infected tick cells compared to the burden noted in mock-treated control (Fig. 8B). Similarly, ulk1 transcripts (Fig. 8C) and bacterial burden (Fig. 8D) were significantly (P < 0.05) reduced in ulk1-dsRNA-treated A. phagocytophilum-infected tick cells compared to the levels noted in mock-treated control. Collectively, these results not only indicate the upregulation of autophagy genes upon A. phagocytophilum infection in tick cells is independent of SHP-2-mTOR signaling but also shows that ATG14 and ULK1 are important for bacterial survival in these cells.
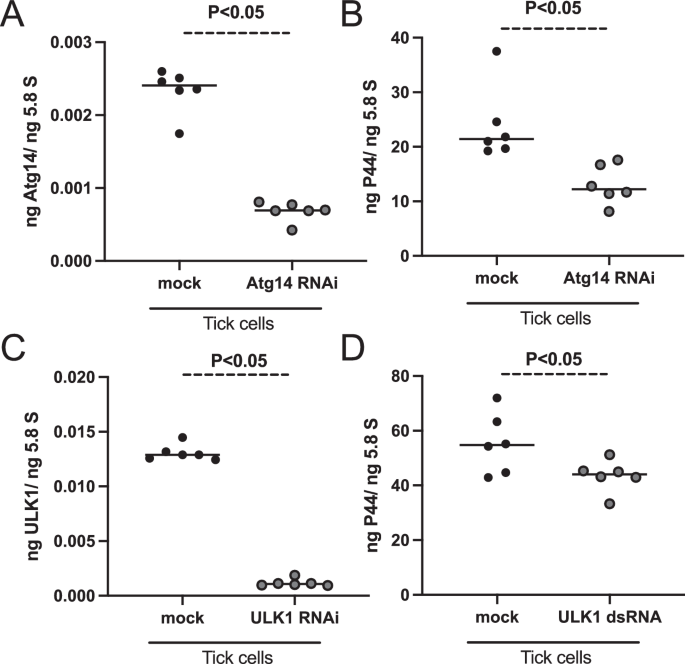
A QRT-PCR analysis showing the silencing efficiency of atg14 expression (A) or bacterial burden (B) after 24-h post A. phagocytophilum infection in mock- or atg14-dsRNA-treated tick cells. C QRT-PCR analysis showing the silencing efficiency of ulk1 expression (C) or bacterial burden (D) after 24-h post A. phagocytophilum infection in mock- or ulk1-dsRNA-treated tick cells. In all panels, closed black circles represent data from mock-dsRNA-treated, and gray circles represent atg14– (A, B) or ulk1-dsRNA-treated (C, D) A. phagocytophilum-infected tick cells. Each dot represents data from a sample collected from one independent culture plate well. The transcript levels of atg14, ulk1, and p44 DNA levels were normalized to 5.8S rRNA levels. P value from the non-paired t-test is shown.
Discussion
The eukaryotic kinases and phosphatases are key molecules in mediating host-pathogen interactions41. In addition, bacterial pathogens deliver their kinases and phosphatases to alter host signaling42. These bacterial enzymes facilitate adhesion, virulence, replication, and survival in the host cells41,42. A. phagocytophilum also modulates kinases and phosphatases for its survival in mammalian and tick cells21,23,31,39. In this study, we provide new evidence that A. phagocytophilum infection of tick cells modulates SHP-2 phosphatase and its downstream molecule mTOR signaling for its survival. In addition, our study indicates that autophagy molecules such as ATG14 and ULK1 are important for A. phagocytophilum infection of tick cells.
Bioinformatic analysis revealed a high degree of amino acid sequence conservation of tick SHP-2 and mTOR with their mammalian counterparts. We noted more than 65% identity in the amino acid sequence of tick proteins with their mammalian orthologs. The presence of functional domains such as two SH-2 domains in SHP-2 and PI3K/PIK4 catalytic domain in tick mTOR suggests a high degree of conservation in their functions like their mammalian counterparts. Based on the amino acid length (GeneBank acc. no. XP_029830587.1), the tick SHP-2 protein molecular mass should be around 85 kDa. However, we noted an intense band around 90 kDa size. The increase in the band size could be due to potential phosphorylation on the tick SHP-2 protein. SHP-2 and mTOR are key players in growth, metabolism, and diseases36,37. The observation of increased SHP-2 and mTOR transcripts in larval stages of ticks and in female ticks indicates their role in arthropod growth and development.
The up-regulation of SHP-2 upon A. phagocytophilum infection could be a host response to limit the infection. The observation of increased bacterial burden in shp-2-dsRNA-treated or SHP-2 inhibitor-treated-A. phagocytophilum tick cells when compared to the burden noted in mock-treated controls support this notion. Even though SHP-2 localizes near the intracellular surface of the cell35,36, this molecule can be recruited to the plasma membrane by binding to tyrosine phosphorylated proteins36. The two SH2 domains on SHP-2 are used to interact with the tyrosine residue at the protein’s active site (449Y) to make it inactive35. We believe arthropod SHP-2 could perform a similar role(s) in tick cells. SHP-2 interacts with receptor tyrosine kinases (RTK) and can inhibit signal transduction through phosphorylation of the tyrosine residue on the RTK35. When SHP-2 is inhibited, the activity of RTKs is increased. RTKs will then activate MAPK signaling43. We have previously reported that A. phagocytophilum requires p38-MAPK for its infection in tick cells18. We believe that upon knockdown of shp-2 gene expression or functional inhibition of SHP-2, the RTKs activate MAPK signaling, including p38 MAPK, that could eventually contribute to increased A. phagocytophilum burden in tick cells.
SHP-2 is an upstream molecular player in mTOR signaling33,36. The data from immunoblotting analysis with knockdown of shp-2 gene expression or functional inhibition of SHP-2 that affect mTOR activation support similar order of these molecules in the signaling cascade in ticks. We also believe that just like SHP-2 expression, the upregulation of mTOR transcripts upon A. phagocytophilum infection could also be a host response. The observation of increased bacterial loads in mTOR-dsRNA-treated or rapamycin-treated-A. phagocytophilum tick cells compared to the loads noted in mock-treated controls support this idea. In addition to its role in the inhibition of autophagy, cell survival, cell proliferation, and differentiation, mTOR also regulates immune responses, including anti-bacterial responses, in mammalian cells and lower vertebrates36,38,44,45. Therefore, we believe that upon A. phagocytophilum infection, SHP-2 induces mTOR activation in ticks. The increased activation of mTOR could induce tick innate immune responses, including anti-bacterial responses, that could limit A. phagocytophilum burden in tick cells.
Rapamycin is a chemical compound that interacts with mTOR37,38. This is accomplished through its binding with peptidyl-propyl-isomerase FKBP12 and then directly binding to mTOR, leading to its inhibition37,38. The effect of rapamycin on tick cells shows a similar phenomenon of this compound in mammalian cells. The inhibition of mTOR leads to a decrease in cellular growth and an increase in autophagy activity. Certain proteins such as ATG13, ULK1, ATG14, beclin-1, and p300 are responsible for the initiation, nucleation, and elongation of the autophagosome38. mTOR regulation impacts autophagosome growth through its interactions with certain autophagy-related proteins38. The observation of unaltered levels of all tested autophagy gene transcripts upon treatment of tick cells with rapamycin suggests that regulation of autophagy genes upon A. phagocytophilum is independent of the mTOR signaling. Previous reports indicated that A. phagocytophilum requires several autophagy molecules for the formation of its host-derived vacuole40. The bacteria divide in these vacuoles3. In addition, treatment of mammalian cells with rapamycin increased the bacterial loads40. Based on the observation of rapamycin treatment in increasing bacterial loads in tick cells, we believe that A. phagocytophilum also subverts autophagy in tick cells for its survival. The observation of reduced A. phagocytophilum loads upon ATG14 or ULK1 silencing in tick cells supports this view.
In summary, our study not only provides evidence that upon A. phagocytophilum infection, I. scapularis SHP-2 and mTOR are upregulated possibly to limit the bacterial infection but also indicate that this bacterium modulates autophagy genes such as ATG14 and ULK1 for its survival in this medically important vector.
Methods
Ticks, tick cells, and bacteria
The Ixodes scapularis ticks used throughout the study were reared in a laboratory setting17,18. The ticks that were used in this study were larvae, nymphs, adult females, and adult male ticks. These ticks were obtained from BEI Resources/Center for Disease Control (CDC) or from the Oklahoma University Tick Rearing Center. A. phagocytophilum-infected nymphs were generated by feeding larvae on infected mice as described in our previous studies17,18,23. The I. scapularis tick cell line ISE6 was purchased from BEI Resources/ATCC (American Type Culture Collection) and maintained as described in our previous studies17,18,22,23. A. phagocytophilum isolate NCH-1 (obtained from BEI resources, USA) was used in all studies. Laboratory tick rearing was performed in an incubator set at 23 ± 2 °C with 95% humidity and a 14/10-h light/dark photoperiod regiment.
Mice studies
Tick feeding on mice was performed as in our previous studies17,18,20,22. Briefly, to generate uninfected, during feeding and post-fed ticks, unfed nymphal ticks were fed on uninfected or A. phagocytophilum-infected C57BL/6 J mice (4–6 weeks old female mice, Jackson Laboratories, USA). A. phagocytophilum infection was maintained in B6.129S7-Rag1tm1Mom/J (RAG−/−) mice (4–6 weeks old female mice, Jackson Laboratories, USA). When mice are not used for tick feeding, they are housed in a group. For tick-feeding studies, mice are housed in a single cage. To generate unfed nymphs, larval ticks were fed on either uninfected or A. phagocytophilum-infected mice. Fully engorged repleted larval ticks were molted into unfed nymphs. For acquisition studies, A. phagocytophilum dense core (DC) form was isolated from 30 ml of day six infected HL-60 cells (~3.0 × 10⁶ cells/10 ml) as described46. The pelleted bacteria were re-suspended in 1 ml of 1× PBS. One hundred microliters of this solution were injected per mouse (5 mice/group). Around 20–25 unfed nymphs were fed on each mouse. At 48 h post tick placement, intact ticks that were feeding (during feeding) were pulled off from the mice and were called 48 h during feeding nymphs. Post-feeding (PF) ticks that were repleted and were collected from 72 h to 96 h post tick placement onto the mice were called 48 h post-fed nymphs. Ticks fed on uninfected mice were used as controls. A. phagocytophilum infection in ticks was analyzed by Quantitative real-time PCR (QRT-PCR) as described in the relevant methods section. Unfed or during feeding or post-fed uninfected or A. phagocytophilum-infected nymphal ticks were processed for DNA, RNA, or protein extractions and were used for QRT-PCR analysis or immunoblotting analysis.
Ethical statement
All animal work was carried out in accordance with the regulations of the University of Tennessee, Knoxville, Institutional Care and Use of Laboratory Animals (IACUC, animal assurance number D16-00397). The IACUC approved protocol (permit # 2801–0221) was used in this study. We have complied with all relevant ethical regulations for animal use. To minimize anxiety and/or discomfort during tick feeding, mice were administered with acepromazine tranquilizer, and all efforts were made to minimize mice suffering.
DNA and RNA extractions, cDNA synthesis, and quantitative real-time PCR (QRT-PCR) analysis
Aurum total RNA mini kit (BioRad, USA) was used to isolate the DNA and RNA from the different tick developmental stages, unfed/fed ticks, and uninfected/A. phagocytophilum-infected ticks and tick cells, and dsRNA/inhibitor-treated tick cell samples. Total RNA isolated from samples (after DNase I treatment) was converted into cDNA using an iScript cDNA synthesis kit (BioRAD, USA), and the cDNA generated from this kit was used as a template for quantifying transcripts of shp-2, mTOR, and autophagy markers. Supplementary Table 1 shows the forward and reverse oligonucleotides used in this study. QRT-PCR was performed using CFX96 Opus QPCR machine (BioRAD, USA) and iQ-SYBR Green Supermix (BioRAD, USA) and Maxima SYBR/R (FisherThermoScientific, USA) as described17,18,22. To quantify the A. phagocytophilum bacterial burden, genomic DNA was generated from ticks and tick cell samples using a DNeasy DNA isolation kit (QIAGEN) and was processed with specific primers for PCR quantification of the A. phagocytophilum p44 gene as reported in our previous studies with oligos shown in Supplementary Table 117,18,22. The standard curves for the QRT-PCRs were made through a serial dilution of gene-specific fragments starting from 1 ng to 0.00001 ng quantities. DNA quantities were measured using a Cytation 7 reader (BioTek, USA).
Immunoblotting analysis
Immunoblotting was performed as described and with the method described in this section17,18,23. Briefly, total lysates from unfed or fed ticks or ISE6 tick cells were prepared in modified RIPA lysis buffer (BioExpress/VWR, USA) supplemented with an EDTA-free protease inhibitor cocktail (Sigma, USA). Tick and tick cell protein concentrations were measured using a Bradford (BCA) protein assay kit (Pierce/ThermoScientific, USA). Primary (SHP2 antibody-product number 3752S, phospho-mTOR antibody-product number 2971S) and secondary antibodies (product number 7074S) were purchased from Cell Signaling Technologies (USA). Twenty-five micrograms of total lysates were generated from uninfected/A. phagocytophilum-infected tick samples were loaded onto a 12% reducing SDS-PAGE gel for immunoblotting analysis. Primary antibodies were used in 1:1000 dilution and secondary antibody was used in 1:5000 dilution for 5 ml solutions. Untreated/treated tick cell samples (20 or 25 µg) were loaded onto an 8% reducing SDS-PAGE gel for immunoblotting analysis. Ponceau-S stained membrane or TCE gel images were used to indicate loading controls for the immunoblots. Blots were imaged using the ChemiDoc Imaging system (BioRAD, USA) and processed using Image Lab software (BioRAD, USA).
dsRNA synthesis and transfections
The dsRNA synthesis was performed as described22,23,28. The template for dsRNA synthesis was selected from the coding sequence (CDS) and the fragment was generated from cDNA. The shp-2 gene fragment (329 bp) was PCR amplified using gene-specific primers containing BglII (forward primer) and KpnI (reverse primer) restriction enzyme sites (forward 5’ CCAGATCTGAGGGAGAGCCGCAGCA 3’ and the reverse 5’ CGGGTACCCCTGTTGCTGCAGGTGCTCA 3’). The Escherichia coli JM109 cells were used for generating the shp2-dsRNA clone in the pL4440 plasmid19,47. The pL4440 vector has two T7 promoters on either end of multiple cloning sites close to the BglII and KpnI sites. The shp2-fragment cloned vector was digested with BglII or KpnI separately and processed for in vitro transcription. The ulk1 gene fragment (414 bp) was PCR amplified using gene-specific primers with T7 promoter (forward 5’ GCTAATACGACTCACTATAGGGAGAGCCAAGGGCATAGTGCACA 3’ and reverse 5’ GCTAATACGACTCACTATAGGGAGAGTCCATCCTCTCTCTTGCATTCT 3’). The atg14 gene fragment (503 bp) was PCR amplified using gene-specific primers with T7 promoters (forward 5’ GCTAATACGACTCACTATAGGGAGAGCGACTTCACCAGCTCCA 3’ and reverse 5’ GCTAATACGACTCACTATAGGGAGACCAGACGTCGTCCTCCTGA 3’). As ulk1 or atg14 PCR fragments contain T7 promoters, they were directly processed for in vitro transcription. The dsRNA that was complementary to the shp2, ulk1, and atg14 fragments was generated using the MEGAscript RNAi Kit (Ambion Inc., USA) and by following the manufacturer’s instructions.
ISE6 tick cells and lipofectamine (3 μl/1 ml culture) reagent (Invitrogen/ThermoFisher Scientific Inc., USA) were used for the transfection experiments. For each well, 1.0 × 10⁵ ISE6 tick cells were seeded in L-15B300 medium onto 12 well plates and incubated overnight for 18–20 h. After cell attachment and spreading, 750 ng of dsRNA was added with lipofectamine reagent into each well. There were six replicates for each group on the 12 well plate and the ISE6 tick cells were incubated for 5 h after treatment, then 1 ml of 2× L15-B300 medium was added to each of the wells. The 12-well plate was then incubated for another 18–20 h. A human promyelocytic cell line (HL-60 cells, obtained from ATCC, USA) was used to maintain A. phagocytophilum NCH1. Cell-free A. phagocytophilum was isolated from infected HL-60 cells as described in refs. 18,23. Cell-free bacteria isolated from these cells were used for in vitro infection studies. A. phagocytophilum infection was performed 24 h post-transfection and the plate was incubated for an additional 24 h then ISE6 tick cell samples were collected and processed for RNA and DNA extractions. Silencing efficiency and bacterial burden were determined by QRT-PCR analysis of the RNA or DNA samples, respectively. Cell viability was tested by microscopic examination and MTT assays as shown in Supplementary Figs. 6 and 11. MTT assays were performed as described ref. 17.
Inhibitor studies
The SHP-2 inhibitor (JAB-3068) was purchased from ChemieTek (CT, USA) and it is a PTP type 11 inhibitor. The mTOR inhibition was done with Rapamycin as it targets the mTOR protein’s active site. Concentrated stocks (500 µM) of SHP-2 inhibitor or Rapamycin were prepared in a DMSO solution. Mock tick cell samples had an equivalent amount of DMSO added to each of the wells, corresponding to the inhibitor used in that experiment. ISE6 tick cells (1.0 × 10⁵ cells per well) were seeded onto a 12-well plate and incubated for 18–20 h and each group had six replicates. After incubation, the cells were treated with either SHP-2 inhibitor Rapamycin, or mock solution. The final concentration of SHP-2 inhibitor in each of the treated wells was 25 µM and the final concentration of Rapamycin in each of the treated wells was 1.1 µM. After 4 h of treatment, the mock or inhibitor-treated wells were infected with A. phagocytophilum and incubated for an additional 24 h. The ISE6 tick cell samples were then collected and processed for RNA and DNA extractions to measure shp-2 or mTOR transcripts and the bacterial burden.
Statistics and reproducibility
Prism6 software and Microsoft Excel 2019 were used for performing statistical analysis in the data sets. Scatter plot graphs were generated in Prism6 software. Each open or closed circle, square, triangle, and inverted triangle in the Scatter plot graphs represents one data point generated from the average of two technical replicates. Sample sizes in each graph can be determined based on the number of data points seen in each Scatter plot graph and it ranges from three to eight per group. When comparing two means, an unpaired, two-tailed, t-test was performed. P values less than 0.05 were considered significant and P values greater than 0.05 were considered not significant in each of the analyses. Wherever necessary P values are indicated. ANOVA analysis was used to obtain P values when more than two groups were compared.
GenBank accession numbers
The GenBank accession numbers used and analyzed in this study are shown in Supplementary Table 2.
Reporting summary
Further information on research design is available in the Nature Portfolio Reporting Summary linked to this article.


Responses