Aspergillus fumigatus mitogenomes and their influence on azole-resistant and -susceptible populations

Introduction
Aspergillus fumigatus is a saprophytic fungus ubiquitously distributed in the environment with worldwide distribution1. In humans it can be an opportunistic pathogen and it is the most predominant Aspergillus spp. causing Invasive Pulmonary Aspergillosis (IPA) in immunosuppressed patients2. Interest in IPA has recently increased due to high mortality rates among patients co-infected with SARS-CoV-2, the virus that causes COVID-193. Recently, A. fumigatus was included in the World Health Organization’s (WHO) inaugural list of priority fungal pathogens4. The primary treatment against A. fumigatus infection is the administration of azole antifungal agents5, which target the Cyp51A protein in the ergosterol biosynthesis pathway6. Among humans infected with invasive forms of aspergillosis, azoles—such as voriconazole, isavuconazole, itraconazole and posaconazole—are the frontline clinical defense7,8. However, a globally escalating issue is the increasing frequency of infections with strains resistant to this class of antifungal agents9, and in some cases, the acquisition of resistance to azoles can occur during the infection treatment10. Furthermore, the evolution of resistance can evolve in the environment due to the extensive use of azoles like benzimidazoles against plant fungal pathogens11,12, which can persist in the environment for a long period due to the ability to resist changes in its molecular structure13. Other frequent sources of azole exposure are the contamination of soil, wastewater, and sewage14.
The primary mechanism of azole resistance in A. fumigatus is attributed to point mutations, characterized by non-synonymous nucleotide substitutions in the cyp51A gene, and tandem-repeat (TR) mutations occurring in the promoter region15. However, other resistance mechanisms are known, such as genes encoding efflux pumps, including ABC and MFS transporters, which are the main mechanism in eukaryotic organisms for removing toxins from the cell16, and their overexpression can lead to azole resistance in A. fumigatus17. Recently, non-cyp51A mediated resistance in A. fumigatus isolates has garnered increased interest. Current evidence implies the presence of numerous uninvestigated mutations that influence cellular processes that lead to resistance18,19,20. Among these processes, the impact of mitochondria on the virulence and resistance of medically important fungi has become increasingly evident21,22.
Previous research has shown that mitochondrial dysfunction can lead to azole resistance. The cox10 mutants, characterized by defective heme A biosynthesis, have been observed to upregulate calcium signaling genes. This upregulation results in the accumulation of cytosolic Ca2+ and the nuclear translocation of the transcription factor CrzA22. In another study, A. fumigatus null mutants in three genes that control mitochondrial morphology, fis1 (encoding a mitochondrial outer membrane protein), mdv1 (encoding a WD repeat-containing protein) and dnm1 (encoding a dynamin-like GTPase), showed increased resistance to azoles in conjunction with reduced growth and aberrant mitochondrial morphology23. Bcs1A of A. fumigatus was found to modulate the azole response via efflux pump expression, where its null mutant shows increase in resistance24. In addition to these genes, fzo1 and oxa1, encoding a mitochondrial protein required for the assembly of the cytochrome c oxidase complex and the F0 ATPase sub-complex, respectively, which impact mitochondrial morphology, have also been associated with the regulation of the gene pdr (pleiotropic drug resistance) expression in S. cerevisae, leading to increased drug resistance. Notably, the corresponding A. fumigatus orthologs remain uncharacterized21. Another process associated with resistance is related to the communication between the nucleus and mitochondria. In a study on mitochondrial dysfunction in S. cerevisiae, it was observed that Rtg1p and Rtg2p, responsible for signaling between the nucleus and mitochondria, including organelle dysfunction events, can control the activation of pdr genes21. In A. fumigatus, an Rgt2 homolog (AFUA_8G00730) exists, but its potential association with resistance remains unexplored.
These experimental investigations into mitochondria underscore the potential relationship between the mitochondrial genes of A. fumigatus and the evolution of azole resistance. Despite the existing evidence, there is a lack of detailed genomic studies examining the relationship with azole resistance and its potential impact on mitochondrial genome organization, as well as mitochondrial encoded (ME) and nuclear-encoded mitochondrial (NEM) proteins. Furthermore, the degree of intraspecific variation in A. fumigatus ME and NEM genes, which could provide valuable insights into the evolution of the species, remains unexplored. In the present study, mitochondrial sequences derived from A. fumigatus populations across various countries, encompassing both azole-sensitive and -resistant isolates (Cyp51A-dependent and –independent), were examined for intraspecies variation. Furthermore, an analysis was conducted to ascertain the associations of specific mutations with azole resistance.
Results
Characterization of A. fumigatus mitogenomes and nuclear-encoded mitochondrial protein genes
A total of 318 genomes and mitogenomes from both azole-resistant and -susceptible A. fumigatus isolates were assembled from whole genome sequencing (WGS) data. BUSCO analysis showed an average genome completeness of 96.34% (range: 92.9% to 96.6%; Supplementary Data 2), with an average of fragmented BUSCOs of 1.15% ranging from 1% to 3.1%. From the 318 WGS data, 316 mitogenomes were assembled that resulted in a singular circular contig, with sizes that ranged from 30693 to 31803 bp and showed low variation in GC content (25.33–25.49%; Supplementary Data 2). The mitogenome synteny showed only two general structures, with 286 mitogenomes (90.51%) with the same sequence structure with sizes ranging from 31680 bp to 31803 bp and 30 mitogenomes (9.49%) with an alternative structure with sizes from 30693 bp to 30757 bp. Two mitogenomes (isolates VPCI_1882 and VPCI_469) could not generate a good quality mitogenome assembly due to low genomic coverage and were discarded from the analysis.
The main difference between the structural groups was the presence of intronic sequences in the gene encoding cytochrome c oxidase (cox3 upstream of cox1) (Fig. 1). In all the mitogenomes examined, intronic sequences were observed within the cytochrome c oxidase I (cox1) gene. These sequences are associated with two types of homing endonucleases, namely GIY-YIG and LAGLIDADG, which exhibited minimal variation. Specifically, the 316 GIY-YIG endonuclease sequences were found to be identical for all samples. Across all mitogenomes, 27 transfer RNA (tRNA) sequences remained consistent in localization and classification of tRNA. They were classified into 22 distinct tRNA types, with the most frequently occurring type being methionine tRNA (trnM) with three copies in each isolate. The pan-mitogenome showed 19 core genes and 2 accessory genes, the latter comprising two variants of the cox3 gene upstream of cox1 gene and one extra smaller atp9 gene in 60% of isolates (Supplementary Data 3). The variation of cox3 gene is correlated to the intronic sequence variation, where all mitogenomes with the extra intron showed variation in this gene. There was no observed correlation of intronic variation and resistance phenotype.

Syntenic comparison of two structural representative mitogenomes. The number of mitogenome sequences with identical structure to the representatives is indicated.
To identify NEM proteins, two distinct signal peptide prediction tools to detect mitochondrial localization were employed. The intersection of results from Tppred3 and DeepLoc2 in the reference strain Af293 identified 353 proteins with putative mitochondrial signal peptides (Fig. 2a). This set was used as a reference list of NEM proteins for subsequent analysis. Additionally, it included previously characterized mitochondrial proteins from Af293 that were not predicted to contain signal peptides by the combination of both programs. This resulted in a final reference list with 468 NEM proteins from Af293 (Supplementary Data 5).
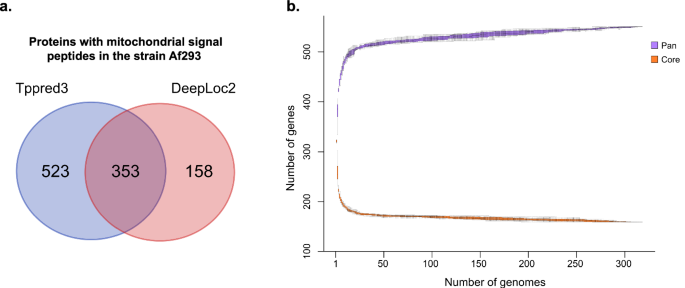
a Venn diagram depicting the proteins with peptide signal for mitochondrial transport found by each program used. b Gene content plot showing the accumulated gene set and core genes based on putative nuclear-encoded mitochondrial proteins.
Across the 318 studied genomes, the intersected results generated by these predictors revealed an average of 321 proteins exhibiting mitochondrial localization, ranging from 313 to 328 proteins for each isolate. The NEM orthologs revealed a core set comprising 164 genes, an accessory collection with 359 genes and 27 singleton genes. This resulted in a total of 550 NEM orthologous genes (Fig. 2b). According to the calculated Heap’s law model, with an alpha value of 2, the saturation for discovery of new NEM orthologs is almost reached.
The functional categorization of the core and accessory putative NEM proteins, based on KEGG (Fig. 3), revealed that most of the identified protein categories are associated with Mitochondrial biogenesis (44 KEGG), Ribosomes (22 KEGG), Peptidases and inhibitors (13 KEGG), Chaperones (11 KEGG), and Transporters (11 KEGG) (Fig. 3). The accessory genes were predominantly distributed across the categories of Peptidases and inhibitors, tRNA biogenesis, Mitochondrial biogenesis, Chaperones, and Translation factors (Fig. 3). Within the category of Mitochondrial biogenesis, the accessory genes were found to be orthologous to mitochondrial quality control factors, such as the iron-sulfur cluster assembly 2 protein (K22072), Fe-S cluster biogenesis protein (K22073), and respiratory chain complex assembly proteins COX11 (K02258), COX15 (K02259) and SURF1 (K14998). Additionally, orthologs of the Mitochondrial protein import machinery were identified, which include the calcium uniporter protein (K20858) and the mitochondrial protein import protein ZIM17 (K17808).
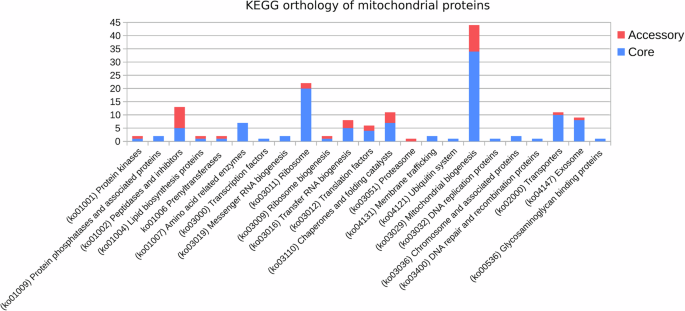
KEGG categorization of core and accessory mitochondrial genes.
Mitochondrial proteins and azole resistance
Variant calling using the reference of A. fumigatus Af293 found 3781 SNPs distributed across 468 mitochondrial genes were filtered to retain only those variants present in a minimum of 5% of the samples. This resulted in a refined set of 1749 SNPs spanning 417 mitochondrial genes. Principal Component Analysis (PCA) based on these SNPs revealed a partial clustering among the phenotypes. Although a clear distinction was observed, there was an overlap involving a subset of samples (Fig. 4a).
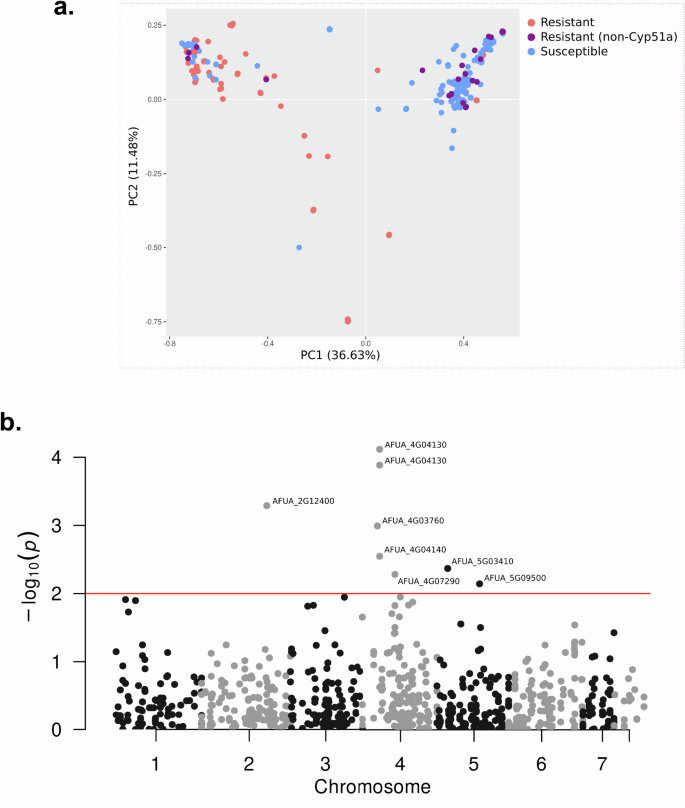
a PCA biplot using all mitochondrial SNPs comparing azole-resistant and -susceptible isolates, and isolates with Cyp51A-independent azole resistance. b Manhattan plot of SNPs significantly associated with the resistance phenotype. Red line depicts the p-value cutoff for significance.
GWA was performed to find possible associations of azole resistance with SNPs localized in mitochondrial genes. The analysis found no association for genes in the mitogenome. For genes that synthesize mitochondrial nuclear-encoded proteins, the analysis showed significant association for ten variants in seven genes (Fig. 4b), where three of them showed non-synonymous variants (Supplementary Data 4): a mitochondrial ATPase (AFUA_4G04130), an ATP synthase involved in oligomycin sensitivity (AFUA_2G12400) and an exopolyphosphatase (AFUA_5G03410).
A GWA study was conducted to identify associations between resistance and key components involved in mitochondrial fusion and fission in A. fumigatus. These components were analyzed separately due to the absence of mitochondrial transport peptide signals in some genes, specifically: mdv1 (AFUA_5G13140), dnm1 (AFUA_8G02840), Rtg2p_1 (AFUA_6G08350A), and Rtg2p_2 (AFUA_8G00730A). Other components, encoded by fis1 (AFUA_2G13320) and oxa1 (AFUA_5G03640), which possess mitochondrial signal peptides, were included in previous analyses. This selection is based on the review by Neubauer and colleagues23. A statistically significant association was identified using a chi-squared analysis. A SNP in fzo1 (chi-squared test, P < 0.0001, d.f. = 1), located within an intronic sequence, was found in 10 resistant isolates (9 cyp51A-independent and 1 cyp51A mutant) and 2 susceptible isolates. Additionally, a significant association was observed in fis1 (chi-squared test, P < 0.0001, d.f. = 1), present in 67 resistant isolates (4 cyp51A-independent and 63 cyp51A mutants) and 42 susceptible isolates.
To visualize the evolutionary relationship among isolates based on nuclear-encoded mitochondrial proteins, a phylogeny based on these gene variants was constructed (Fig. 5a). The phylogenetic tree showed the composition of two clades, named A (n = 150) and B (n = 168), following the same nomenclature of Sewell and colleagues25. Clade A was mainly composed of resistant isolates, representing 72% of the clade (108/150), where 105 isolates have a cyp51A mutation that has been previously associated with resistance, based on the MARDy database v1.1 for resistance variants26. In contrast, Clade B isolates were mostly azole-susceptible, with only 40 azole-resistant (23.8%), from which 28 do not show mutations in the gene cyp51A associated with antifungal resistance.
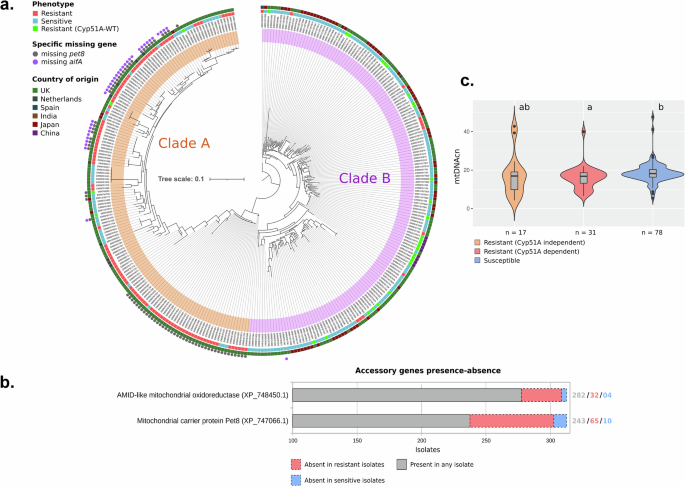
a Phylogenetic tree with bootstrap support based on SNPs in nuclear encoded mitochondrial genes. Resistance phenotype, Cyp51A genotype and country of origin are highlighted by coloured boxes and the absence of the genes pet8 and aifA are indicated by coloured circles. Clades A and B are highlighted by orange and pink bands, respectively. Tree scale represents nucleotide substitution per site. b Accessory genes significantly associated with resistance identified by Scoary and their occurrence according to phenotype. c Violin-plot and boxplot of mitochondrial DNA copy number comparing resistant and susceptible isolates, with p-value indicated for the Pairwise comparisons using Wilcoxon rank sum exact test and Bonferroni adjustment method.
To investigate the evolution of mismatch repair mechanism variations in A. fumigatus in relation to azole resistance and its distribution across subpopulations, we examined the msh6 gene (AFUA_4G08300) for mutations. A significant proportion of isolates within clade A (86%; 129/150) harbored the non-synonymous SNP G698C, resulting in an amino acid substitution (G233A). In contrast, only 1.78% (3/168) of isolates in clade B exhibited this variant, indicating a strong association with the mutation (chi-squared test, P < 0.0001, d.f. = 1).
Discriminant analysis of principal components (DAPC) subdivided the populations in four groups (Supplementary Figs. 2 and 3) with two groups in the clade A and two in the clade B. From the two groups in clade A, one is notably composed of azole-resistant isolates (35 resistant isolates out of 39 isolates), with all isolates from different regions of the United Kingdom (UK). Interestingly, all these isolates lack the gene encoding Pet8. The other subgroup in clade A is geographically more heterogeneous, with isolates from the UK, Netherlands, Spain, Japan, and India, comprising27 azole-resistant isolates out of 108. A subset of 30 isolates from this group lacks a functional aifA and pet8. Among these, 27 isolates are azole resistant. Unlike the isolates that only lack pet8, this subset includes isolates from geographically distant origins worldwide, including Spain, UK, Netherlands, and India. As for the two subgroups identified within clade B, they display geographical heterogeneity and are predominantly composed of azole-susceptible isolates. A significant proportion (chi-squared test, P < 0.0001, d.f. = 1) of the wildtype cyp51A resistant isolates are distributed across these two groups.
A correlation analysis was conducted with Scoary28, considering both azole-resistant and -sensitive phenotypes in relation with the presence or absence of genes in the isolates. The analysis indicated a correlation between the resistance phenotype and the absence of genes encoding the mitochondrial carrier protein (pet8, AFUA_8G01400A) and AMID-like mitochondrial oxidoreductase (aifA, AFUA_3G01290) (Fig. 5b and Supplementary Data 6). It was observed that out of 75 isolates lacking the pet8, 65 (86.7%) exhibited resistance. Similarly, among the 35 isolates devoid of aifA, 31 (88.6%) were resistant, with both genotypes representing the highest discrepancy in gene absence in the resistant phenotype, when compared with susceptible isolates. Notably, there was a considerable overlap of both genotypes, with both genes absent in 30 of the isolates (Fig. 5a), representing a significant association (chi-squared test, P < 0.0001, d.f. = 1). Furthermore, isolates missing both genes shared a closely related phylogenetic pattern of SNPs. The phylogenetic tree, constructed based on 1749 SNPs, revealed two distinct subclades within clade A. One subclade predominantly consisted of isolates lacking both genes, while the other primarily included isolates missing only the AMID-like oxidoreductase gene (Fig. 5a), being congruent with the subclade division found by DAPC analysis (Supplementary Fig. 2). In total, 25 genes showed significant association with the resistance phenotype, accounting for cyp51A dependent and independent resistance.
The average fixation index (FST) was calculated for populations grouped by phenotype to infer differentiation among these populations based on SNPs. This was achieved by measuring the difference within populations against the difference between populations, where an Fst value of 0 indicates no differentiation and an FST value of 1 indicates total differentiation29. The highest average FST (0.144) was observed between resistant cyp51A mutants and resistant cyp51A-independent populations, with the peak FST level located on chromosome IV near the cyp51A gene (Supplementary Fig. 5 and Supplementary Data 7). The lowest average FST (0.016) was found between susceptible and resistant cyp51A-independent populations, indicating no clear population distinction between these phenotypes. This lack of distinction is corroborated by DAPC analysis, which shows no clear clustering within clade B based on these phenotypes.
Tajima’s D was calculated for each phenotype, to infer the difference between the expected and the observed variation of each population based on SNPs, where a positive value indicates that the observed variation is higher than the observed and a negative value for observed variation lower than the expected. The average Tajima’s D for resistant cyp51A-independent isolates was −0.01 (Supplementary Data 7), suggesting that the observed variation aligns with the expected variation for a population under no selection. In contrast, the susceptible and resistant cyp51A mutant populations had average Tajima’s D values of −0.56 and 0.31, respectively, indicating different selection patterns among the three populations (Supplementary Data 7).
The mitochondrial DNA copy number (mtDNAcn) was evaluated, inferred from the average coverage of genomes and mitogenomes from genomes with high coverage data (above 50x), to determine potential variations in mitochondrial quantity within cells relative to the phenotype. The results showed a significantly lower copy number in the population of resistant (Cyp51A dependent) isolates, determined by the Wilcoxon rank sum exact test (p < 0.05) in comparison to susceptible isolates. In addition, these resistant isolates exhibited less variation in mtDNAcn compared to Cyp51A independent resistant isolates, as evidenced by their genome coverage (Fig. 5c). These findings show that there is a distinct genetic background involving mitochondrial adaptations between susceptible and resistant isolates, which could be determined also by the type of resistance, which are dependent on the phylogenetic affiliations of isolates with clade A, clade B and its subclades.
Construction of deletion mutants for the genes encoding the mitochondrial carrier protein (pet8, AFUA_8G01400A) and AMID-like mitochondrial oxidoreductase (aifA, AFUA_3G01290)
We constructed two independent mutants for A. fumigatus pet8 and aifA in the background of the A1163 pyrG– strain aiming to verify a possible role in azole resistance. We have used these two independent mutants to confirm the observed phenotypic effects were not due to the occurrence of possible secondary mutations caused by the genetic transformantion procedure. These mutants showed comparable growth phenotypes to the wild-type strain (A1160 pyrG+ strain; Fig. 6a), and most importantly their Minimal Inhibitory Concentrations (MICs) for posaconazole (MIC = 0.015 µg/ml), voriconazole (MIC = 0.5 µg/ml), itraconazole (MIC = 1.0 µg/ml), isavuconazole (MIC = 1.0 µg/ml), amphotericin (MIC = 1.0 µg/ml) and caspofungin (minimal effective concentration, MEC = 0.5 µg/ml) were the same than the wild-type strain, suggesting these mutations are not impacting the azole-resistance in the A1163 background.
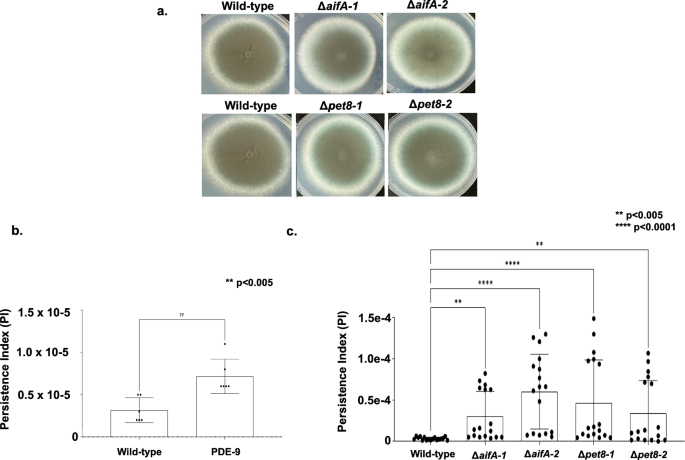
a Radial growth and morphology of the corresponding A1160 wild-type and two independent null mutants for aifA and pet8. b, c Voriconazole persistence index for A. fumigatus wild-type, PDE-9 and two independent null mutants for aifA and pet8.
A. fumigatus pet8 and aifA null mutants have increased azole-persistence
To check if the deletion of pet8 or aifA could be involved in the azole persistence, we developed a quantitative assay that uses supra-MIC concentrations (4xMIC) of azoles combined with extended exposure of the strains (96 h at 37 oC) to the azole and subsequent plating to evaluate the number of survival colony forming units (CFUs). Persistence index (PI) refers to the number of CFUs observed after exposure of fungal conidia to 4x MIC of voriconazole divided by the initial number of conidia used in the assay. To validade this assay, we first determined the azole persistence of A1160 parental strain and a previously described high persister strain, PDE-9. As expected the PDE-9 strain has a higher PI than A1160 (PI = 6.9e6, about twice more azole persistence; Fig. 6b). The Δpet8 and ΔaifA mutants showed a higher PI of about 3.0e−5 and 4.0e−5, respectively, when compared to the wild-type strain A1160 (PI = 3.39e−06; Fig. 6b), suggesting these genes could be involved in azole-persistence, and surprisingly they are more azole persistent than the PDE-9 strain. It is important to notice that the voriconazole MICs of about ten persisting colonies derived from the clinical wild-type, PDE-9 and the mutant strains have the same MIC from the parental strains.
Discussion
This study showed a comprehensive characterization and comparison of an unprecedented number of A. fumigatus mitogenomes. The sample set included both environmental and clinical azole-resistant and -susceptible representatives from at least six distinct global regions: UK, Ireland, Japan, India, China, and the Netherlands, in addition to four isolates of unknown geographical origins (Supplementary Data 1). The genomic data employed in this study provided sufficient coverage, facilitating the assembly of hundreds of high-quality nuclear genomes and closed circular mitogenomes. The analysis reveals minimal variation among the mitogenomic sequences of A. fumigatus isolates, with limited differences observed primarily in the presence of introns and intergenic regions. These findings are consistent with the observations of a previous study by Joardar and colleagues30, which examined interspecific mitogenome variations, however, there were discrepancies in the annotation, where our results show an additional cox3 gene with intronic sequence (Fig. 1), whereas the previous work30 annotated the gene as hypothetical. This can probably be explained by the development of new tools and more enriched databases that are currently available. Here, it is further established that within a large population of A. fumigatus, the mitogenome sequences are highly conserved. Moreover, it was found no correlation between SNPs in the mitogenome sequences and azole resistance phenotype.
Through signal peptide prediction analysis, we observed novel nuclear proteins that are potentially transported to the mitochondria of A. fumigatus, identifying a total of 468 nuclear-encoded mitochondrial proteins. In comparison, the reference strain A. fumigatus Af293, has 150 proteins encoded in its genome that are currently annotated as ‘mitochondrial’ (assembly accession GCA_000002655.1) and many of these annotations are putative, based on homology with other species. Additionally, the association analysis of the azole-resistance phenotype with these mitochondrial proteins, based on gene SNPs, revealed a correlation with the phylogenetic composition of the isolates, where a clear clustering of the resistant isolates was observed in the phylogenetic analysis and in the PCA analysis. A similar phylogenetic pattern was observed by Sewell and colleagues25 and Rhodes and colleagues31, based on variant calls of whole genomes, where the isolates also clustered in two groups, A and B, with the former group being highly enriched for azole resistant isolates. DAPC analysis further subdivided the population into four clusters, and interestingly, they are not explained mainly by geographical origin, with the exception of cluster 2 from clade A, composed only with isolates from the UK.
The Genome-Wide Association (GWA) analysis revealed three associations of statistical significance. Among these, two genes, namely the ATP synthase involved in oligomycin sensitivity (AFUA_2G12400) and an exopolyphosphatase (AFUA_5G03410), have not been previously correlated with azole sensitivity in existing literature. Conversely, the third found in the mitochondrial ATPase gene (afg1, AFUA_4G04130), has been reported to exhibit negative expression in azole resistant Cryptococcus neoformans32. The observed correlation between the absence of the genes pet8 (AFUA_8G01400A) and aifA (AFUA_3G01290) with the azole-resistance phenotype in A. fumigatus suggests a potential mechanism of resistance enhancement. This mechanism might be attributed to the absence or compromised functionality of these specific mitochondrial genes. The AMID-like oxidoreductase aifA gene in A. fumigatus is homologous to the apoptosis-inducing factor (AIFM2) in Saccharomyces cerevisiae33. Notably, AFUA_3G01290 has been observed to be upregulated in the presence of quinoline bromoquinol, potentially inducing apoptosis in A. fumigatus through oxidative stress33. Pet8 has a yeast homolog known as SAM5. SAM5 is an S-Adenosylmethionine (SAM) transporter involved in methyl group transfers. In eukaryotes, SAM5 can regulate the methylation of DNA, tRNA, and rRNA. The absence of this gene in yeast has been linked to growth defects due to mitochondrial malfunction34. The concurrent absence of the Pet8 and AMID-like oxidoreductase genes in azole-resistant isolates could suggest a potential synergistic mechanism of resistance. This mechanism might involve a malformation, possibly due to the lack of methylation regulation by Pet8, leading to apoptosis. However, this apoptosis could be inhibited due to the absence of the AMID-like oxidoreductase gene. Therefore, the absence of this apoptosis inducer, coupled with a mutation causing mitochondrial dysfunction and azole resistance, could constitute a significant synergistic mechanism of resistance. We deleted both genes in the reference A. fumigatus strain A1163 and both deletion mutants have comparable azole MIC values to the corresponding wild-type strain. These results suggest both mutations are dependent on the genomic architecture of the azole-resistant strains.
Bacterial persistence has been defined as the ability of a sub-population of a bacterial population to survive to supra-MIC concentrations of a specific drug without changing their original MICs to this drug35,36. However, little is known about drug persistence in filamentous fungi. Recently, we described A. fumigatus is able to show voriconazole-persistence but the mechanism of action of this persistence remains to be determined37,38,39. Here, we investigated if Pet8 and AifA are involved in vorizonazole-persistence. Surprisingly, both null mutants for the genes encoding these proteins showed about tenfold more vorizonazole-persistence than the wild-type strain, suggesting mitochondrial genes could be involved in azole-persistence. It is possible to hypothesize that azole-persistence could precede azole-resistance allowing the survivors time for evolving drug resistance. However, it remains to be determined how these genes are impacting azole-persistence and how they contribute to the evolution of azole-resistance.
Functional annotation of mitochondrial proteins, based on KEGG, has identified the Mitochondrial Calcium Uniporter (MCU) as an accessory protein. MCU plays a crucial role in mediating Ca2+ transport within the mitochondria and typically forms a unit with MICU1, a configuration that is generally conserved across at least 247 eukaryotes, being widespread in Plantae and Metazoa, but with a limited presence in Fungi40. Interestingly, A. fumigatus possesses the MCU ortholog AFUA_4G10310 but lacks MICU1. This condition, also observed in a few other fungal species such as Neurospora crassa, leads to the hypothesis that MCU may have lost its Ca2+ uptake ability in these organisms40. The observation that this gene is part of a non-core set in A. fumigatus aligns with the assumption that it may have evolved to perform a different function, potentially acquiring a new, non-essential role. Here, we found no correlation in the presence/absence of the gene with azole resistance, with this gene present in 33 azole-resistant and in 23 azole-susceptible isolates. However, previous work by Li and colleagues22 showed a connection of MCU with resistance, where it was identified up-regulation of the gene MCU in the multidrug resistant cox10 mutant. This acquired resistance was related to the activation of calcium signaling and increased expression of drug efflux pumps.
Azole-resistant isolates (Cyp51A dependent) were inferred to possess a reduced number of copies of mitochondrial genomes. Resistant Cyp51A independent isolates showed more variation and no significant difference, but this could be a result of the considerable lower number of representant isolates, impairing a robust statistical comparison for these isolates. Literature reports associating mitochondrial copy number with phenotypic variations in fungi are limited. However, one study demonstrated a reduction in mitochondrial copy number in calcineurin ΔcalA mutant strain41. From this observation, it could be hypothesized that these isolates may exhibit a decreased metabolic rate. This hypothesis is supported by evidence suggesting that cells with an increased mitochondrial content can exhibit enhanced oxidative phosphorylation activity42. Furthermore, it has been reported that A. fumigatus strains which have acquired resistance in patients exhibit a reduced growth rate as a fitness cost43,44. This observation aligns with the hypothesis and warrants further investigation into the potential link between mitochondrial copy number and azole resistance.
Most of the cyp51A-independent resistant isolates (92.8%) are found within clade B of A. fumigatus, which is predominantly composed of azole-sensitive isolates (76.2%). These isolates do not exhibit phylogenetic clustering, indicating multiple de novo origins of cyp51a-independent resistance mechanism(s). This observation suggests that cyp51A-dependent resistance mutations are more likely to emerge in clade A strains, possibly due to a more conducive genetic background. A genome-wide analysis of clade A and B isolates conducted by Rhodes and colleagues31 revealed that cyp51A-dependent azole-resistant isolates exhibit signatures of positive selection across multiple genomic regions, suggesting a polygenic basis for the resistance phenotype. It is plausible that clade B possesses a genetic background that is less conducive to the development of cyp51A-based resistance, and this could account for the observed higher prevalence of alternative resistance mechanisms within this clade.
It has been suggested that the multi-azole resistance observed in clade A is due to an increased propensity for resistance development, attributed to modifications in the DNA mismatch repair system. This is evidenced by a variant in the msh6 gene (G698C) in A. fumigatus, which occurs almost exclusively and dominantly in clade A. The MSH6 gene is part of the MutSα complex, responsible for recognizing base mismatches and small loops45,46. Additionally, Tajima’s D results indicate distinct selection patterns for mitochondrial genes in both resistant cyp51A mutants and resistant cyp51A-independent populations, with resistant cyp51A mutants experiencing greater selective pressure.
In summary, this study has explored potential mechanisms underlying azole resistance in A. fumigatus. The correlation between the absence of specific mitochondrial genes and azole resistance suggests a complex interplay of genetic background and metabolic factors contributing to resistance associated with the ergosterol synthesis pathway. The observed reduction in mitochondrial copy number in resistant isolates further supports the observation of a fitness cost of resistance. These findings not only enhance our understanding of azole resistance in A. fumigatus but also pave the way for future investigations. Further exploration of these mechanisms could provide valuable insights into the development of novel therapeutic strategies to combat azole resistance in A. fumigatus.
Methods
Data acquisition
All data utilized in this study were derived from publicly accessible sequencing projects involving A. fumigatus isolates. In order to study strains resistant and sensitive to azole antifungals, public data were obtained from studies (Available from the project accession numbers: PRJEB27135, PRJDB10244, PRJEB8623, PRJNA638646, PRJNA798608, PRJNA592352, PRJNA548244, PRJNA961646, PRJNA592352) that provided descriptions about the resistance or susceptibility of the isolates through in vitro assays, totalling 318 whole genome sequences consisting of 148 azole resistant and 170 azole sensitive isolates. 32 of the resistant isolates are wildtype cyp51A, suggesting cyp51A-independent resistance mechanisms are present. The reads were downloaded from GenBank47 using SRA Toolkit v3.0.248. The quality of sequences was verified by FastQC v.0.11.8 (Available at http://www.bioinformatics.babraham.ac.uk/projects/fastqc) and trimming of adapter sequences and quality filtering of the reads was completed with Trimmomatic v0.3949 using parameters “LEADING:20 TRAILING:20 MINLEN:60”.
Assembly and annotation of nuclear genomes and mitogenomes
De novo genome assemblies were done using SPAdes v.3.14.050. Genome completeness was inferred with BUSCO v5.4.451 using eurotiales_odb10 as the lineage parameter. For de novo assembly of mitochondrial sequences, the program GetOrganelle v1.7.6.152 was used. After assembly, all mitochondrial circular sequences had their nucleotide positions reallocated to start from the same position using the fasta_shift script (available at https://github.com/b-brankovics/fasta_tools).
The genomes were annotated using automatic protein prediction with AUGUSTUS v3.5.053 with the parameter ‘–species=aspergillus_fumigatus’. For predicting putative nuclear-encoded mitochondrial proteins, DeepLoc v2.054 and Tppred v3.055 were employed to identify signal peptides in proteins. Automatic annotation of mitogenome genes was performed using GeSeq v2.0356, followed by manual inspection. Mitogenome proteins were also annotated with MITOS v2.057 and manually compared to the GeSeq results to generate a high-quality consensus set of annotated genes.
Variant calling and GWAS
Processed reads were mapped to the reference genome of A. fumigatus Af293 (NCBI assembly code GCA_000002655.1) using Bowtie v2.3.5.158. SAM files were converted to BAM format with SAMtools v1.15.159. Single nucleotide polymorphisms (SNPs) were identified using the Genome Analysis Toolkit (GATK) v4.3.0.060 module ‘HaplotypeCaller’, with an interval list of 468 genes predicted to encode mitochondrial proteins and an interval padding of 500. All variant files were combined using the ‘CombineGVCFs’ module to create a single file for genotyping with ‘GenotypeGVCFs’. Low-confidence SNPs were filtered using ‘VariantFiltration’ with the parameters “QualByDepth < 25.0 || MappingQuality < 55.0 || MappingQualityRankSumTest < −0.5 || FisherStrand > 5.0 || StrandOddsRatio > 2.5 || ReadPosRankSumTest < −2.0”, resulting in 3781 high-confidence SNPs. The final combined VCF file was converted to PHYLIP format using vcf2phylip v2.0 (Available in: https://zenodo.org/record/2540861) for phylogenetic analysis.
Genome-wide association (GWA) analysis was conducted to identify associations between SNPs and the resistance phenotype. From the 3781 variants in the VCF file, it was filtered out those present in less than 5% of samples. Principal components were extracted from these variants using TASSEL v561, and the results were visualized using the R package ‘plotly’ (available at https://plot.ly). For the association analysis, the data were treated as binary—either resistant or susceptible—according to the descriptions of the original studies descriptions. We employed TASSEL v561 to construct a kinship matrix to account for population structure and perform a linear mixed model (LMM) analysist. The p-values of associations were corrected using the false discovery rate (FDR) method, and significance was defined as p < 0.05. Finally, we created a Manhattan plot with p-value distribution using the qqman R package62 and the relationship of expected and observed p-values from the LMM analysis were visualized with a qqplot (Supplementary Fig. 1) made using the same package.
Population structure based on mitochondrial protein encoding genes
The structure of A. fumigatus populations were based on the SNPs of nuclear-encoded mitochondrial proteins. Population structure analysis was performed with discriminant analysis of principal components (DAPC) using the adegenet R package v2.1.1063, in order to predict the number of populations and assignment of isolates. The likely number of populations was determined based on Bayesian information criterion (BIC) (Supplementary Fig. 4), with k = 4 and 100 principal components retained.
Comparative analyses
To compare the structure and visualize the differences between the regions of the mitogenomic sequences, synteny analysis was performed with Clinker v0.0.2364 using the GenBank files produced by GeSeq56. Pan-core analysis using protein sequences of mitochondrial genes was performed with the GET_HOMOLOGUES v3.5.465. For phylogenetic analyses, high-confidence mitochondrial SNPs were used for the inference of the maximum likelihood tree, inferred with IQ-TREE v1.766 using default parameters and the substitution model TVM + F + G4 automatically selected, and the ascertainment bias correction ( + ASC) added, which is recommended for SNP data. Generated trees were visualized in iTOL v667.
Fst and Tajima’s D population genetic statistics based on the nuclear mitochondrial genes were calculated with VCFtools v0.1.1668 using a 10 kb non-overlapping window and plots were produced by the qqman R package62.
Proteins with evidence for mitochondrial transport signal peptides were used for NEM orthologs analysis with panOCT v3.2369; to calculate the openness of the ‘pan-genome’ (NEM orthologs) based on Heap’s law the R package ‘micropan’ was used70. The panOCT results were also used to compose tables to run in Scoary v1.6.1628, in conjunction with the SNP phylogeny previously produced, using the method described by Rhodes and colleagues31 to find associations of the NEM orthologs with the resistant and susceptible phenotypes.
The core and accessory NEM orthologs were assigned to KEGG orthology using BlastKOALA27 and classified according to the KEGG Brite hierarchical classification system.
The quantification of mitochondrial copy number was calculated by mapping the reads to each genome and mitogenome with Bowtie v2.3.5.158 and calculating the average coverage with SAMtools v1.15.159. The final result was obtained by dividing the mitochondrial DNA average coverage by autosomal DNA average coverage. For the analysis only genomes with the whole sequence average coverage above 50x were considered, totaling 126 isolates (17 Cyp51A independent resistants, 31 Cyp51A dependent resistants and 78 susceptible to azoles), in order to mitigate high deviations caused by low coverage genomes.
Generation of A. fumigatus mutants
The replacement cassettes for the AFUA_8G01400 and AFUA_3G01290 genes were generated by in vivo recombination in S. cerevisiae, as previously described by Colot and colleagues71. Briefly, about 1.0 kb from each 5´UTR and 3´UTR flanking region of the targeted genes was PCR amplified from the A. fumigatus genomic DNA (CEA17 strain) using specific oligonucleotides: the 5´UTR sequence was amplified using the 5´UTR_gene_fw and 5´UTR_gene_rv primers and for 3´-UTR sequence amplification, the 3´UTR_gene_fw and 3´UTR_gene_rv primers were used. The primers 5´UTR_gene_fw and 3´UTR_gene_4_rv contained a short homologous sequence to the polylinker of the plasmid pRS426 and the 5´UTR_gene_rv and 3´UTR_gene_fw primers contained an overlapping sequence to the prototrophic marker pyrG, which was PCR amplified from the pCDA21 plasmid using the primers pyrG_fw and pyrG_rv. The individual gene fragments (5′ and 3′ UTRs and prototrophic marker gene) were transformed, together with plasmid pRS426, previously linearized with EcoRI and BamHI, into S. cerevisiae SC9721 using the lithium acetate method72. The genomic DNA of S. cerevisiae recombinant strains harboring the deletion cassettes was used as a template for PCR amplification utilizing TaKaRa Ex Taq™ DNA Polymerase (Clontech Takara Bio). Finally, the complete deletion cassette was used for A. fumigatus transformation. Southern blot analysis was performed to confirm the deletions (Supplementary Fig. 6). All primers used in this work are listed in the Supplementary Data 8.
Minimum inhibitory concentrations (MIC) and minimum effective concentration (MEC)
The MIC and MEC were determined visually after incubation at 37 °C for 48 h following the guidelines outlined in the Clinical and Laboratory Standards Institute M38-A3 (CLSI. M38-A3 Reference Method for Broth Dilution Antifungal Susceptibility Testing of Filamentous Fungi Approved Standard). All chemicals used (itraconazole, voriconazole, caspofungin, isavuconazole, posaconazole and amphotericin B) were acquired from Sigma-Aldrich and assayed in a range from 4-0 µg/mL. In brief, the MIC and MEC assay were performed in RPMI-1640 or minimal medium (MM), using a 96-well flat-bottom polystyrene microplate from an initial inoculum of 2.5 × 10⁴/mL. Plates were incubated at 37 °C without shaking for 48 h, and growth inhibition was visually evaluated. The MICs for itraconazole, voriconazole, isavuconazole, posaconazole and amphotericin B were defined as the lowest concentration causing 100% growth inhibition compared to the drug-free growth control, determined visually after incubation at 37 °C for 48 h. The MEC for caspofungin was also assessed visually, using the same inoculum concentration after incubation at 37 °C for 24 and 48 h. The MEC was considered the lowest concentration, which led to the growth of small, compact, and rounded hyphae compared to positive growth. The A. fumigatus A1163 strain was used as a control in each MIC or MEC assay.
Voriconazole persistence index
The persistence to voriconazole was analyzed by assessing the number of colonies forming unity (CFU). Briefly, a total 200 µL of MM containing 5×10⁶ CFU/mL conidia of each strain supplemented with voriconazole (4x MIC) was inoculated in 96-wells plate. After 96 h incubation at 37 °C, the wells were washed twice with sterile water and resuspended in 100uL of water. This volume was then plated in petri dishes containing solid MM (without drug). After 48 h incubation at 37 °C, the CFU was counted. The experiment was performed in at least 6 technical replicates and repeated 3 times independently. The viability of each strain was evaluated by plating 100 CFU of the fresh conidia in solid MM and monitoring of CFU number after 48 h incubation at 37 °C. The assay validation was done by first determining the azole persistence of A1160 parental strain and a previously described high persister strain, PDE-937. The persistence index was calculated by:


Responses