Association of mid-pregnancy ferritin levels with postpartum glucose metabolism in women with gestational diabetes

Introduction
Gestational diabetes mellitus (GDM), defined as any degree of glucose intolerance first recognized during pregnancy [1], affects 4–18% of pregnant women in different countries [2]. GDM increases the risk of maternal and neonatal complications which include caesarean section, preeclampsia, macrosomia, prematurity, stillbirth, hypoglycemia, congenital malformations, respiratory disorders, etc. [3]. Furthermore, women with GDM have an almost 10-fold higher risk of developing type 2 diabetes (T2DM) later in life comparted to those without GDM, and the risk is particularly notable in the first five years after delivery [4]. Therefore, the American Diabetes Association (ADA) recommends a 75-g oral glucose tolerance test (OGTT) to identify abnormal glucose metabolism (AGM) at 4–12 weeks postpartum and lifelong follow-up [5].
Iron is a crucial micronutrient that plays a critical role in maintaining body homeostasis and is an important factor in the development of hyperglycemia [6,7,8]. Iron deficiency is widespread. The World Health Organization (WHO) reports that anemia affects 37% of pregnant women worldwide, resulting in increased maternal and fetal complications [9]. Therefore, most countries recommend iron supplementation for pregnant women [10, 11]. However, excess iron has been implicated in the development of diabetes by affecting oxidative stress damage in the body [12,13,14,15]. Ferritin is the major iron storage protein and is widely used to reflect iron stores in the body, which can help identify iron overload [6]. It has been reported that high levels of serum ferritin are associated with T2DM and the development of GDM in pregnant women [7, 8, 16]. Furthermore, recent genetic evidence suggests a causal relationship between elevated systemic iron levels and an increased risk of T2DM [17]. However, there is a lack of studies that have investigated the association between serum ferritin levels during pregnancy and the subsequent risk of postpartum AGM in patients with GDM.
Therefore, the aim of this study is to investigate the relationship between mid-pregnancy serum ferritin levels and postpartum glucose metabolism in a cohort of 916 Chinese women with previous GDM.
Methods
Study population
This retrospective cohort study was conducted at the Department of Endocrinology and Metabolism of Shanghai General Hospital from January 2016 to January 2021. A total of 1514 women diagnosed with GDM at 24–28 weeks of gestation were recruited for our study. Subjects with chronic diseases including hypertension, diabetes, anemia, lupus, epilepsy, acute or chronic liver disease, acute or chronic renal disease, heart disease, acute or chronic inflammatory or infective diseases, drug or alcohol abuse, and history of cancer were excluded. Inclusion criteria were: 1) age≥18 years old; 2) live-birth singleton pregnancy. Of the 1514 participants, 524 women without serum ferritin at gestation of 24–28 weeks and 74 women without the results of 75-g OGTT at 4–12 weeks postpartum were excluded. Thus, 916 participants were included in the final analysis (Fig. 1).

A total of 1514 women diagnosed with GDM at 24–28 weeks of gestation were recruited for our study. After delivery, an additional 75-g OGTT was performed 4–12 weeks postpartum.
The study was conducted according to the guidelines of the Declaration of Helsinki, and approved by the Ethics Committee of Shanghai General Hospital. All the participants signed written informed consent.
Procedures and measurements
Demographic characteristics, medical history and family history including age at present pregnancy, pre-pregnancy body mass index (BMI), weight gain during pregnancy, gestational age, menstrual cycle, parity, history of miscarriage, family history of diabetes and hypertension, were recorded. BMI was calculated as the weight in kilograms divided by the square of the height in meters (kg/m2). At 24–28 weeks of gestation, a 75-g OGTT was performed and the GDM diagnosis was made if one or more of the following levels were observed according to the International Association of Diabetes and Pregnancy Study Groups (IADPSG) criteria [18]: fasting plasma glucose (FPG) level ≥5.1 mmol/L, 1-h postprandial glucose (1h-PG) level ≥10.0 mmol/L and 2-h postprandial glucose (2h-PG) level ≥8.5 mmol/L. Serum ferritin, hemoglobin, serum albumin, bilirubin, serum creatinine, serum uric acid, hemoglobin A1c (HbA1c), glycated albumin (GA) and other clinical indexes of glucose and lipid metabolism were evaluated at 24–28 weeks of gestation. All blood samples were obtained in the morning after an overnight fast of 8–10 h. Ferritin was measured using automated immunoassay systems (Siemens ADVIA Centaur XPT, Germany). Hemoglobin was measured by auto hematology analyzer (Mindray BC-6800, China). HbA1c was measured with an autoanalyzer (Lifotronic H8, Japan). The plasma insulin levels were measured using an automated chemiluminescence systems (Abbott i2000, United States). Serum glucose and lipid profiles including serum total cholesterol (TCH), triglycerides (TG), and serum albumin, bilirubin, serum uric acid, serum creatinine, were measured with an automatic biochemistry analyzer (Siemens ADVIA2400, Germany). All the testing of samples was performed in the same laboratory. Anemia was diagnosed as hemoglobin concentration <110 g/L for pregnant women according to the World Health Organization criteria.
The homeostasis model assessment (HOMA) of insulin resistance (HOMA-IR) was used to estimate the insulin resistance which was defined as [fasting insulin (lU/ml) * fasting glucose (mmol/l)]/22.5. HOMA of β-cell (HOMA-β), calculated as [20*fasting insulin (lU/ml)] / [fasting glucose (mmol/l) – 3.5], was used to assess β-cell function [19]. Insulin sensitivity index (ISI) was evaluated by using the Cederholm formula [20]: ISI = M/ [MGLU × lg (MINS)]. M = 75 000/120 + [FPG (mmol/L) − 2h- PG (mmol/L)] × 1.15×180 × 0.19 × body weight (kg)/120, MGLU = [FPG (mmol/L) + 2h-PG (mmol/L)] /2, lg(MINS) = {lg[fasting insulin (lU/ml)] + lg[2 h insulin (lU/ml)]}/2. Insulin resistance was defined as HOMA-IR ≥ 2.8 [21].
All the participants’ pregnancy complications including premature labor, macrosomia and neonatal hypoglycemia were recorded. Premature labor was defined as labor occurring between after 20 and before 37 gestational weeks. Macrosomia was defined as birth weight≥4000 g. Neonatal hypoglycemia was defined as blood glucose <2.6 mmol/L.
After delivery, an additional 75-g OGTT was performed 4–12 weeks postpartum. The results were interpreted based on the WHO criteria [22]: 1) normal glucose tolerance (NGT) was defined as FPG < 6.1 mmol/L and 2h-PG < 7.8 mmol/L; 2) impaired fasting glucose (IFG) was defined as 6.1 ≤ FPG <7.0 mmol/L and 2h-PG <7.8 mmol/L; 3) impaired glucose tolerance (IGT) was defined as FPG <6.1 mmol/L and 7.8 ≤ 2h-PG <11.1 mmol/L; 4) IFG + IGT was defined as 6.1 ≤ FPG <7.0 mmol/L and 7.8 ≤ 2h-PG <11.1 mmol/L; 5) diabetes mellitus (DM) was defined as a FPG ≥ 7.0 mmol/L and/ or 2h-PG ≥ 11.1 mmol/L; 6) abnormal glucose metabolism (AGM) was defined as IFG and/ or IGT and/ or DM.
Statistical analysis
Data were presented as the mean ± standard deviation (SD) or median (interquartile range, 25–75%) for continuous variables and proportion for categorical variables, respectively. Normally distributed continuous variables between two groups were compared by Student’s t test, while nonnormally distributed continuous variables between two groups were analyzed by the Mann-Whitney U test. One-way analysis of variance (ANOVA) was used to compare continuous variables across multiple groups. Post hoc multiple comparisons were conducted using the least significant difference (LSD) method. Categorical variables were analyzed by χ2 test. Multiple logistic regression models were performed to assess the association between mid-pregnancy ferritin levels and the risk of postpartum AGM by estimating odds ratio (OR) and 95% confidence intervals (CI) after adjusting for potential confounders. Analyses for association were performed using mid-pregnancy ferritin levels as categorical and continuous variables, respectively. The association between mid-pregnancy ferritin levels and risk of postpartum AGM was also checked graphically using restricted cubic splines with the ferritin reference level defined as 30 µg/L. To assess the consistency of the association between mid-pregnancy ferritin levels and the risk of postpartum AGM, subgroup analyses were performed in patients according to age (<35 or ≥35 years), and pre-pregnancy BMI ( < 24 or ≥24 kg/m2). The spearman correlation coefficients were used to assess the correlation between mid-pregnancy ferritin and glucose related indicators, insulin secretion and sensitivity indicators.
The restricted cubic splines analysis and the corresponding figures were performed with R version 4.1 (R Foundation for Statistical Computing, Vienna, Austria) using the rms package for restricted cubic splines. The other statistical analyses were performed using SPSS version 26 (IBM Corp., Armonk, NY), and a P value < 0.05 was considered statistically significant.
Results
Baseline characteristics of the study population and comparison of baseline indicators between the postpartum NGT and AGM groups
A total of 916 participants were finally included in this study. According to the postpartum 75-g OGTT results, 609 (66.5%) women returned to NGT. Of the remaining women with AGM, 7 (0.8%) were diagnosed with IFG, 246 (26.9%) were IGT, 17 (1.9%) were IFG + IGT, and 37 (4.0%) were diabetes. Postpartum HbA1c was significantly higher in DM group than in the other groups, and postpartum FPG was significantly higher in IFG, IFG + IGT and DM groups than that in NGT and IGT groups (Table 1 and Supplementary Table 1).
The comparison of demographics, clinical characteristics, and pregnancy complications between the NGT and AGM groups was illustrated in Table 1. Among the 916 participants, 307 (33.5%) were AGM, 25.4% were aged 35 years or older, and 26.2% had a pre-pregnancy BMI of 24 kg/m2 or higher. All participants underwent a lifestyle intervention, and 17.8% of the subjects received insulin therapy during pregnancy. Subjects in the AGM group were older and had higher pre-pregnancy BMI. Furthermore, the AGM group exhibited significantly elevated levels of mid-pregnancy FPG, 1h-PG, 2h-PG, HbA1c, GA, HOMA-IR, TG, as well as elevated HOMA-IR in both mid-pregnancy and postpartum. Conversely, the AGM group exhibited reduced mid-pregnancy and postpartum ISI. Additionally, the AGM group had a higher proportion of participants aged≥35 years, pre-pregnancy BMI ≥ 24 kg/m2, those received insulin therapy, and HOMA-IR ≥ 2.8 in mid-pregnancy and postpartum. Notably, the AGM group also showed significantly higher mid-pregnancy serum ferritin levels [AGM vs NGT: 23 (11.7, 69) µg/L vs 17.80 (9.85, 40.7) µg/L, P < 0.001] and a greater proportion of participants with ferritin levels ≥30 µg/L (AGM vs NGT: 43.6% vs 31.4%, P < 0.001). However, there were no significant differences in other clinical characteristics between the two groups, including gestational age, hemoglobin levels, HOMA-β, TCH, albumin, total bilirubin, uric acid, creatinine, the proportion of individuals with a family history of hypertension and diabetes, history of miscarriage, as well as pregnancy complications (Table 1).
Association of mid-pregnancy serum ferritin and the risk of postpartum AGM
To determine the association between serum ferritin levels and the risk of postpartum AGM, logistic regression analysis was performed. The results revealed that the women with ferritin levels≥ 30 µg/L had a 1.678 times higher likelihood of developing postpartum AGM than those with ferritin levels <30 µg/L after adjusting for age and pre-pregnancy BMI (OR = 1.678, 95% CI: 1.259–2.236, P < 0.001) (Table 2). This association remained after further adjusting for weight gain during pregnancy, mid-pregnancy hemoglobin, FPG and HbA1c (OR = 1.566, 95% CI: 1.162–2.111, P = 0.003) (Table 2). Consistently, the risk of postpartum AGM also increased linearly with increasing mid-pregnancy ferritin levels as a continuous variable (Fig. 2), and every 1 µg/L increase in ferritin was associated with a 0.5% increase in the developing of postpartum AGM after adjusting for potential confounding factors (OR = 1.005, 95% CI: 1.001–1.008, P = 0.012) (Table 2).
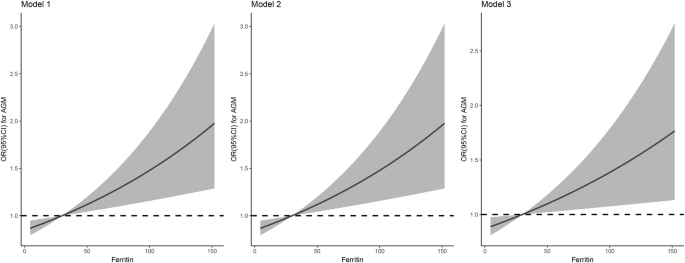
The association between mid-pregnancy ferritin levels and risk of postpartum AGM was checked graphically using restricted cubic splines with the ferritin reference level defined as 30 µg/L. Model 1 was adjusted for age and pre-pregnancy BMI. Model 2 was further adjusted for mid-pregnancy hemoglobin. Model 3: Model 2 further adjusted for weight gain during pregnancy, mid-pregnancy FPG and HbA1c.
Subgroup analysis
Advanced maternal age is markedly linked with adverse obstetrical and perinatal outcomes, which is usually defined as maternal age above 35 years. According to the Working Group on Obesity in China, overweight was defined as a 24 ≤ BMI < 28 kg/m2 and obesity was defined as BMI ≥ 28 kg/m2. Subgroup analysis was conducted to further explore the association between serum ferritin levels and the risk of postpartum AGM in these different population groups. The results indicated that the association between serum ferritin levels and the risk of postpartum AGM was consistent across subgroups stratified by age (<35 or ≥35 years) and pre-pregnancy BMI ( < 24 or ≥24 kg/m2) (Fig. 3).
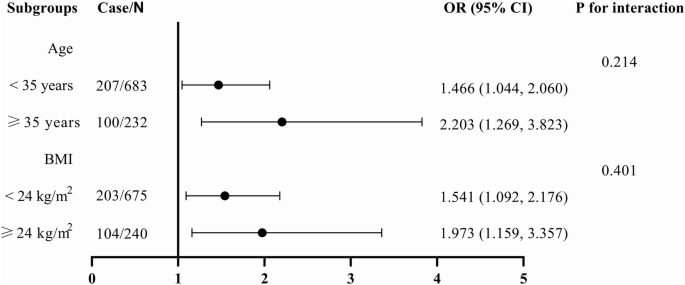
Subgroup analysis of association between mid-pregnancy ferritin levels and the risk of postpartum AGM were performed in patients according to age (<35 or ≥35 years), and pre-pregnancy BMI ( < 24 or ≥24 kg/m2). Logistic regression model was adjusted for age, pre-pregnancy BMI, and hemoglobin. OR, Odds ratio; 95% CI, 95% confidence interval; BMI, body mass index.
Associations of mid-pregnancy ferritin with glycemic and insulin secretion and sensitivity parameters
The Spearman correlation analysis showed that mid-pregnancy ferritin was positively correlated with mid-pregnancy and postpartum HbA1c, GA, HOMA-β (P < 0.001), negatively correlated with mid-pregnancy and postpartum ISI (r = −0.115, P = 0.001 and r = −0.125, P < 0.001 respectively) (Table 3).
Discussion
In this retrospective cohort study, we aimed to investigated the relationship between mid-pregnancy serum ferritin levels and the subsequent risk of postpartum AGM in a cohort of 916 Chinese women with previous GDM. Our findings revealed that women in the postpartum AGM group had higher levels of mid-pregnancy serum ferritin and a greater proportion of women with ferritin levels ≥30 µg/L. Furthermore, our studies showed that elevated mid-pregnancy ferritin levels were independently associated with an increased risk of postpartum AGM.
Most previous studies have reported a significant association between elevated serum ferritin levels during pregnancy and the risk of GDM. In a prospective observational study conducted by Cheng et al., involving 851 Chinese pregnant women, it was observed that elevated serum ferritin levels in early pregnancy were significantly associated with an increased risk of GDM [23]. Similarly, Pandey et al. also conducted a prospective observational study and reported that serum ferritin levels in early second trimester of pregnancy were associated with the development of GDM [24]. They suggested that serum ferritin level could be used as a predictive marker for the development of GDM. Furthermore, a systematic review has indicated that high maternal serum ferritin levels play a significant role in the development of GDM [8]. Wang et al. provided evidence that systemic iron status could be a causal factor in T2DM development using an mendelian randomization approach [17]. However, there is limited research on the association between serum ferritin levels during pregnancy or postpartum and postpartum hyperglycemia. Sharifi et al. conducted a study on 64 women with GDM and found no significant association between mid-pregnancy ferritin levels and OGTT results at 8 weeks postpartum [25]. Hershenfeld S et al. also conducted a study on 105 women with previous GDM and 235 women without GDM and found no significant difference in serum ferritin levels between the two groups at 1 or 3 years postpartum. Moreover, neither baseline ferritin at 1 year postpartum nor its change over the subsequent 2 years was associated with glucose tolerance at 3 years [26]. In a 6-year postpartum follow-up study conducted by Källner et al., involving 157 women with GDM, no significant differences in ferritin levels were found between the postpartum NGT and impaired glucose metabolism (IGM) groups [27]. Therefore, it emerges that neither serum ferritin during pregnancy nor postpartum is associated with postpartum glucose metabolism in women with previous GDM.
In contrast to previous studies, our study, which involved 916 women diagnosed with GDM, revealed that the AGM group exhibited markedly elevated mid-pregnancy serum ferritin levels. A serum ferritin concentration less than 30 µg/L was mostly used for identification of iron deficiency [28]. In our study, we showed that ferritin levels≥ 30 µg/L were significantly associated with an increased risk of developing postpartum AGM after adjustment for multiple covariates. The association between serum ferritin levels and the risk of postpartum AGM was consistent across different subgroups. The disparity between our findings and those of previous studies might due to variations in follow-up duration or the sample size. Previous studies had sample sizes of less than 200, whereas ours involved nearly 1000 participants. Therefore, it is essential to conduct multicenter studies with larger cohorts and longer follow-up periods to validate our findings.
Recent researches suggested that iron may play a role in the pathophysiology of diabetes and GDM. Ferritin, the main iron storage protein, can serve as an indicator of the body’s iron reserves. However, the exact mechanism underlying the elevation of serum ferritin in the development of abnormal glucose metabolism remains unclear. Many studies suggest that an excess of iron can initiate oxidative stress damage to pancreatic β-cells and induce insulin resistance by catalyzing the production of reactive oxygen species (ROS), thereby increasing the risk of diabetes. Mice with targeted deletion of Hfe, a model for hemochromatosis, exhibit elevated iron content in islets, increased oxidative stress in β-cells, and a decrease in insulin secretion capacity [29]. Furthermore, iron overload can also induce oxidative stress damage to the liver. The liver plays a crucial role in glucose metabolism. In an experiment on stressed rats, iron supplementation exacerbated iron deposition and oxidative stress damage in the liver, leading to the development of persistent hyperglycemia [30]. Additionally, ferritin is also regarded as an acute-phase inflammatory reactant, and elevated ferritin levels promote the inflammatory process. This, in turn, leads to increased insulin resistance, reduced pancreatic insulin secretion, and liver dysfunction [31]. In our study, we observed a negative correlation between mid-pregnancy ferritin and postpartum ISI, as well as a positive correlation with postpartum HOMA-β. However, we did not identify a significant correlation between mid-pregnancy ferritin and postpartum HOMA-IR. This lack of correlation may be attributed to the fact that the HOMA-IR used in this study specifically assessed fasting insulin resistance, whereas the ISI calculated through the Cederholm formula reflects insulin sensitivity after glucose load. We speculated that oxidative stress damage induced by high ferritin levels during mid-pregnancy may have long-lasting effects, persisting into the postpartum period and contributing to impaired insulin sensitivity. In this scenario, pancreatic β-cells may struggle to compensate for the insulin resistance adequately, resulting in glucose metabolism disorders. Therefore, further mechanistic studies are imperative for a comprehensive understanding.
Iron is a crucial micronutrient, and iron deficiency anemia (IDA) during pregnancy is associated with an increased risk of maternal and fetal complications. Therefore, most countries recommend iron supplementation in pregnant women to prevent IDA. However, available evidence suggests that high iron intake during pregnancy increases the risk of GDM [32,33,34,35,36]. Based on our study and previous studies, routine iron supplementation should be reconsidered in pregnant women with normal serum ferritin levels due to the associated risks of GDM and postpartum AGM.
The reported incidence of postpartum AGM ranged from 2.6% to 38% within 12 weeks postpartum [37, 38]. In our study, 33.5% of women exhibited abnormal glucose tolerance, with 0.8% had IFG, 26.9% had IGT, 1.9% had both IFG and IGT, and 4% had diabetes. Despite recommendations for women with GDM to undergo a glucose tolerance test at 4–12 weeks postpartum, screening rate remain low [39, 40]. This underscores the necessity for intensified efforts to incentivize more women with GDM to undergo screening for T2DM.
A systematic review revealed that factors such as pre-pregnancy BMI, family history of diabetes, non-white ethnicity, advanced maternal age, elevated FPG, HbA1c levels and insulin use during pregnancy were significantly associated with the increased risk of developing T2DM in women with previous GDM [41, 42]. Furthermore, our study identified that in the postpartum AGM group also exhibited characteristics such as advanced maternal age, higher pre-pregnancy BMI, elevated FPG, postprandial blood glucose (PBG), and HbA1c levels, as well as a higher frequency of insulin usage.
Our study has several limitations. Firstly, ferritin is considered as an acute-phase inflammatory reactant and is influenced by inflammation. We did not evaluate inflammatory factors such as C Reactive Protein (CRP), which could potentially impact our findings. Secondly, we didn’t collect information on iron supplement use, so further research on the relationship between iron supplement and postpartum GDM is needed. Thirdly, we did not assess postpartum ferritin levels or evaluate the ferritin trajectory from mid-pregnancy to the postpartum period and their association with postpartum glucose metabolism. Lastly, our follow-up period was relatively short, warranting consideration for longer-term assessments.
In conclusion, our study showed that high levels of ferritin during mid-pregnancy are significantly and independently associated with an increased risk of postpartum AGM in women with previous GDM, suggesting that mid-pregnancy ferritin could serve as an indicator of early postpartum AGM risk. Iron supplements as part of prenatal care, especially for women with GDM who do not have anemia, should be approached cautiously, especially for those at high risk of developing DM after delivery.


Responses