Associations between hypovitaminosis D, adiposity indices and insulin resistance in adolescents: mediation analyses from NHANES 2011–2018

Introduction
Vitamin D is functionally a hormone rather than a vitamin, and it is one of the most important biological regulators of calcium metabolism [1]. In addition to bone metabolism, hypovitaminosis D may also be associated with obesity, insulin resistance, cardiovascular disease, and other conditions. 25-hydroxyvitamin D (25(OH)D) is the predominant circulating form of vitamin D, and thus it is considered to be the most reliable index of vitamin D status [2]. A level below 50 ~ 75 nmol/L (or 20 ~ 30 ng/ml) of serum/plasma 25(OH)D concentration is considered to define vitamin D deficiency (VDD) by most researchers [3]. Large-scale population studies indicate a prevalence of approximately 15% for vitamin D deficiency or insufficiency (25(OH)D < 20 ng/mL or 50 nmol/L) among US pediatric populations [4]. In China, the prevalence of VDD (25(OH)D < 30 nmol/L) among healthy children is 21.57%, with the highest rate occurring during adolescence, reaching 56.14% [5].
The levels of serum 25(OH)D showed an inverse association with obesity in children [6, 7]. Studies conducted on adults have also substantiated an inverse association between serum 25(OH)D levels and obesity [8]. Research has shown that areas with more overweight children also have a higher proportion of children with hypovitaminosis D (25OHD <30 ng/ml) [6]. Extensive research has indicated that human obesity is often accompanied by hypovitaminosis D [9] and elevated expression of the vitamin D receptor (VDR) in subcutaneous adipose tissue [10]. Animal experimentation has revealed that overexpression of the human VDR in the adipose tissue of mice results in augmented fat mass, impaired glucose tolerance, and reduced energy expenditure [11]. A proposed hypothesis posits that the observed deficiency in serum 25(OH)D levels in obesity is likely due to reduced bioavailability, potentially related to the sequestration of 25(OH)D as a fat-soluble steroid hormone in adipose tissue [12].
Studies have demonstrated an inverse correlation between hypovitaminosis D and the homeostasis model assessment of insulin resistance (HOMA-IR), which is a metric for insulin resistance defined as an elevation in insulin secretion required to maintain glycemic homeostasis [13]. Over a five-year follow-up, Australian populations exhibited a positive correlation between serum 25(OH)D3 concentrations and insulin sensitivity [14]. Furthermore, vitamin D supplementation has been shown to reduce the risk of insulin resistance and lower circulating insulin levels [13]. With regard to pediatrics, an association between hypovitaminosis D and insulin resistance has also been found [15].
However, the extent to which the link between serum 25(OH)D and insulin metabolism is confounded or mediated by excess adiposity in pediatric patients remains poorly understood. Mediation analysis is a statistical technique used to assess potential mechanisms underlying the association between exposure and outcome by quantifying the extent to which this relationship is mediated by an intermediary variable [16].
The results of a study on adults in the United States showed the mediating role of obesity indicators in hypovitaminosis D and IR [17]. Among their findings, body mass index (BMI) was found to have significant mediation effects (to varying extents) on the associations between serum 25(OH)D and HOMA-IR (p < 0.05).However, there is currently a lack of relevant research reports in the field of pediatrics. The objective of this study is to investigate the mediating role of adiposity indices in the relationship between hypovitaminosis D and IR among children and adolescents, with potential differences in the degree of mediation observed across various adiposity indices.The adiposity indices utilized in this study included BMI, alongside the Fat Mass Index (FMI), defined as the ratio of fat mass to height squared, serving as a more precise measure of body fat content [18].
Materials & methods
Study design and population
This study was designed as a cross-sectional study using data from the 2011–2018 NHANES survey by the Centers for Disease Control and Prevention (CDC). All NHANES protocols were approved by the ethics review board of the U.S. National Center for Health Statistics. All participants and their parents/guardians provided written informed consent. Further information on NHANES procedures and cycle-specific response rates can be found on the NHANES website [19].
Participants were screened for inclusion according to the following eligibility criteria: (1) age ≥12 years and ≤18 years, and (2) data available on at least one adiposity index (FMI or BMI). The exclusion criteria were as follows: (1) missing HOMA-IR data, (2) absence of serum 25(OH)D level, and (3) reported use of oral antidiabetic agents, insulin, or hypotensive drugs.
Measures
Standardized anthropometric and body composition (dual-energy X-ray absorptiometry [DXA]) measures were taken as part of the physical examination in the Mobile Examination Center. For the assessment of height and weight during the physical examination, participants were dressed in underwear, disposable paper gowns, and foam slippers. Non-pregnant youth aged 8 years or older were eligible to undergo whole-body DXA scans with Hologic Discovery A densitometers. Each DXA scan was reviewed and analyzed by the University of California, San Francisco Department of Radiology.
Demographic variables
Demographic variables were obtained from demographic data in the NHANES database, including age (12–18 years), gender, race/ethnicity (non-Hispanic white, Mexican American, non-Hispanic black, other Hispanic, or other race/multiple races), and the ratio of family income to poverty (PIR). The poverty income ratio for the not poor was defined as ≥1, and for the poor was defined as <1.
Laboratory measures
In the NHANES 2011–2018, serum 25(OH)D concentrations were measured by the ultra-high performance liquid chromatography-tandem mass spectrometry (UHPLC-MS/MS) method. The lower limit of detection (LLOD in nmol/L) for 25-hydroxyvitamin D3 was 2.23 nmol/L, details of which have been documented elsewhere (CDC/National Center for Health Statistics. Analytical Note for 25-Hydroxyvitamin D in Serum NHANES 2011–2012. Accessed January 4, 2024. Available from https://wwwn.cdc.gov/nchs/data/nhanes/2011-2012/labmethods/VID_G_met_Vitamin_D.pdf). A level below 50 nmol/L of serum 25(OH)D concentration was defined as hypovitaminosis D. The NHANES dataset also provided laboratory results of total cholesterol, triglycerides (TG), high-density lipoprotein (HDL) cholesterol, low-density lipoprotein (LDL) cholesterol, fasting insulin, and fasting plasma glucose levels. Among them, fasting insulin concentrations were assessed utilizing a two-site immunoenzymometric assay (the AIA-PACK IRI methodology), whereas the determination of other biomarkers was conducted employing enzymatic assays.
Adiposity indices
Body mass index (BMI) was extracted directly from examination data. FMI was calculated as DXA-derived total fat mass (kg) divided by height (m²) [20]. DXA has demonstrated good precision and accuracy for measuring whole-body composition [21], and FMI is thought to be a better metric of adiposity than BMI and percent body fat (which could reflect differences in fat mass and/or lean mass) [18].
Homeostasis model assessment for insulin resistance cut-off points
The presence of IR in children was defined according to the HOMA insulin resistance (HOMA-IR) index. It was calculated using the equation: fasting glucose (mg/dL) × fasting insulin (pmol/L)/405/6 [22]. HOMA-IR ≥ 3.0 is considered abnormal in children and adolescents, indicating the presence of insulin resistance, as reported by the expert panel of the United States National Heart, Lung, and Blood Institute [23] and used in prior investigations [24, 25].
Covariates
In addition to regular demographic data and blood lipid indicators, there are two additional covariates, including physical activity (inactive/moderate/vigorous/both moderate and vigorous) and tobacco exposure (yes/no). Physical activity was assessed by vigorous physical activity (high-intensity activities, fitness, and sports such as running or basketball) and moderate physical activity (e.g., brisk walking, swimming, and bicycling at a regular pace) reported by participants. Tobacco exposure status was obtained from questionnaire data. It was defined by a “yes” response to the questions: “Have you ever tried cigarette smoking, even 1 or 2 puffs?” or “Does anyone who lives here smoke cigarettes, cigars, or pipes anywhere inside this home?”
Statistical analysis
Statistical software (R version 4.3.1; https://cran.r-project.org/) was utilized for statistical analysis (package interactions and mediation). A two-tailed p-value of <0.05 was deemed statistically significant across all analyses. We employed population-weighted parametric and nonparametric tests, where appropriate, to examine the associations of baseline characteristics. In descriptive statistics, continuous variables are presented as means with standard deviations or medians along with interquartile ranges, while categorical variables are presented as proportions and percentages of the total. To compare categorical variables among groups, the χ2 test was applied. For continuous variables, one-way analysis of variance was used to compare normally distributed variables, and the Kruskal–Wallis H test was employed for skewed distributed variables across groups.
Multivariate logistic regression analysis was conducted to assess the association between hypovitaminosis D and insulin resistance. Additionally, multivariate linear regression analysis was performed to evaluate the association between hypovitaminosis D and adiposity indices (FMI and BMI). To further investigate the moderating role of sex, the strength of the association between insulin resistance, hypovitaminosis D, and adiposity index was calculated separately for male and female subgroups. The relationship between obesity and insulin resistance is complicated. To conduct an in-depth analysis of HOMAIR and uncover its major influencing indicators, this study employed the XGBoost algorithm. The XGBoost algorithm is a machine learning algorithm based on gradient-boosted decision trees, supporting parallel processing, effectively handling classification and regression problems, and featuring higher accuracy and faster training speed [26], which boasts strong interpretability, providing tools for feature importance analysis that can quantify the contribution of each feature to the model’s predictions. This study measures feature importance by evaluating the information gain brought by each feature when splitting nodes in XGBoost.
Mediation analyses were performed to determine whether adiposity indices mediated the relationship between the exposure variable (hypovitaminosis D) and outcome (Insulin resistance). Thousand bootstraps were utilized in our analysis. The results present the size of the indirect pathway effect, the proportion of the mediating effect, and the p-value for the mediating effect.
The application of these weights, as recommended by the Centers for Disease Control and Prevention, accounts for the oversampling of minority groups, ensuring that the resulting models yield unbiased and precise estimates representative of the broader population.
Results
Participant characteristics
A total of 1781 participants were enrolled in this study (Fig. S1), among whom 1529 had data available for FMI and 1781 for BMI, Table 1 outlines the participant characteristics. The participants (n = 1781) were categorized into four groups: “Insulin resistance without hypovitaminosis D”, “Insulin resistance with hypovitaminosis D”, “Without Insulin resistance and hypovitaminosis D”, and “hypovitaminosis D without insulin resistance”. Insulin resistance was defined as a HOMA-IR > 3.0 (Table 1). The average age of the participants was 14.95 years, with 46% being male.Regarding race/ethnicity, the distribution was as follows: 15.05% Mexican American, 13.87% other Hispanics, 55.07% non-Hispanic White, 7.31% non-Hispanic Black and 8.70% other race. The data revealed that 41.27% of participants had Insulin resistance, 40.31% had hypovitaminosis D, and the median values for FMI and BMI were 7.19 kg/m2 and 22.4 kg/m2, respectively.
Significant differences in adiposity indices were observed among the four groups: “Insulin resistance without hypovitaminosis D,” “Insulin resistance with hypovitaminosis D,” “Without Insulin resistance and hypovitaminosis D,” and “hypovitaminosis D without Insulin resistance.” (respective FMI: 9.41 (6.69–13.02) vs. 12.42 (7.96–18.38) vs. 5.96 (3.98–8.52) vs. 6.20 (4.31–9.72), p < 0.001; respective BMI: 25.8 (21.9–30.4) vs. 29.2 (23.4–34.9) vs. 21.0 (19.3–23.7) vs. 20.8 (18.6–24.2), p < 0.001). Participants with Insulin resistance and/or hypovitaminosis D had higher levels of adiposity index compared to those without Insulin resistance or hypovitaminosis D.
Correlations of hypovitaminosis D with Insulin resistance and adiposity indices
After adjusting for potential confounders, including age, sex, race/ ethnicity, poverty income ratio, activity,tobacco exposure, Cholesterol, HDL, LDL, and Triglyceride, hypovitaminosis D was significantly associated with insulin resistance (β = −0.09, 95% confidence interval [CI] = −0.13 to −0.04, p < 0.001) (Table 2). Additionally, hypovitaminosis D was associated with adiposity indices (FMI: β = −0.07, 95% CI = −0.12 to −0.03, p < 0.001; BMI: β = −0.03, 95% CI = −0.05 to −0.01, p = 0.003) (Table 2). Furthermore, the negative correlation between hypovitaminosis D and insulin resistance was stronger in males than in females; When controlling for all confounding factors, hypovitaminosis D was significantly associated with adiposity indices in females (FMI: β = −0.08, 95% CI = −0.14–0.03, p = 0.003; BMI: β = −0.04, 95% CI = −0.07 to −0.01, p = 0.005). However, no significant association was observed between hypovitaminosis D and adiposity indices in males for either FMI (β = −0.06, 95% CI = −0.13–0.00, p = 0.054) or BMI (β = −0.02, 95% CI = −0.05 to −0.01, p = 0.174).
Associations between adiposity indices and Insulin resistance
To further elucidate the relationship between adiposity indices and insulin resistance, we employed the XGboost algorithm, incorporating not only FMI and BMI but also DXA-derived total fat mass (kg), Cholesterol, TG, HDL, LDL, and serum 25(OH)D concentrations as determinants. Figure 1 depicts the feature importance plot derived from XGBoost. This plot illustrates the degree of importance of various features for HOMAIR, revealing that total fat mass, triglyceride, Cholesterol, BMI, and FMI are the four most significant features, accounting for (26.54%, 18.21%, 11.52%, 10.36%, and 10.25%) of the total feature importance, respectively.

Ranking of the importance of adiposity indices and other adiposity-related factors in insulin resistance.
Mediating effect of adiposity indices on hypovitaminosis D and Insulin resistance
As demonstrated in Table 3 and Fig. 2, adiposity indices significantly mediated the association between hypovitaminosis D and Insulin resistance (FMI: proportion mediated [PM], 43.84%; average causal mediation effects [ACME] = −0.0525 [95% CI = −0.0540 to −0.05], p < 0.001; BMI: PM, 40.87%; ACME = −0.0567 [95% CI = −0.0582 to −0.06], p < 0.001). When the participants were stratified based on sex, adiposity indices were found to significantly mediate the relationship between hypovitaminosis D and insulin resistance in both males and females, after adjusting for all covariates (FMI: PM, 36.12%; ACME = −0.0483 [95% CI = −0.0511 to −0.05], p < 0.001; BMI: PM, 33.36%; ACME = −0.0491 [95% CI = −0.0516 to −0.05], p < 0.001 in males, and FMI: PM, 51.56%; ACME = −0.0610 [95% CI = −0.0635 to −0.06], p < 0.001; BMI: PM, 46.19%; ACME = −0.0645 [95% CI = −0.0666 to −0.06], p < 0.001 in females).
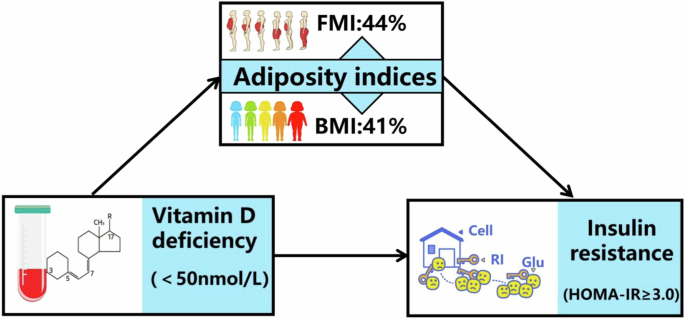
FMI: PM, 44%*; ACME = −0.05*. BMI: PM, 41%*; ACME = −0.05*. Figure demonstrating mediation models with independent variables of vitamin D deficiency, mediators of adiposity indices (BMI or FMI) and dependent variable of insulin resistance. ACME indicates average causal mediation effects (e.g., indirect effect) and PM indicates proportion mediated effects, e.g., proportion of the total effect due to the mediator. ACME and average direct effect coefficients are displayed along with the PM. * indicates p < 0.05. ACME average causal mediation effects, PM proportion mediated.
Discussion
The aim of this research is to investigate the correlation between hypovitaminosis D and insulin resistance among American adolescents, leveraging the NHANES database, and to determine the potential mediating role of adiposity in this association.
Initially, our findings reveal a significant association between hypovitaminosis D and insulin resistance. However, we observed no significant gender-specific interaction effects, indicating that gender does not moderate this relationship. Furthermore,we discovered that individuals with higher serum 25(OH)D levels exhibited lower insulin resistance coefficients, findings that align with previous research [27]. Studies [7, 28] conducted on children and adolescents have found that, HOMA-IR were inversely associated with 25(OH)D concentration in children, corroborating these relationships, insulin sensitivity (QUICKI index) was directly associated with concentrations of 25(OH)D. In a decade-long prospective follow-up study [29] of adults, a negative correlation was observed between serum 25(OH)D concentration and the future risk of insulin resistance. However, there are also inconsistent research results, a randomized controlled trials reported that 25(OH)D supplementation had no significant impact on the risk of diabetes [30]. In Pires LV’s study [28], no significant association was observed between HOMA-IR and 25(OH)D levels among prepubescent children, whereas a cross-sectional association was noted between HOMA-IR and 25(OH)D levels during puberty. Researchers suggest that these associations may be triggered by puberty. The disparities in these results could be attributed to variations in obesity indicators, baseline serum 25(OH)D levels, study cohorts, confounding factors, and methods used to assess insulin resistance. There is substantial biological evidence supporting the role of vitamin D in insulin resistance, which is underpinned by various mechanisms: the active form of vitamin D (1,25[OH]2D) possesses the capacity to activate insulin receptors and insulin signaling transduction [31, 32]. Extant research has firmly established that vitamin D modulates insulin sensitivity via its receptors and 1-alpha-hydroxylase in pancreatic beta cells, 25(OH)D response elements in the human insulin gene promoter, and receptors present in skeletal muscle [31, 32]. Moreover, treatment with 1,25-hydroxyvitamin D3 has been shown to upregulate insulin receptors in skeletal muscle [33]. Notably, experimental studies have demonstrated a correlation between vitamin D and mitochondrial function [34], indicating that dysfunction in these organelles may precede the development of insulin resistance.
Second, our finding indicates a significant association between hypovitaminosis D and adiposity indices, which aligns with numerous prior studies [35]. Research indicated a strong correlation between overweight/obesity and reduced serum 25(OH) concentrations among Mexican adults [36]; Studies have reported that hypovitaminosis D can contribute to the development of obesity among adults and children [37, 38]. In an 11-year longitudinal cohort study [39], a negative association was observed between serum 25(OH)D levels and the risk of clinical weight gain among adults with normal baseline body weight. Extensive evidence supported that 1,25-(OH)2D possesses the capacity to stimulate lipolysis and suppress lipogenesis [40, 41]. This ability to regulate lipid metabolism is hypothesized to result in reduced lipid accumulation within adipocytes and an improvement in overall fat metabolism [42]. This may be due to the influx of calcium into fat cells through increased synthesis of parathyroid hormone [43], and hyperparathyroidism secondary to hypovitaminosis D could explain the observed correlation between hypovitaminosis D and obesity [44]. In addition, vitamin D is negatively correlated with obesity, and the relationship between them may be bidirectional. A significant research study [45] encompassing 42,024 individuals explored the causal association between hypovitaminosis D and obesity, employing Mendelian randomization with 12 BMI-related single-nucleotide polymorphisms.Their findings suggested that a higher BMI leads to reduced levels of 25(OH)D; nevertheless, the contribution of lower 25(OH)D levels towards obesity development appears to be minimal.
Thirdly, our analysis through the XGboost algorithm has revealed that total fat mass, triglyceride and cholesterol play pivotal roles in insulin resistance. Interestingly, BMI and FMI rank lower in importance compared to the aforementioned three determinants. Extensive scholarly evidence underscores the significant association between childhood obesity and insulin resistance [46, 47]. In terms of biological mechanisms, excess systemic FFAs (Free Fatty Acids) and dietary lipids enter inside the cells of non-adipose organs,and are deposited as ectopic fat, generating lipotoxicity. Toxic lipids dysregulate cellular organelles,dysregulated organelles release excess ROS and pro-inflammation, resulting in systemic inflammation. Long term low-grade systemic inflammation prevents insulin from its action in the insulin signaling pathway, disrupts glucose homeostasis, and results in systemic dysregulation [48]. A study conducted among adults in Beijing, China, suggests that high triglyceride levels are a significant independent risk factor for insulin resistance, particularly among those with normal blood sugar levels [49]. Additionally, in a separate study, an increase in HOMA-IR was observed exclusively in individuals presenting with dyslipidemia [50]. It is found that blood cholesterol levels can lead to cholesterol overload in tissue cells, including pancreatic β-cells, making them unable to correctly transport sterols to their final destination, resulting in changes in plasma membrane organization, impaired mitochondrial activity, and reduced maturation and sorting of insulin granules [51]. It was shown that in adolescents, a higher level of FMI is associated with a higher HOMA [52]; Research suggests that high FMI levels appear to be independently associated with metabolic syndrome, serving as an effective measure in clinical practice to assess MetS(Metabolic Syndrome) [53]. The ranking of the importance of various determinants in our statistical analysis can serve as a reference for predicting the risk of insulin resistance in adolescents.
Fourthly, our subgroup analysis demonstrates a significant association between hypovitaminosis D and adiposity indices exclusively among girls, while no significant association observed among boys. In a large-scale study conducted among elderly individuals in western China [54], no significant association was discovered between vitamin D status and BMI among males, while a negative correlation was observed between vitamin D status and FMI as well as waist-to-hip ratio. Gender differences may reflect a male predisposition towards accumulating visceral fat tissue, whereas females tend to store more subcutaneous fat (gluteal-femoral) compared to males [55, 56]. Additionally, these disparities could be attributed to males having a higher lean muscle mass than females, as BMI fails to distinguish between fat mass and lean muscle mass. Nevertheless,gender disparities in the association between vitamin D status and adiposity indices may be influenced by the positive correlation between vitamin D and testosterone levels [57]. Prior studies have shown that vitamin D supplementation elevates testosterone levels among males [57], potentially mitigating the impact of hypovitaminosis D on obesity risk. However, in a study [58] of Chinese adults aged ≥50, no gender differences were found in the negative association between vitamin D deficiency and obesity indices (BMI and body fat percentage via bioelectrical impedance analysis). These varying results could be attributed to the disparities in baseline of hypovitaminosis D levels and different age groups or ethnicities, as well as gender-specific differences in various characteristics that may serve as confounding factors influencing the relationship, for instance, sex hormone fluctuations across life stages differ between genders, potentially overshadowing the impact of hypovitaminosis D on obesity.
Ultimately, in agreement with the literature [17], our findings indicated that adiposity indices significantly mediate the association between hypovitaminosis D and insulin metabolism parameters. In our results, after adjusting for confounding factors, the proportion of mediation for FMI was 43.84%, and the proportion of mediation for BMI was 40.87%. In previous adults study [17], the proportion of mediation for BMI in the association between 25(OH)D and HOMA-IR was 58.1%, the proportion of mediation for Anthropometrically-predicted visceral adipose tissue in the association between 25(OH)D and HOMA-IR was 36.1%. Therefore,adiposity is postulated to play a pivotal role in mediating the comorbidity of hypovitaminosis D and IR. Previous studies [59, 60] have supported higher adiposity indices among patients with hypovitaminosis D or IR.
This study is the first to investigate the adiposity-mediated association between hypovitaminosis D and IR among adolescents, leveraging a large and racially diverse sample. In this study, we utilized FMI and BMI as indices for adiposity, recognizing BMI as an indirect measure that fails to account for age, gender, skeletal structure, fat distribution, or muscle mass. Given BMI’s limitations, the relationship between serum 25(OH)D and overall obesity may be underestimated. To mitigate this, we also employed FMI, which more accurately reflects both obesity and adiposity status,and adjusted for key confounding variables.Nevertheless, limitations exist in this study. Firstly, given its cross-sectional design, causal relationships between hypovitaminosis D, obesity, and IR cannot be firmly established. Secondly, the study population did not represent clinically diagnosed patients with IR, highlighting the need for large-scale prospective studies among insulin-resistant or diabetic patients to generalize our findings. Moreover, the use of a uniform cut-off for defining IR may introduce bias, as HOMA-IR values are elevated in adolescents compared to those who have reached full pubertal development. In future research endeavors, we will endeavor to mitigate such biases by attempting to include Tanner staging as a covariate or by discussing it in the context of subgroup analyses.
Conclusion
Our study showed that hypovitaminosis D, adiposity indices (BMI and FMI) and insulin resistance are pairwise correlated; Of them,we highlighted the importance of sex in the study of hypovitaminosis D and FMI/BMI in adolescents, and may help explain the mechanism behind the comorbidity of hypovitaminosis D and Obesity. The total fat mass, triglyceride and cholesterol have greater impacts on insulin resistance, even surpassing BMI and FMI. Therefore, beyond the well-known total fat mass, triglyceride and cholesterol levels may also serve as clinical predictors for insulin resistance in adolescents. Further exploration of the mechanisms and studies across diverse populations is warranted. Lower serum 25(OH)D concentrations are associated with insulin resistance in children and adolescents, with adiposity indices (BMI and FMI) serving as a significant mediator in the relationship between 25(OH)D and insulin metabolism, among them, the mediating role of FMI is stronger than BMI. These findings underscore the importance of optimizing 25(OH)D levels in the clinical management of obesity and insulin resistance among children and adolescents, particularly in the context of the rising incidence of obesity and insulin resistance among Chinese children and adolescents. This emphasizes the need for targeted interventions to ensure adequate vitamin D levels as a part of a comprehensive approach to addressing these health concerns. Variations exist across different ethnic groups. Future research will involve conducting extensive surveys and intervention studies among Chinese youth to investigate the potential of vitamin D supplementation in mitigating the risks of obesity and insulin resistance.
Responses