Astrocytic cannabinoid receptor 1 promotes resilience by dampening stress-induced blood–brain barrier alterations

Main
Major depressive disorder (MDD) affects one in five individuals throughout their lifetime1. Current treatments have only a 30% success rate1, highlighting the need for a better understanding of underlying causal biological factors. Chronic stress is the main environmental risk for MDD2, and we previously reported that both social stress and MDD alter blood–brain barrier (BBB) integrity3,4,5. The BBB is responsible for regulating molecular exchange between the periphery and the brain, critical for its homeostasis maintenance6,7. In mice, chronic social stress induces BBB disruption promoting depression-like behaviors, highlighting a link between neurovascular health and stress vulnerability3,4,5,8. Accordingly, resilient (RES) mice exhibit molecular adaptations favoring BBB integrity, possibly contributing to coping strategies4,5.
The endocannabinoid system (ECS) is a crucial regulator of stress responses, and its disruption is associated with depressive behaviors in clinical and preclinical studies9,10. Cannabinoid receptor 1 (CB1, encoded by Cnr1) is the main ECS effector in the brain, and CB1 downstream signaling has been implicated in stress resilience10,11. Astrocyte end feet establishes the link between endothelial cells and neurons, enabling neurovascular communication, crucial to BBB function12. Coverage of blood vessels by astrocyte end feet is reduced in postmortem brain samples from individuals with MDD13. CB1 function on the astrocyte membrane close to synaptic terminals has been widely investigated14, and mitochondrial CB1 is implicated in the regulation of glucose metabolism and behaviors15. Perivascular astrocytic CB1 is perfectly positioned to modulate BBB properties during stress exposure and mood disorders and may promote comorbid depression in vascular and neurodegenerative diseases, also displaying BBB alterations16. Nevertheless, perivascular astrocytic CB1 remains understudied17.
Here we evaluated astrocytic Cnr1 expression in the nucleus accumbens (NAc) and prefrontal cortex (PFC) of mice subjected to chronic social defeat stress (CSDS), a mouse model of depression18 that disrupts BBB integrity in these brain areas3,5. The NAc has key roles in reward and mood regulation, while the PFC is involved in social behaviors, executive function and decision-making19. We then performed viral-mediated functional experiments to test the impact of manipulating Cnr1 expression in astrocytes or neurons on anxiety- and depression-like behaviors. Morphological analysis of perivascular astrocytic CB1 with super-resolution microscopy was combined with cell-specific transcriptomic analysis and in vitro experiments to gain mechanistic insights on endocannabinoid alterations underlying stress vulnerability versus resilience. Both physical exercise and antidepressant treatment response were associated with increased NAc Cnr1 expression in mice. Change in astrocytic CNR1 expression was validated on postmortem brain samples from individuals with MDD. This study links perivascular endocannabinoid signaling at astrocytic CB1 with stress resilience and mood disorders.
Increased astrocytic CB1 expression in the NAc shell is associated with stress resilience in mice
CSDS induces a depression-like phenotype in a stress-susceptible (SS) subpopulation of mice, mimicking MDD symptoms like social avoidance, anhedonia and anxiety18. An advantage of CSDS is the generation of animals with behaviors comparable to unstressed controls (CTRL), defined as RES, allowing investigation into the biology underlying resilience and vulnerability. In this protocol, a male C57BL/6 mouse is subjected to 5 min of physical bouts of social defeat by a CD-1 aggressor for 10 days. Behavioral phenotype is assessed with the social interaction (SI) test performed 24 h later (Fig. 1a). Mice displaying avoidance are considered SS, and those with intact social behaviors RES (Fig. 1b and Supplementary Fig. 1a). CSDS alters BBB integrity, promoting depression-like behaviors in SS mice, but the mechanism underlying neurovascular adaptations associated with resilience is unknown. Considering its key role as a mediator of stress responses9,10, we first evaluated individual differences in the ECS in the NAc and PFC of SS versus RES males (Fig. 1c,d). We showed that chronic stress alters BBB integrity in a sex-specific manner, with the BBB being more vulnerable in the female PFC5 versus male NAc3. Unbiased transcriptional profiling of >40 ECS targets with a TaqMan array revealed increased Cnr1 gene expression in the NAc of stressed males (Fig. 1d and Supplementary Fig. 1b–e), confirmed in RES only with more sensitive quantitative PCR analysis (Fig. 1c). Notably, Cnr1 mRNA levels correlated with SIs (***P = 0.0002; Fig. 1c). The changes were NAc specific, with no regulation observed in the PFC (Fig. 1d and Supplementary Fig. 1b) in line with intact BBB integrity3.

a, Experimental timeline of 10-day CSDS, SI and tissue collection. b, Individual SI values (left) and representative heatmaps (right) of normalized time spent in the interaction zone during the SI test for male CSDS. c, Quantitative PCR revealed upregulation of Cnr1 gene expression in the NAc of stress RES male mice when compared to unstressed CTRL and SS animals. d, ECS TaqMan array revealed higher Cnr1 gene expression in stressed mice versus CTRL in the NAc but not PFC; the range of color indicates individual differences within a group, with yellow indicating increased expression and blue indicating decreased expression as compared to CTRL. e, Individual SI values (left) and corner time (middle) with representative heatmaps (left). f, Cell-type percentage colocalizing with CB1 protein detected by immunofluorescence. g,i, Increased number of S100β+ cells expressing CB1-encoded protein in RES males as compared to SS and CTRL in the NAc shell (g), but not the NAc core (i). NS, nonsignificant. h,j, Representative images of CB1, S100β and Map2 immunohistochemistry in the NAc after social defeat stress in the shell (h) and core (j). Data represent mean ± s.e.m.; the number of animals or subjects (n) is indicated on graphs. One-way ANOVA or Brown–Forsythe ANOVA test followed by Holm–Šídák’s or Tuckey’s multiple comparison test was applied. For n < 8, the Kruskal–Wallis test followed by Dunn’s multiple comparisons evaluation was used; correlations were evaluated with Pearson’s correlation coefficient; ***P ≤ 0.001, **P ≤ 0.01, *P ≤ 0.05. Panels a, f, j and i created using BioRender.com.
Source data
To identify whether RES-associated upregulation of NAc Cnr1 is occurring in neurons or astrocytes, immunofluorescence analysis was performed with the neuronal marker microtubule-associated protein 2 (Map2) and S100 calcium-binding protein β (S100β), enriched in perivascular astrocytes. In the NAc of male mice subjected to CSDS (Fig. 1e and Supplementary Fig. 1f), 71% of CB1 proteins colocalized with neurons and 23% with astrocytes (Fig. 1f). The NAc is differentiated into two anatomically and functionally distinct regions20. The NAc shell is implicated in the control of reward-seeking behavior by spatial/contextual information, whereas the core is involved in learning and action during goal-directed behavior21,22. CB1 increase was observed in S100β+ cells in the NAc shell of RES mice versus CTRL and SS animals (stress × cell-type effect, **P = 0.0039) and correlated with SIs in stressed mice (**P = 0.0012; Fig. 1g,h and Supplementary Fig. 1g). In NAc core neurons of SS mice, CSDS increased CB1 (cell-type effect, **P = 0.0023), but this was not correlated with behavioral outcome (Fig. 1i,j and Supplementary Fig. 1h). Altogether, these findings suggest that chronic stress resilience could be linked with NAc shell astrocyte-specific CB1 upregulation.
Cnr1 overexpression in the mouse NAc astrocytes is anxiolytic and promotes stress resilience
The involvement of NAc astrocytic CB1 in anxiety- and depression-like behaviors has yet to be investigated despite a key role for this brain area in emotion regulation and mood disorders19. We designed an adeno-associated virus (AAV) vector driving Cnr1 expression in GFAP+ astrocytes that was validated in vitro and in vivo (Fig. 2a,b and Supplementary Fig. 2a–d). Because we observed that RES mice displayed increases in CB1 expression in the NAc shell, we performed stereotactic injection of AAV-GFAP-Cnr1 in the NAc shell of male mice driving increased Cnr1 expression in GFAP+ astrocytes (Fig. 2a,b). We next performed bilateral NAc shell injections in male mice with either the AAV-GFAP-Cnr1 or AAV-GFAP-sham virus and performed a battery of behavioral tests 3 weeks later when the viral expression was optimal. Overexpression of astrocytic Cnr1 led to a reduction of baseline anxiety-related behaviors as indicated by increased time and number of entries in the center of the open field (OF) test arena compared to AAV-GFAP-sham-injected CTRL (*P = 0.0186; Fig. 2c and Supplementary Fig. 2e). In the elevated plus maze (EPM) test, AAV-GFAP-Cnr1-injected mice did not spend more time in the open arms but entered them more often than their sham-injected counterparts (Fig. 2d and Supplementary Fig. 2f). As for the splash test (ST), mice injected with AAV-GFAP-Cnr1 in the NAc shell started grooming sooner despite being exposed to a new environment, suggesting decreased anxiety (*P = 0.0500; Fig. 2e). Upregulation of Cnr1 expression did not affect baseline social behaviors (Fig. 2f and Supplementary Fig. 2g). AAV-GFAP-Cnr1 animals spending more time in the OF center also groomed earlier, linking anxiolytic effects across different behavioral domains (*P = 0.0383; Fig. 2g). As for other depression-like behaviors, no effect was noted in the tail suspension test (TST) and forced swim test (FST; Supplementary Fig. 2h). However, low basal anxiety correlated with reduced anhedonia in the sucrose preference test (SPT) and immobility in the FST (*P = 0.0179; Fig. 2g). These results suggest that increased astrocytic Cnr1 in the NAc shell has anxiolytic effects, even in unstressed animals. This study provides evidence supporting a role for astrocytic Cnr1 in regulating anxiety-like behaviors.

a, Experimental timeline of NAc shell bilateral injection of AAV-GFAP-Cnr1 or AAV-GFAP-sham viruses and behavioral studies. b, Viral validation with RNAscope confirmed upregulation of Cnr1 in AAV-GFAP-Cnr1-infected astrocytes of male mice. c, Following bilateral injection with AAV-GFAP-Cnr1, mice spend more time in the OF arena center (top). Representative heatmaps of normalized time spent in the center (bottom). d, Bilateral injection with AAV-GFAP-Cnr1 has anxiolytic effect in the EPM with more times open arms entries (top). Representative heatmaps of time spent in the EPM open arms (bottom). e, AAV-GFAP-Cnr1-injected mice start grooming sooner in the ST new environment, indicating decreased anxiety. f, Viral manipulation did not alter sociability. Individual SI ratios (left) and representative heatmaps (right) of normalized time spent in the interaction zone. g, Intra-individual anxiety and motivated behaviors are correlated. h, Experimental timeline of NAc shell bilateral injection of AAV-GFAP-Cnr1 or AAV-GFAP-sham viruses followed by CSDS and behavioral studies. i, Social deficits induced by CSDS are prevented in males injected with the AAV-GFAP-Cnr1 virus according to the time spent in the interaction zone (IZ; left) and representative heatmaps (right). j, RNAscope representative image of AAV-GFAP-Cnr1 expression in NAc shell astrocytes. k,l, Following bilateral injection with the AAV-GFAP-Cnr1, mice spent more time in the EPM open arms (left, representative heatmaps on the right; k) and the OF center (left, representative heatmaps on the right; l). m, Bilateral AAV-GFAP-Cnr1 injection in the NAc shell increased grooming time in the ST (left), suggesting a positive effect on motivated behaviors. It also increased mobility in the FST (right). Data represent mean ± s.e.m.; the number of animals (n) is indicated on graphs. Two-tailed t-test or Mann–Whitney U test was applied (a–f); correlations were evaluated with Pearson’s correlation coefficient (g); a two-way ANOVA or nonparametric two-way ANOVA on ranks followed by Holm–Šídák’s or Wilcox multiple comparison test was applied (h–m); ****P < 0.0001, **P ≤ 0.01, *P ≤ 0.05. Panels a, h and j created using BioRender.com.
Source data
Cnr1−/−-deficient mice and transgenic mice lacking Cnr1 on cortical neurons are highly sensitive to stress23,24. However, it is undetermined if Cnr1 in the NAc astrocytes contributes to stress responses. We explored this hypothesis by injecting male mice with AAV-GFAP-Cnr1 or the control AAV-GFAP-sham virus, followed by a 10-day CSDS and then a battery of behavioral tests (Fig. 2h). The detrimental effect of CSDS on SIs was blunted in the AAV-GFAP-Cnr1 group—AAV-GFAP-sham-injected animals displayed social avoidance with less time spent in the interaction zone when the target is present (stress effect, *P = 0.0180), a phenomenon not observed in AAV-GFAP-Cnr1 mice (Fig. 2i and Supplementary Fig. 3a). Cell-specific expression of Cnr1 in GFAP+ astrocytes was again validated with RNAscope (Fig. 2j and Supplementary Fig. 3b). Increasing Cnr1 expression in the NAc shell astrocytes had anxiolytic effects not only in unstressed CTRL but also in animals subjected to CSDS with mice injected with the AAV-GFAP-Cnr1 showing decreased anxiety in EPM and OF tests (EPM—virus effect, *P = 0.04; OF—virus effect, **P = 0.0089; Fig. 2k,l and Supplementary Fig. 3c,d). Chronic stress induces grooming perturbation in the ST due to a decrease in motivated behaviors and hedonic inclination. Astrocytic Cnr1 upregulation in the NAc shell protects against these behavioral deficits, with AAV-GFAP-Cnr1-injected mice exhibiting decreased latency to groom in the ST test (virus effect, *P = 0.0496) and overall increased grooming behavior (virus effect, *P = 0.0145; Fig. 2m and Supplementary Fig. 3e). No differences were observed for anhedonia or TST (Supplementary Fig. 3f). However, higher mobility in the FST was observed in mice expressing AAV-GFAP-Cnr1 in the NAc shell astrocytes when compared to animals injected with the AAV-GFAP-sham virus (virus effect, ****P < 0.0001; Fig. 2m). Overall, these findings indicate that upregulation of Cnr1 in the NAc shell astrocytes could represent a positive biological adaptation contributing to resilience in the context of chronic social stress exposure.
To confirm the importance of increased NAc shell astrocytic Cnr1 expression in stress resilience, we designed AAVs including an artificial miRNA (shmir) leading to transient suppression of Cnr1 in either astrocytes or neurons (Fig. 3a,b and Supplementary Fig. 3g,h). Exposure to CSDS leads to an increase in cFos expression in NeuN+ neurons in the NAc of SS, but not RES male mice, suggesting neuronal function alteration (Supplementary Fig. 4a). Injection of the AAV-GFAP-shmir-Cnr1 in the NAc shell mimics this change, with increased cFos in NeuN+ cells observed in both groups of stressed mice (Supplementary Fig. 4b). AAV-driven downregulation of astrocytic Cnr1 did not affect social behaviors at baseline (Fig. 3c and Supplementary Fig. 4c), but reduced time spent in the EPM open arms (Supplementary Fig. 4d). Injection of the AAV-GFAP-shmir-Cnr1 in the NAc shell blunted stress resilience and led to a susceptible phenotype comparable to the AAV-GFAP-scramble control virus as measured in the SI test (stress effect, **P = 0.0029) and shown by the high proportion of mice in the SS group after exposure to 10-day CSDS (Fig. 3d and Supplementary Fig. 4e). In parallel to stress-induced changes in NAc shell astrocytes, an increase in Cnr1 expression was noted in stressed mice in neurons of the NAc core independent of the RES or susceptible phenotype (Fig. 1i,j). To evaluate if manipulation of Cnr1 expression in NAc core neurons could affect social behaviors, an AAV downregulating Cnr1 neuronal expression was injected before behavioral assessment at baseline or after CSDS (Fig. 3e,f and Supplementary Fig. 4f). Neuronal Cnr1 reduction in the NAc core did not impact social interactions or anxiety at baseline (Fig. 3g and Supplementary Fig. 4g). After CSDS, SI ratio and proportion of SS mice in the AAV-hSYN-shmir-Cnr1 group were comparable to control AAV-hSYN-scramble-treated animals (Fig. 3h and Supplementary Fig. 4h). These findings support an important role for the elevation of Cnr1 in the NAc shell in astrocytes versus neurons to favor resilience in the context of social stress.
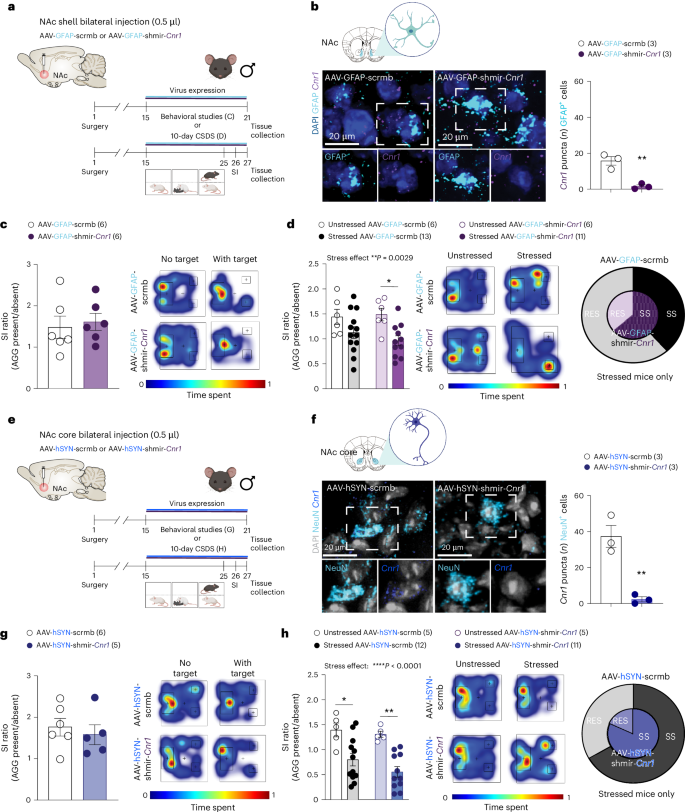
a, Experimental timeline of NAc shell bilateral injection of AAV-GFAP-shmir-Cnr1 or AAV-GFAP-scrmb viruses followed by baseline behavioral assessment or CSDS, then behavioral studies. b, Validation of AAV-GFAP-shmir-Cnr1 or AAV-GFAP-scrmb viruses with RNAscope confirmed downregulation of Cnr1 mRNA levels in AAV-GFAP-shmir-Cnr1-infected astrocytes compared to AAV-GFAP-scrmb-injected male mice. RNAscope representative images of AAV-GFAP-scrmb (left) and AAV-GFAP-shmir-Cnr1 (right) viruses. c, Viral manipulation does not alter baseline social behaviors as measured with the SI test. Individual SI values (left) and representative heatmaps (right) of normalized time spent in the interaction zone during the SI test. d, Bilateral AAV-GFAP-shmir-Cnr1, but not AAV-GFAP-scrmb injection in the NAc shell promotes social deficits induced by CSDS in males as depicted by individual SI test values (left), representative heatmaps (middle) and increased percentage of SS animals (right). e, Experimental timeline of NAc core bilateral injection of AAV-hSYN-shmir-Cnr1 or AAV-hSYN-scrmb viruses followed by behavioral studies. f, Validation of AAV-hSYN-shmir-Cnr1 or AAV-hSYN-scrmb viruses with RNAscope confirmed downregulation of Cnr1 mRNA levels in AAV-hSYN-shmir-Cnr1-infected neurons when compared to AAV-hSYN-scrmb-injected mice. RNAscope representative images of AAV-hSYN-scrmb (left) and AAV-hSYN-shmir-Cnr1 (right) viruses. g, Viral manipulation does not alter baseline social behaviors as measured with the SI test. Individual SI values (left) and representative heatmaps (right) of normalized time spent in the interaction zone during the SI test. h, Bilateral AAV-hSYN-shmir-Cnr1 and AAV-hSYN-scrmb injection in the NAc core promotes social deficits induced by CSDS in males as depicted by individual SI test values (left), representative heatmaps (middle) and increased percentage of SS animals (right). Data represent mean ± s.e.m.; the number of animals or subjects (n) is indicated on graphs. Two-way ANOVA or nonparametric two-way ANOVA on ranks followed by Holm–Šídák’s or Wilcox multiple comparison tests was applied; ****P < 0.0001, **P ≤ 0.01, *P ≤ 0.05. Panels a, b, e and f created using BioRender.com.
Source data
Increased CB1 expression at the BBB interface is associated with resilience in mice
Stress-induced BBB hyperpermeability mediated by loss of tight junction protein Cldn5 allowing passage of deleterious peripheral inflammatory mediators into the NAc is observed in SS, but not RES, males3,4 suggesting that protective neurovascular adaptations are present. Endocannabinoids can modulate BBB permeability in vitro25 and have beneficial effects in the neuroinflammatory context of stroke26 or traumatic brain injury27, including via upregulation of Cldn5 expression. Astrocytic CB1 receptors are well positioned to react to stress-associated alterations in BBB endothelial cells. Thus, we evaluated if Cldn5 loss in the male NAc affects the expression of Cnr1/CB1 in astrocytes using a doxycycline-inducible Cldn5-targeting shRNA (AAV-shRNA-Cldn5)3. We chose this approach because Cldn5-deficient mice die within 10 h of birth28, and it allows downregulation of Cldn5 in a region- and cell-specific manner, with this tight junction being expressed only in endothelial cells29, leading to functional deficits with leakage of circulating dyes or proteins into the brain3,30. Mice were injected in the NAc shell with either the AAV-shRNA-Cldn5 or AAV-shRNA (control) virus (Fig. 4a). Downregulation of Cldn5 expression resulted in a compensatory increase in Cnr1 and astrocytic aquaporin 4 (Aqp4) expression when compared to AAV-shRNA-injected animals (Fig. 4b and Supplementary Fig. 5a). Aqp4 is a water channel involved in BBB transport and astrocyte end-feet polarization13. Coverage of blood vessels by Aqp4+ astrocyte end feet is reduced by 50% in PFC samples from individuals with MDD13, supporting BBB alterations in this mood disorder. Intriguingly, Cnr1 expression is enriched in perivascular astrocytes31. Morphological analysis of confocal microscopy images performed with Imaris software revealed that, in AAV-shRNA-Cldn5-injected mice, high astrocyte Aqp4+ end feet and endothelial CD31+ volume overlap is correlated with elevated levels of perivascular CB1 proteins, suggesting an involvement in the maintenance of BBB integrity (*P = 0.0356; Fig. 4c and Supplementary Fig. 5b).

a, Experimental timeline of NAc bilateral injection of AAV-shRNA-sham or AAV-shRNA-Cldn5. b, Cnr1 expression is increased in animals with BBB impairment induced by AAV-shRNA-Cldn5 injection. c, Bilateral injection with AAV-shRNA-Cldn5 does not alter astrocytic end-feet coverage of NAc shell vessels (left); however, astrocyte end-feet expressing CB1 are more efficient in covering vessels in AAV-shRNA-Cldn5-injected animals (right). Representative images of astrocytic end-feet coverage for AAV-shRNA-sham (top) and AAV-shRNA-Cldn5-injected animals (bottom). d, Experimental timeline of CSDS, SI test and tissue collection. e, Individual SI values. f, Aqp4 gene expression is decreased in SS male mice versus unstressed CTRL and RES animals (left), correlating with Cldn5 stress-induced expression changes (right). g, Schematic representation of astrocytic end feet and endothelial cells. h, SI values for male CSDS. i, Astrocytic coverage of NAc shell vessels is lower after CSDS for SS mice without reaching significance. j, CSDS induces decreased vessel volume in SS mice only. k, RES mice are characterized by the high number of CB1s colocalizing with NAc shell endothelial cells (left), and it correlates with SIs (right). l, Representative images of CB1, Aqp4 and CD31 expression in the NAc shell after CSDS. m, STED representative image of CB1, Aqp4 and Cd31 in the NAc shell of CTRL mice. Representative image intensity was adjusted with a log scale. n, Experimental timeline of NAc shell bilateral injection of AAV-GFAP-shmir-Cnr1 or AAV-GFAP-scrmb viruses followed by CSDS, SI test and tissue collection. o, AAV-GFAP-shmir-Cnr1 decreases Aqp4 volume in unstressed CTRL and stressed mice. p, Representative images of NAc shell eGFP, Aqp4 and CD31 expression after viral manipulation. Data represent mean ± s.e.m.; the number of animals or subjects (n) is indicated on graphs. Two-tailed t-test was applied for two-group analysis and one-way ANOVA followed by Holm–Šídák’s multiple comparison test for three groups; for n < 8, the Kruskal–Wallis test and Dunn’s multiple comparisons were used; for viral manipulations, a two-way ANOVA or nonparametric two-way ANOVA on ranks followed by Holm–Šídák’s or Wilcox multiple comparison test was applied; ****P ≤ 0.0001, ***P ≤ 0.001, **P ≤ 0.01, *P ≤ 0.05. Panels a, d, g and n created using BioRender.com.
Source data
Next, whether perivascular CB1 is linked or not to the RES phenotype following CSDS was evaluated. Exposure to 10-day CSDS decreased Aqp4 in the NAc of SS but not RES males (Fig. 4d–f and Supplementary Fig. 5c,d). Notably, a correlation between Cldn5 and Aqp4 expression was noted in the male NAc following CSDS (***P = 0.0001; Fig. 4f). Decreased Aqp4 was reported in the cortex and hippocampus of rodents exposed to chronic unpredictable stress32 or inflammation33. Here we also observe a similar effect of CSDS in the NAc. Aqp4+ and endothelial CD31+ volume overlap is reduced in the SS group when compared to unstressed CTRL and RES mice without reaching significance (Fig. 4g–i and Supplementary Fig. 5e). However, a decrease in vasculature volume, as measured with endothelial CD31 immunostaining, was noted in SS animals (Fig. 4j), while in the NAc of RES mice, CB1/CD31 colocalization was increased when compared to both SS and unstressed CTRL groups and correlated with the level of SIs (**P = 0.0012; Fig. 4k,l). This observation was confirmed using super-resolution microscopy (Fig. 4m and Supplementary Fig. 5f). Downregulation of astrocytic Cnr1 in the mouse NAc shell led to a decrease of Aqp4 protein expression (virus effect, **P = 0.01; Fig. 4n–p), but not of CD31 volume (Supplementary Fig. 5g,h). Altogether, these results suggest that astrocytic Cnr1 in the NAc dampens stress-induced neurovascular alterations, thereby promoting resilience to stress.
NAc astrocytic endocannabinoidome is modulated by stress exposure and inflammation in mice
To gain mechanistic insights about the beneficial effects of stress-induced increase in astrocytic Cnr1 on the BBB, transcriptome-wide gene expression profiling of NAc astrocytes overexpressing Cnr1 was performed. Male mice were injected with either the AAV-GFAP-Cnr1 or control AAV-GFAP-sham virus, subjected to CSDS, SI phenotyping, and NAc punches were collected 24 h later to isolate AAV-transduced green fluorescent protein-positive (GFP+) astrocytes with fluorescence-activated cell sorting (FACS; Fig. 5a,b and Supplementary Fig. 6a,b). RNA was extracted from NAc astrocytes of virus-injected unstressed CTRL, SS and RES males, and then transcriptome profiling was conducted with the mouse Illumina NovaSeq assay. Venn diagrams of differentially expressed genes (DEGs) indicate an overlap of gene expression profiles between NAc astrocytes of CTRL and RES mice injected with the control virus (Fig. 5c). In contrast, viral-mediated upregulation of astrocytic Cnr1 expression creates a different profile when compared to unstressed CTRL mice injected with the same virus (Fig. 5d). Gene ontology analysis of those DEGs highlighted vascular-related adaptations with increased expression of genes linked to BBB regulation, notably Wnt signaling, crucial for endothelium integrity maintenance34 and vascular smooth muscle proliferation (Fig. 5e). A shift toward a transcriptomic RES profile is observed in all stressed mice injected with the AAV-GFAP-Cnr1 virus (Fig. 5d,f) with remaining genes differentially expressed associated with pro-inflammatory response and vasoconstriction and mostly increased in SS animals (Fig. 5g,h). Comparison of DEG between RES mice of AAV-GFAP-Cnr1 and AAV-GFAP-sham-injected groups confirmed high similarity between astrocyte transcriptomes (Fig. 5i). These molecular findings indicate that Cnr1 upregulation in the NAc astrocytes contributes to mitigate stress-induced BBB alterations by promoting vascular compensatory changes and lowering inflammation in RES animals.

a, To assess NAc shell astrocyte-specific changes induced by chronic stress and Cnr1 overexpression, AAV-transduced astrocytes were isolated using FACS. Experimental timeline of NAc shell bilateral injection of AAV-GFAP-Cnr1 or AAV-GFAP-sham viruses staggered over a 7-day period, followed by sequential CSDS and FACS isolation of GFP+ astrocytes. b, FACS strategy for purification of AAV-transduced GFP+ astrocytes. c, Venn diagram indicates an overlap of astrocytic gene expression changes between CTRL and RES groups of animals injected with AAV-GFAP-sham. d, Venn diagrams indicate poor overlap of astrocytic gene expression changes between CTRL and RES groups of animals injected with AAV-GFAP-Cnr1. e, Significant biological pathways differently regulated between CTRL and RES groups of animals injected with AAV-GFAP-Cnr1. f, Hierarchical clustering heatmap of CTRL versus RES mice and biological pathways, including the genes regulating vascular function upregulated (red) or downregulated (blue) in the NAc astrocytes transduced with AAV-GFAP-Cnr1. g, Significant biological pathways differently regulated between RES and SS groups of animals injected with AAV-GFAP-Cnr1. h, Hierarchical clustering heatmap including the genes regulating immune response upregulated (red) in SS versus RES in the NAc astrocytes transduced with AAV-GFAP-Cnr1. i, Venn diagrams indicate high similarity of RES mice of AAV-GFAP-Cnr1 and AAV-GFAP-sham-injected groups. Panel a created using BioRender.com.
Source data
Stress-induced alterations in CB1-related signaling modulate neuronal synaptic plasticity in the NAc, leading to behavioral adaptations10,35, but the contribution of astrocytic CB1-related signaling is undetermined. Acting on CB1 with different affinities are two main endocannabinoids—2-arachidonoylglycerol (2-AG) and N-arachidonoyl-ethanolamine, or anandamide (AEA)36 (Fig. 6a). Basal brain levels of 2-AG are ~100–200-fold higher than those of AEA. Male mice were subjected to CSDS, then the NAc was dissected and 2-AG and AEA levels were assessed using high-pressure liquid chromatography with tandem mass spectrometry (HPLC–MS/MS; Fig. 6b,c and Supplementary Fig. 6c). While no difference was noted for AEA (Supplementary Fig. 6d), whole tissue 2-AG levels were reduced with resilience (*P = 0.0307) and negatively correlated with SIs (*P = 0.0336; Fig. 6d), thus behaving oppositely to Cnr1 (Fig. 1c). We reasoned that these effects were not necessarily a reflection of the capability of NAc astrocytes to produce endocannabinoids, whose concentrations and subsequent activation of astrocytic CB1 receptors depend not only on neurons but also on these glial cells37. Mice were thus subjected to CSDS and phenotyped, and then NAc punches were collected and pooled from two mice with comparable SI 24 h later and astrocytes were purified for HPLC–MS/MS via magnetic-activated cell sorting (MACS) with anti-astrocyte cell surface antigen-2 (Acsa2) + microbeads (Supplementary Fig. 6e–h). Enrichment of astrocyte-specific genes was confirmed by qPCR (Supplementary Fig. 6f). 2-AG and AEA levels were elevated in NAc astrocytes of RES mice, with a correlation noted between AEA and SIs (**P = 0.0097; Supplementary Fig. 6i,j). AEA biosynthesis primarily relies on N‐acyl-phosphatidyl-ethanolamine (NAPE)‐specific phospholipase D‐like hydrolase (NAPE‐PLD), whereas fatty acid amide hydrolase (FAAH) is the main enzyme responsible for AEA hydrolysis36. As for 2-AG, diacylglycerol lipase α (DAGLα) is the primary enzyme synthesizing it in both neurons and astrocytes, and it is primarily hydrolyzed by monoacylglycerol lipase (MAGL)36 (Fig. 6a). CSDS increased NAc expression of Dagla (**P = 0.0018) and Napepld (**P = 0.0095; Supplementary Fig. 7a), in agreement with the HPLC–MS/MS results in astrocytes. In purified astrocytes, CSDS tended to upregulate not only Dagla but also Mgll, while decreasing Napepld (Supplementary Fig. 7b–d). We next investigated if these changes are connected with inflammatory responses underlying changes in the BBB, and, due to technical limitations to characterize endocannabinoid signaling in a cell- and region-specific manner with sufficient power samples for individual animals, we complemented the above in vivo studies with in vitro experiments.

a, Schematic representation of endocannabinoid main enzymes responsible for their synthesis and degradation. AEA is mainly synthesized by NAPE-PLD and metabolized by FAAH. 2-AG is generated by selective enzymes, including DAGLα, and is metabolized by both FAAH and MAGL. b, Experimental timeline of CSDS, SI test and tissue collection. c, Individual SI values following CSDS. d, CSDS decreases NAc 2-AG levels in RES but not in SS males (left). 2-AG levels negatively correlate with SI levels (right). e, In vitro experimental scheme for mouse primary cultured astrocytes treated with pro-inflammatory IL-6 (100 ng μl−1). Acute treatment with IL-6 drives pro-inflammatory response in astrocytes, increasing endocannabinoid gene transcription at 3 h and 6 h time points (n = 3 for all groups). f, Chronic (7 days) but not acute (24 h) treatment with IL-6 results in a decreased volume of GFAP + astrocytes (left). Both acute and chronic treatment led to decreased astrocyte morphology complexity (right). Representative images of astrocytes expressing GFAP untreated (left) and acutely (middle) or chronically (right) treated with IL-6 (100 ng μl−1). UNT, untreated. g, Infection of cultured astrocytes with AAV-GFAP-Cnr1 but not AAV-GFAP-sham decreases pro-inflammatory response at the 6 h time point. h, IL-6 treatment increases expression of Cnr1 gene in AAV-infected astrocytes (n = 3 for all groups). i, Acute IL-6 treatment leads to a loss in Aqp4 and GFAP volume, which is prevented by AAV-GFAP-Cnr1 infection. Representative images of astrocytes treated with IL-6 (100 ng μl−1) or viruses modulating Cnr1 expression and stained for GFAP, Aqp4, eGFP or DAPI. Data represent mean ± s.e.m.; the number of animals or subjects (n) is indicated on graphs. For one-factor analysis, one-way ANOVA followed by Holm–Šídák’s multiple comparison test was applied. For n lower than 8, the Kruskal–Wallis test followed by Dunn’s multiple comparisons evaluation was used. For two-group analysis, two-tailed t-test was applied. For analysis with two factors, two-way ANOVA followed by Holm–Šídák’s multiple comparison test was used; correlations were evaluated with Pearson’s correlation coefficient; ****P < 0.0001, ***P ≤ 0.001, **P ≤ 0.01, *P ≤ 0.05. Panels b, e and g created using BioRender.com.
Source data
Reduced BBB integrity in the NAc of SS but not RES mice is associated with depression-like behaviors but also passage of peripheral interleukin-6 (IL-6)3. This pro-inflammatory cytokine is linked to stress-related disorders and is elevated in the blood of individuals with MDD, particularly those resistant to treatment38. Perivascular astrocytic CB1 receptors are well positioned to sense and react to circulating inflammation possibly contributing to neurovascular adaptations leading to vulnerability versus resilience. Moreover, IL-6 expression was upregulated in NAc astrocytes in SS mice (Supplementary Fig. 7c). To evaluate if CB1-dependent endocannabinoid signaling is altered by IL-6 in this cell population, mouse astrocytes were isolated and cultured in vitro (Fig. 6e and Supplementary Fig. 7e,f). Acute treatment with IL-6 (100 ng μl−1) increased astrocytic IL-6 (3 h, **P = 0.0092; 6 h, ****P < 0.0001) and Cnr1 (3 h, *P = 0.0173; 6 h, ***P = 0.0008). Conversely, Napepld decreased at these points (3 h, **P = 0.0039; 6 h, *P = 0.0361) with higher Mgll expression observed only after 6 h (*P = 0.0123; Fig. 6e and Supplementary Fig. 7g). This is in line with the changes observed in astrocytes from CSDS mice (Supplementary Fig. 6), indicating IL-6, and its dampening of astrocyte endocannabinoid biosynthesis, as a potential mechanism through which CSDS induces stress susceptibility. Notably, alterations were absent after 24 h, highlighting the dynamic relationship between the ECS and IL-6. Considering the chronic nature of our stress paradigm, cultured astrocytes were next treated for a longer period. Exposure to IL-6 (100 ng μl−1) for 7 days promoted morphological changes with a loss in GFAP volume (***P = 0.0005; Fig. 6f). Treatment with IL-6 for 24 h was already sufficient to reduce astrocyte primary processes (**P = 0.0083; Fig. 6f), which could be linked to the loss of astrocyte end-feet coverage reported in MDD13. Because overexpression of astrocytic Cnr1 prevented stress-induced anxiety- and depression-like behaviors (Fig. 2) and dampened astrocyte inflammatory response (Fig. 5), we tested if it could dampen IL-6-associated morphological changes. Astrocytes were transfected with either the AAV-GFAP-sham or AAV-GFAP-Cnr1 virus before treatment with IL-6 (Fig. 6g). High astrocytic Cnr1 expression reduced IL-6-driven increase in IL-6 (virus × treatment effect, *P = 0.0480) and Cnr1 (virus × treatment effect, ****P < 0.0001; Fig. 6h and Supplementary Fig. 7h). It also prevented IL-6-driven Aqp4 internalization and loss of Aqp4 volume (virus × treatment effect, ****P < 0.0001; Fig. 6i), providing a mechanistic link between Cnr1 expression in astrocytes, stress-induced inflammation, BBB alterations and behavioral responses.

a, In vitro experimental scheme for mouse primary cultured astrocytes treated with pro-inflammatory IL-6 (100 ng μl−1) together with 2-AG (IL-6; 100 μg μl−1) for 3 h. b, Schematic representation of 2-AG enzymes responsible for its degradation to pro-inflammatory and vasoactive compounds. One of the two products of 2-AG metabolism by MAGL is AA, further converted by Cox-2 to prostaglandins, involved in the inflammatory response. c, HPLC–MS/MS analysis of astrocytic endocannabinoidome revealed an increase in 2-AG release, a decrease in AA levels and increased production of pro-inflammatory PGE2 after IL-6 and 2-AG cotreatment. d, Significant biological pathways differently regulated by IL-6 treatment revealed pro-inflammatory response. Adj, adjusted. e, Significant biological pathways differently regulated by 2-AG provide a link with vascular mechanisms. f, Hierarchical clustering heatmap including the genes regulating immune response upregulated (red) in IL-6 group. g, Hierarchical clustering heatmap of 2-AG condition and biological pathways including the genes regulating vascular function upregulated (red). h–k, Astrocytes treated with both IL-6 and 2-AG exhibit blunted inflammatory response (h,i), with 2-AG inducing vascular adaptations (j,k). Data represent mean ± s.e.m.; the number of replicates (n) is indicated on graphs; ****P < 0.0001, ***P ≤ 0.001, **P ≤ 0.01, *P ≤ 0.05. Panel a created using BioRender.com.
Source data
In vitro data suggest that astrocytic endocannabinoids and CB1 receptors tonically inhibit CSDS-induced stress in a manner opposed to IL-6, associated with stress susceptibility in mice and MDD in humans38,39. Blocking 2-AG hydrolysis by MAGL in the striatum produces anti-inflammatory and antidepressive effects10,40. Similarly, inhibition of the downstream enzyme cyclooxygenase-2 (COX-2), a key regulator of the inflammatory cascade, exerts anti-inflammatory effects and rescues depressive-like behaviors41. COX-2 converts arachidonic acid (AA) into bioactive prostanoids, including prostaglandin E2 (PGE2), which can induce vascular inflammation and alter BBB integrity42. In the brain, 2-AG hydrolysis by MAGL can act as a source of AA for neuroinflammatory prostaglandin biosynthesis40. Therefore, to identify vascular and inflammatory mechanisms induced by IL-6 and regulated by astrocytic CB1-dependent endocannabinoid signaling, cultured mouse astrocytes were cotreated with IL-6 and 2-AG for 3 h followed by HPLC–MS/MS analysis of released compounds in cell media (Fig. 7a,b and Supplementary Fig. 7i,j). Cotreatment led to an increase in astrocytic 2-AG release (IL-6 × 2-AG treatment effect, **P = 0.0013) and a decrease in AA levels (IL-6 × 2-AG treatment effect, **P = 0.0049), converted into its vasoactive and pro-inflammatory metabolite, PGE2 (IL-6 × 2-AG treatment effect, *P = 0.0146; Fig. 7c). This is in line with increased expression of COX-2 (Ptgs2) and its metabolites in IL-6 and 2-AG cotreated astrocytes (Supplementary Fig. 7k,l) and suggests IL-6 might simultaneously counteract astrocytic endocannabinoid biosynthesis and facilitate 2-AG conversion to AA and, subsequently, PGE2, thus enhancing inflammation. Transcriptome-wide gene expression profiling was next performed with Illumina NovaSeq on astrocytes treated with either IL-6, 2-AG or both. As expected, IL-6 treatment alone provoked a strong inflammatory response in cultured astrocytes with DEGs linked to regulation of cell activation, response to lipopolysaccharide and cytokine-mediated signaling (Fig. 7d,e). Conversely, 2-AG treatment modulated the expression of genes linked to blood vessel development, morphogenesis and response to hormones (Fig. 7f,g). IL-6-induced inflammatory response was blunted but not entirely rescued by concomitant 2-AG treatment (Fig. 7h,i); nevertheless, exposure to 2-AG again led to molecular changes in astrocytes associated with the brain vasculature (Fig. 7j,k). These findings shed light on astrocytic 2-AG as a regulator of neurovascular adaptations in the context of inflammation and suggest that IL-6 counteracts such function by facilitating 2-AG conversion to pro-inflammatory prostaglandins.
High Cnr1 expression in NAc astrocytes underlies physical exercise and antidepressant benefits
Prevention and treatment of stress-related disorders remain a challenge. Physical exercise is associated with stress resilience43 and neurovascular health44; however, the biology underlying beneficial effects in the brain reward system is incompletely understood. Exercise activates the ECS, as measured by high levels of endocannabinoids in the plasma45, also in relation to stress and depression46, leading us to hypothesize that it may influence the BBB via perivascular astrocytic CB1. Male mice were exposed to CSDS but with access to a running wheel (Fig. 8a). The impact of stress exposure was still present with 50% RES versus 50% SS animals (Fig. 8b). However, decreased time spent in the interaction zone during the SI test remained significant only for mice without access to voluntary exercise (stress effect, ***P = 0.0009; PE effect, **P = 0.0037; Fig. 8c and Supplementary Fig. 8a). Total running distance was similar between groups, although RES mice spent more time running during daytime (***P = 0.0009), mainly in the hour immediately following social defeat, possibly a stress coping strategy (Fig. 8d and Supplementary Fig. 8b,c). High daytime running was correlated with elevated Cnr1 expression in the NAc (*P = 0.0026; Fig. 8e). To confirm cell specificity, RNAscope was combined with immunofluorescence to identify endothelial cells (CD31) and astrocyte end feet (Aqp4). Colocalization of Cnr1+ dots on vasculature was more frequent in RES animals (Fig. 8f). Endocannabinoid release during sustained physical exercise has antidepressant effects and reduces neuronal inflammation46,47. Our findings indicate that modulating astrocyte 2-AG promotes vascular adaptations in the context of inflammation (Fig. 7). To evaluate if physical exercise affects NAc astrocyte 2-AG and AEA levels, male mice were subjected to CSDS with access to running wheels, phenotyped with SI, astrocytes purified and analyzed with HPLC–MS/MS (Fig. 8g,h and Supplementary Fig. 8d,e). No difference was noted for 2-AG (Fig. 8i) or AEA (Supplementary Fig. 8f) levels. This might be due to the 48-h delay between the last session of physical exercise and sample analysis (versus 10 min in human studies47), necessary to respect the usual timeline of tissue collection after behavioral phenotyping. Thus, to confirm the involvement of increased astrocytic Cnr1 in the beneficial effects of physical exercise, mice were injected with the AAV-GFAP-shmir-Cnr1 or AAV-GFAP-scramble control virus and then subjected to CSDS while having access to running wheels (Fig. 8j and Supplementary Fig. 8g–i). Downregulation of Cnr1 in astrocytes of the NAc shell abolished exercise-induced resilience with a low SI ratio (stress effect, **P = 0.0059) and time spent in the interaction zone (stress effect, ***P = 0.0005; Fig. 8k and Supplementary Fig. 8g,h). Our results indicate that physical exercise could modulate BBB properties via astrocytic perivascular Cnr1 upregulation, thus promoting stress resilience.

a, Experimental timeline of CSDS with physical exercise, SI and tissue collection. b, Individual SI values after CSDS. c, Physical exercise prevents the development of social deficits following CSDS. d, RES animals are characterized by increased daytime running, suggesting a coping strategy when facing CSDS exposure. e, Increased transcription of Cnr1 is observed in RES animals (left) and correlates with the level of physical exercise during daytime (right). f, Representative RNAscope and immunofluorescence images exhibiting increased Cnr1 expression at the BBB (CD31 as endothelial cell marker) in the RES phenotype. g, To assess astrocyte-specific endocannabinoid changes induced by chronic stress in the NAc, astrocytes were isolated using MACS. h, Individual SI values. i, 2-AG level in NAc astrocytes is unchanged. j, Experimental timeline of NAc shell bilateral injection of AAV-GFAP-shmir-Cnr1 or AAV-GFAP-scrmb viruses followed by CSDS with physical exercise and behavioral studies. k, Individual SI values (left), time in the interaction zone (right) and representative heatmaps (bottom). l, Experimental timeline of CSDS followed by an SI test to establish phenotype before antidepressant treatment. A second SI test was performed 24 h before tissue collection. m, Individual SI values (left) and comparison for treatment responders versus nonresponders (right) with representative heatmaps for these cohorts (top). n, Cnr1 mRNA is increased in the NAc of treatment responders only (left), and it correlates with Aqp4 expression (right). o, A loss in AQP4+ cells expressing CNR1 is noted in men with MDD. This alteration was not observed for individuals undergoing treatment. p, Representative RNAscope images. Data represent mean ± s.e.m.; the number of animals or subjects (n) is indicated on graphs. One-way ANOVA or Brown–Forsythe ANOVA test followed by Holm–Šídák’s or Dunnett’s multiple comparison test was applied. Two-way ANOVA or nonparametric two-way ANOVA on ranks followed by Holm–Šídák’s or Wilcox multiple comparison test was applied; for n < 8, the Kruskal–Wallis test followed by Dunn’s multiple comparisons was used; correlations were evaluated with Pearson’s correlation coefficient; ****P < 0.0001, ***P ≤ 0.001, **P ≤ 0.01, *P ≤ 0.05. Panels a, f, g, i, j and l created using BioRender.com.
Source data
Antidepressants are recommended for moderate to severe depression. However, 30–50% of individuals with MDD are not responsive to classical drugs, reflecting that causal mechanisms, such as elevated circulating inflammation38 or vascular dysfunction7, remain untreated. To better understand the biology behind treatment response versus resistance and possible involvement of astrocytic CB1, male mice were subjected to CSDS, and then CTRL and SS animals were treated intraperitoneally (i.p.) for 2–3 weeks with either imipramine or fluoxetine, a tricyclic antidepressant and selective serotonin reuptake inhibitor, respectively (Fig. 8l). Imipramine reverses transcriptional changes associated with stress susceptibility induced by CSDS, including in the NAc48, while fluoxetine acts on astrocyte morphology and plasticity49. The second SI test performed after treatment revealed a positive impact of treatment on social interactions (stress × treatment effect, *P = 0.048; Fig. 8m and Supplementary Fig. 9). Further analysis highlighted two groups of SS-treated mice—responders and nonresponders—when SI test performance was compared for each individual. Cnr1 expression was increased in the NAc of responders only (***P = 0.001), and this elevation correlated with a higher level of Aqp4, indicating astrocyte involvement (**P = 0.0011; Fig. 8n). Finally, we assessed astrocytic CNR1 expression in postmortem NAc tissue from male donors using RNAscope, confirming a loss of CNR1+ astrocytes (AQP4+) in the MDD brain (*P = 0.0107). Conversely, antidepressant treatment was associated with a level of astrocytic CNR1 similar to CTRL (Fig. 8o,p).
Discussion
CB1 signaling promotes adaptations following social stress10,23. Striatal CB1 activation in neurons reduces CSDS-induced anxiety10, while treatment with a CB1 agonist attenuates stress-induced neuroinflammation and anxiety-like behavior50. Thus, CB1 receptors may facilitate resilience factor activation during and/or after stress9,51. Astroglial mitochondria and glucose metabolism were recently implicated in endocannabinoid-related regulation of social behaviors15. Perivascular astrocytic CB1 receptors are understudied17, and their role in regulating stress response has not been investigated. Here we show stress resilience is linked to increases in astrocytic Cnr1 expression in the NAc shell, a subregion controlling reward-seeking behavior20. We localized these changes at the BBB interface by taking advantage of super-resolution microscopy. Although challenging to explore in a cell- and subregion-specific manner, future studies should consider that BBB disruption triggers mitochondrial remodeling in astrocytic end feet52. Astrocytes are essential for BBB recovery after brain injury53. They maintain BBB integrity by regulating tight junction formation54 and may directly prevent stress-induced loss of Cldn5.
Additionally, we show astrocytic Cnr1 upregulation in the NAc shell dampens inflammation and stress-associated neurovascular alterations promoting resilience. We bypassed limitations of CB1 antibodies specificity55, by developing astrocyte-specific AAVs driving Cnr1 expression within astrocytes, whereas previous Cnr1 manipulations targeted neuronal populations56. CB1 receptors regulate anxiety, with Cnr1−/− animals exhibiting anxiolytic drug resistance and increased anxiety-like behavior57. We found that Cnr1 overexpression in astrocytes of the NAc shell produced baseline anxiolytic effects. Mice lacking Cnr1 display reduced social interactions24, which are linked with NAc shell function58. We expand these findings by highlighting a protective role for astrocytic CB1 in the context of social stress with reduced avoidance, anxiety and helplessness.
CB1 and related signaling lipids are essential for stress adaptations9. 2-AG signaling within the NAc regulates inflammation, anxiety and stress vulnerability10,35. Here as it would be expected if this mediator had a tonic protective role against stress via CB1, 2-AG levels were decreased by CSDS in NAc punches, including all cell types. However, contrary to Cnr1 expression, a negative correlation between 2-AG levels and social behaviors was also observed. This counterintuitive finding encouraged cell-specific analysis, which showed that (1) the expression of 2-AG anabolic enzyme tended to increase in NAc astrocytes of RES mice, and (2) in these astrocytes, CSDS upregulates 2-AG, its biosynthetic enzyme and MAGL, which drives 2-AG hydrolysis to AA, precursor to neuroinflammatory prostaglandins negatively affecting BBB integrity37. Stress-induced alterations in endocannabinoid levels are transient due to rapid turnover59, and our findings indicate that astrocytic Cnr1 and Mgll are both enhanced not only by CSDS but also, in vitro, by an inflammatory challenge after only a few hours. Future studies should evaluate endocannabinoid signaling dynamics at different time points in mice, ideally in a cell-specific manner, following stress. Our data suggest that astrocyte 2-AG metabolism mediates the astrocytic response to inflammatory mediators, like IL-6 (ref. 60), regulating BBB properties, stress responses and depression. Conversely, viral-mediated Cnr1 overexpression in astrocytes reduced IL-6-driven inflammatory changes and morphological impairments, including loss of end-feet-related Aqp4, associated with depression13,33. AEA can trigger an anti-inflammatory response in astrocytes in vitro via CB1 (ref. 14). We observed that social stress-induced decrease in AEA levels is not occurring in NAc astrocytes of RES mice, providing another endocannabinoid-related mechanism to explore.
Circulating inflammation is elevated in stressed animals and subpopulations of individuals with MDD, particularly those resistant to treatments38,39. Here we chose an IL-6-driven inflammatory challenge with this cytokine elevated in mice exposed to social stress, MDD3,39, and required for the adaptive fight or flight responses61. It does not completely reflect the complexity of stress-induced neuroinflammation, and additional studies are necessary for a complete picture. Astrocyte end feet are perfectly positioned to sense circulating inflammation and react to it, particularly in the context of BBB breakdown and loss of tight junctions7 as observed following CSDS and in the MDD brain.
Altogether, our findings support an active role of the BBB, via astrocyte end feet, in stress resilience. Our results complement evidence suggesting stress affects the neurovasculature in a sex-specific manner3,4,5, which may contribute to sex differences in MDD prevalence, symptomatology and treatment response62. Cnr1 upregulation was observed in the PFC but not NAc of female mice (Supplementary Fig. 10), highlighting the importance of studying sex differences in the context of stress-related disorders. Polymorphisms of the endocannabinoid receptor genes (CNR1 and CNR2) have been associated with MDD63 and could influence vulnerability to psychosocial adversity64. Antiobesity treatment with CB1 antagonist rimonabant increases the risk of anxiety and mood disorders65. In rodent models of depression, treatment with the antidepressants imipramine or fluoxetine alters striatal CB1 receptor density66 and expression in neuronal cells67. In parallel, voluntary exercise enhances CB1 sensitivity in the striatum68. Here we observed that both interventions increased expression of perivascular Cnr1.
To summarize, we propose that perivascular Cnr1 has an important role in modulating stress responses in mice and possibly MDD. Identification of beneficial endocannabinoid-related adaptations within the BBB can represent a promising approach to developing innovative therapies for mood disorders.
Methods
Animals
Experimental animals were naive male (~24 g) and female (~20 g) C57BL/6 mice, acquired at 6–7 weeks of age from Charles River Laboratories. Upon arrival, animals were allowed to rest for 1 week of acclimation, group housed in 27 × 21 × 14 cm polypropylene individually ventilated cages with enriched bedding, at the housing facility of CERVO Brain Research Center, before any procedures. Sexually experienced retired CD-1 male breeders (∼40 g), 9–12 months of age, were used as aggressors (AGGs) in the CSDS paradigm (Charles River Laboratories). All mice were maintained on a 12-h light/12-h dark cycle (lights on from 07:00 AM to 7:00 PM) with temperature (22 °C) and humidity (63%) kept with constant and free access to water and food (Teklad Irradiated Laboratory Animal Diet). All experimental procedures were approved by the animal care and use committee of Université Laval (2022-1061) and met the guidelines set out by the Canadian Council on Animal Care.
CSDS
For males, the CSDS protocol was performed as described previously18. Briefly, before the experiment, CD-1 mice were screened for aggressive behaviors against nonexperimental C57BL/6 mice for 3 consecutive days. Selected CD-1s were then housed 48 h before the first defeat session on one side of a clear perforated Plexiglas divider (0.6 cm × 45.7 cm × 15.2 cm) in social defeat cages (26.7 cm width × 48.3 cm depth × 15.2 cm height; Allentown). During the protocol, experimental C57BL/6 mice were repeatedly subordinated by an AGG CD-1 mouse for daily bouts of social stress lasting up to 5 min over 10 consecutive days. During physical interaction, mice were monitored for aggressive interactions and mounting behaviors. A session was immediately stopped if persistent mounting or fighting causing physical wounding occurred. After each physical bout, the experimental mouse was removed and housed on the opposite side of the social defeat cage divider to allow overnight sensory interactions. C57BL/6 mice were rotated each day to be exposed to a new, unfamiliar AGG for each physical interaction session. Unstressed CTRL mice (CTRL) were housed in the same room as experimental mice, two per social defeat cage, one on each side of the Plexiglas and rotated daily in a similar manner without ever being exposed to a CD-1 AGG mouse. After the last day of social defeat, the experimental mice were single housed for 24 h before conducting the SI test. At the time of tissue collection, 24 h after the SI test, physical wounding of experimental mice was scored. The number of tail bites together with the surface area (cm2) of belly, upper and lower back lacerations were evaluated. Physical wounding did not correlate with SI test results.
For females, the CSDS procedure is supplemented with CD-1 urine69. CD-1 mice urine was collected during the dark phase of the light–dark cycle with animals placed in metabolic cages overnight (Life Science Equipment). Urine was collected the following morning, filtered, aliquoted in 0.5 ml tubes and stored at −80 °C until use. To induce dominant behavior from the AGG mouse, before each defeat, CD-1 urine was applied to the base of the tail (20 μl), vaginal orifice (20 μl) and upper back (20 μl) of the female mouse. Immediately after application, female experimental mice were subjected to physical interactions with an unfamiliar CD-1 AGG for 10 min.
SI test
Following CSDS, mice are characterized for vulnerability to stress by evaluating their social avoidance behaviors3,4,5. First, to determine baseline exploratory behavior and locomotion, mice were placed in a Plexiglas OF arena (42 cm × 42 cm × 42 cm; Nationwide Plastics) with a small wire animal cage at one end. Experimental mice movements were monitored and recorded automatically under red-light conditions in the absence of a social target (AGG) for 2.5 min with a tracking system (AnyMaze 6.1 and 7.02; Stoelting). Next, the mouse was removed, and the arena was cleaned. In the second trial, exploratory behavior in the presence of a new CD-1 social target inside the small wire animal cage was evaluated for 2.5 min, and time spent in the interaction/corner zones and overall locomotion was compared. The SI ratio was calculated by dividing the time spent in the interaction zone when the CD-1 AGG was present by the time spent when it was absent. All mice with an SI ratio below 1.0 were classified as stress-susceptible, and all mice with an SI ratio above 1.0 were classified as RES. Representative heatmaps were produced with Ethovision software (v17).
ST
ST was used to evaluate motivated grooming behavior4,5,70. Mice were habituated to the room for 1 h before testing under red-light conditions. A 10% sucrose solution was sprayed three times on the lower back of the mice and then placed into an empty housing cage. Time to start grooming, as well as total grooming behavior, was videotaped for 5 min and then recorded with a stopwatch by a blinded observer.
SPT
Anhedonic behavior was evaluated with standard SPT4,5,71. Briefly, individually housed mice were habituated to two 50 ml conical tubes with sipper tops filled with water for 24 h prior. Next day, water from one of the 50 ml conical tubes was replaced with a 1% sucrose solution, and all tubes were weighed. Mice were allowed to drink ad libitum for a 24-h period. The next day, to prevent place preference, tubes were weighted and switched for another 24 h of ad libitum drinking. At the end of the 48 h testing period, sucrose preference was determined by calculating the percentage of total sucrose consumption divided by total liquid consumption (sucrose + water) over the 2 days of sucrose availability.
EPM
Anxiety-like behaviors were evaluated with the EPM. Following 1-h habituation, mice were placed in a black Plexiglas cross-shaped EPM (arms of 12 cm width × 50 cm length) under red-light conditions for 5 min, and behaviors were monitored and tracked using an automated system (AnyMaze 6.1 and 7.02; Stoelting). The maze supports two sets of arms (open—without walls and closed arms with 40-cm high wall) 1 m above floor level. Cumulative time spent in open arms and closed arms as well as total locomotion were compared between groups.
OF
OF was used to supplement the anxiolytic effects evaluation. Following 1 h habituation under white light conditions, mice were placed in a white Plexiglas OF arena (42 cm × 42 cm × 42 cm; Nationwide Plastics) for 10 min. Behavior was monitored and tracked using an automated system (AnyMaze 6.1 and 7.02; Stoelting) in the center of the arena (10 cm × 10 cm), an adjacent 20 cm × 20 cm area defined as the middle with the remaining zone along the walls defined as the periphery. Cumulative time spent in each area was compared between groups.
FST
To evaluate helplessness, FST was used3. Mice were habituated to the room for 1-h before testing under white light conditions. Mice were then placed into a 4 l glass beaker containing 3 l of water at 25 °C and videotaped for 6 min. Behavior was hand-scored using a 5-s sampling method for the amount of time spent immobile (defined as no movement at all or only minor movements necessary to keep the nose above the water) by an observer blind to experimental conditions.
TST
To gain more insight into depression-like behavior, TST was applied72. Mice were habituated to the room for 1 h before testing under red-light conditions. Next, animals were suspended by the tail 1–2 mm from the tail base, to avoid injury, for 6 min, and their behavior was videotaped. Like TST, time spent immobile (defined as no movement at all) was evaluated by an observer blind to experimental conditions.
Chronic variable stress (CVS)
CVS protocol was modified from the method described in ref. 73. For the duration of 28 days, experimental mice were exposed to three alternating stressors (restraint stress, tail suspension and foot shocks) for 1 h per day. Stressors were 100 mild foot shocks at 0.45 mA delivered at random intervals (ten mice per chamber), a tail suspension stress and restraint stress, with animals placed inside of a perforated 50 ml Falcon tube in their home cage. NAc and PFC tissue punches were collected 24 h after the last stressor.
Voluntary wheel running
Wheel running was performed in standard CSDS cages supplemented with battery-powered, wireless running wheels (Med Associates)43. Mice were habituated upon arrival to the animal facility in groups with the running wheel for 5 days before the onset of stress. CSDS was conducted as described above with the exception that mice had free access to the running wheel on their side of the cage divider throughout the stress protocol. Mice retained the same wheel throughout all cage rotations. Running distance was quantified from wheel revolutions measured at 1-minute intervals through the CSDS paradigm using Wheel Manager software (Med Associates).
Antidepressant treatment
Following the SI test, unstressed CTRL and SS mice were randomly divided into either vehicle or antidepressant treatment groups. Each mouse received daily i.p. injections of vehicle, imipramine (20 mg kg−1 of body weight) for 14 days or fluoxetine (10 mg kg−1) for 21 days48,49,74. All mice were screened again for social avoidance before tissue collection. Mice were then killed 48 h after the last injection and bilateral 14-gauge NAc and PFC tissue punches were collected from 1-mm-thick coronal slices for quantitative PCR.
Transcriptional profiling by qPCR
Samples from NAc and PFC were collected and processed as described previously3,4,5. Briefly, following rapid decapitation, bilateral 2.0 mm NAc or 1.2 mm PFC punches were collected using the Harris Uni-Core tool from 1-mm coronal slices on wet ice, immediately placed on dry ice and stored at −80 °C until use. Cultured astrocytes in a six-well plate were lysed with TRIzol and transferred to a sterile Eppendorf for phase separation. To isolate RNA from brain punches and cultured cells, TRIzol (Invitrogen) homogenization and chloroform layer separation were used, followed by processing with the Pure Link RNA Kit (Life Technologies). The concentration and purity of RNA was determined with NanoDrop (Thermo Fisher Scientific). A total of 500 ng of RNA was reverse transcribed to cDNA with the Maxima-H-minus cDNA Synthesis Kit (Thermo Fisher Scientific). For each qPCR reaction, 3 μl of sample cDNA, 5 μl of Power Up SYBR Green (Thermo Fisher Scientific), 1 μl of PrimeTime qPCR primer (Integrated DNA Technologies) and 1 μl of ddH20 were added to each well. Samples were heated to 95 °C for 2 min, followed by 40 cycles of 95 °C for 15 s, 60 °C for 33 s and 72 °C for 33 s in a QuantStudio (software v1.5.2). Analysis was done using the ΔΔCt method, and samples were normalized to the Gapdh mouse housekeeping gene. Primer pairs (Integrated DNA Technologies) are listed in Supplementary Table 1. Primers for ECS components were based on previously published sequences75.
Endocannabinoidome Transcriptional Analysis with TaqMan Array qPCR-based TaqMan Open Array was conducted76. Briefly, NAc and PFC tissue punches were collected, as described above, followed by RNA isolation using the RNeasy Plus Mini Kit (Qiagen) and eluted in 50 μl of UltraPure Distilled Water (Invitrogen). Isolated RNA concentration and purity were determined by measuring the absorbance of the RNA in a Biodrop at 260 nm and 280 nm, and RNA integrity was assessed by an Agilent 2100 Bioanalyzer, using the Agilent RNA 6000 Nano Kit (Agilent Technologies). A total of 1 µg RNA was reverse transcribed to cDNA with the iScript cDNA Synthesis Kit (Bio-Rad). For the analysis, 60 ng of starting RNA was used. Expression of the 52 eCBome-related genes and 4 mouse housekeeping genes (Supplementary Table 2) was measured using a custom-designed qPCR-based TaqMan Open Array on a QuantStudio 12K Flex Real-Time PCR System (Thermo Fisher Scientific). mRNA levels were evaluated by the 2−ΔΔCt method and represented as fold increase with respect to CTRL.
Perfusion, tissue processing, immunohistochemistry and confocal microscopy
Mice were anesthetized with a mixture of ketamine (10 mg kg−1) and xylazine (1 mg kg−1) and perfused with ice-cold 1× PBS followed by 4% paraformaldehyde (PFA) in PBS. Brains were removed, postfixed in 4% PFA overnight and then sectioned coronally (40 μm) on a vibratome (Leica VT1000 S). Free-floating sections were permeabilized with blocking buffer (PBS + 5% normal donkey serum (NDS), 0.3% Triton X-100) for 1 h and then incubated with primary antibodies (Supplementary Table 3; Aqp4 (Synaptic Systems, 429004), 1:200; CD31 (Thermo Fisher Scientific, Invitrogen, 14-0311-85), 1:100; s100β (Synaptic Systems, 287004), 1:250; MAP2 (Millipore, 05-346-MI), 1:300; CB1R (Abcam, AB23703), 1:200; Neun (Millipore, MAB377), 1:500 and cFos (Abcam, ab209794), 1:200) overnight at 4 °C. The next day, slices were then washed 3 × 10 min with PBS + 0.3% Triton X-100, incubated with corresponding secondary antibodies in blocking solution (donkey antirabbit Cy5 (1:400), donkey antiguinea pig Cy3 (1:400) or donkey antimouse Cy2 (1:400), donkey antirat Cy2; Jackson ImmunoResearch) for 2 h, washed 3 × 10 min with PBS, counterstained with 4,6-diamidino-2-phenylindole (DAPI) mounted and coverslipped with ProLong Diamond Antifade Mountant (Invitrogen).
Seven-micrometer-thick z-stack images of the NAc and PFC were acquired on an LSM 700 confocal microscope (Carl Zeiss, ZEN v.3.1). Images were taken using a 20 lens with a resolution of 1,532 × 1,532. Pixel size was 0.25 µm in the x–y–z planes, pixel dwell time was 1.98 µs and the line average was set at 1. For analysis, three planes bilaterally from three consecutive NAc sections and one PFC section were acquired from each animal. The number of CB1 puncta colocalizing with MAP2+ neurons and S100β+ astrocytes was analyzed using model-based machine learning analysis with Imaris 9.7.2 software (Oxford Instruments). To evaluate BBB-related changes, the surface area of vessels stained with CD31 and coverage of astrocytic end feet marked with Aqp4 was analyzed using model-based machine learning analysis with Imaris 9.9.1 software (Oxford Instruments).
For staining of cultured astrocytes, cells grown on sterilized glass coverslips were washed with cold PBS and fixed with 1 ml of cold (100%) methanol for 10 min. After removal of methanol excess, cells were incubated with 200 µl of blocking solution (1% BSA, 0.003% Triton X-100 and 4% NDS in PBS 1×) for 2 h at room temperature, then with the primary antibodies (GFAP; Synaptic Systems, 173004; 1:1,000) and Aqp4 (Thermo Fisher Scientific, EMD Millipore, AB2218MI), 1:500 for 16 h at 4 °C. Next, cells were incubated with corresponding secondary antibodies (donkey antirabbit Cy3 (1:400) and donkey antiguinea pig Cy5 (1:400); Jackson ImmunoResearch) for 2 h at room temperature in the dark, washed 3 × 10 min with PBS and counterstained with DAPI. Coverslips were carefully removed from wells and mounted on glass slides with ProLong Diamond Antifade Mountant (Invitrogen). Four-micrometer-thick z-stack images of astrocytes were taken on an LSM 700 confocal microscope (Carl Zeiss, ZEN v.3.1) using ×40 lens and a resolution of 1,532 × 1,532. For every condition, images were acquired at three different locations on each of the four coverslips. GFAP morphology was analyzed with the surface model in Imaris 9.9.1 and 10.2 software (Oxford Instruments).
Stimulated emission depletion (STED) microscopy for perivascular CB1 morphology
Morphological imaging of the perivascular CB1 was performed on a four-channel STED microscope (Expert Line; Abberior Instruments GmbH). CB1 was labeled with Alexa 647 and Aqp4 with Alexa 594. Alexa 647 and Alexa 594 were excited with 40 MHz pulsed lasers at 640 and 561 nm, respectively. Fluorescence was detected on two avalanche photodiodes (APD) using an ET685/70 filter (Chroma) for Alexa 647 and a 615/20 filter (Semrock) for Alexa 594. Endothelial marker CD31 labeled with Cy2 was imaged in confocal mode using a 40 MHz excitation laser at 485 nm. The Cy2 fluorescence was detected on a third APD with a 525/50 (Semrock) fluorescence filter. Pixel dwell time was set to 12 μs with a pixel size of 20 nm. Scanning was performed using the line step modality with four repetitions for CD31, six repetitions for CB1 and four repetitions for Aqp4. Single-channel reference images were recorded for spectral unmixing, which was performed using the ImageJ Spectral Unmixing Plugins. The microscope was equipped with a motorized stage and an autofocus unit.
Viral constructs for AAV2/5-GFAP-eGFP and AAV2/5-GFAP-Cnr1-eGFP
Plasmid for AAV2/5-gfaABC1D-Cnr1-MyC-T2A-eGFP was generated at Manuel Guzman’s Lab (University of Madrid). Both AAV2/5-gfaABC1D-Cnr1-MyC-T2A-eGFP and AAV2/5-gfaABC1D-eGFP were developed by the Molecular Platform of the CERVO Brain Research Center. Vectors from serotypes 2/5 were generated by tripartite transfection (pAAV-rep2/cap5 capsid plasmid, adenovirus helper plasmid and AAV-vector plasmid) into HEK293-derived AAV-293 cells (Stratagene, 240073). Three days after transfection, the virus was extracted and then quantified by quantitative polymerase chain reaction. Viral constructs for AAV-GFAP-shmir-Cnr1, AAV-GFAP-scrmb, AAV-hSYN-shmir-Cnr1 and AAV-hSYN-scrmb, AAV5-GFAP-GFP-shRNAmir(Scrm), AAV5-GFAP-GFP-shRNAmir(Cnr1), AAV9-hSyn-GFP-shRNAmir(Scrm) and AAV9-hSyn-GFP-shRNAmir(Cnr1) were developed by the SignaGen Laboratories.
Stereotactic surgeries and viral-mediated gene overexpression or knockdown
All surgeries were performed under aseptic conditions4. Isoflurane (2–3%, oxygen flow 1 l min−1) was used for anesthesia. Animals were placed in stereotaxic instrument (Harvard Apparatus), and a 30-gauge syringe needle (Hamilton) was used to bilaterally infuse viral mediators. For targeted disruption of the BBB, 0.5 µl of virus (1.0 × 10¹¹ infectious units per ml) expressing either AAV2/9-shRNA or AAV2/9-shRNA-Cldn5 was injected into the NAc shell (bregma coordinates—anteroposterior, +1.5 mm; mediolateral, ±0.5 mm and dorsoventral, −4.5 mm) at a rate of 0.1 µl min−1 (refs. 3,5). Following surgery, mice were allowed to recover for 1 week before a 21-day activation of the viruses with doxycycline treatment (2 mg ml−1 in drinking water) and tissue collection. For driving expression of astrocyte-specific Cnr1, 0.5 µl of virus (1 × 10¹¹ infectious units per ml) expressing either AAV2/5-GFAP-eGFP or AAV2/5-GFAP-Cnr1-eGFP was injected bilaterally into NAc shell of male mice. For knockdown of astrocyte expression of Cnr1, 0.5 µl of virus (1 × 10¹² infectious units per ml) expressing either AAV5-GFAP-GFP-shRNAmir(Scrm) or AAV5-GFAP-GFP-shRNAmir(Cnr1) was injected bilaterally into NAc shell. NAc core (bregma coordinates—anteroposterior, +1.35 mm; mediolateral, ±1.25 mm and dorsoventral, −4.55 mm) specific neuronal downregulation of Cnr1 was achieved with bilateral injection (0.5 µl of virus, 1 × 10¹² infectious unit per ml) of AAV9-hSyn-GFP-shRNAmir(Scrm) or AAV9-hSyn-GFP-shRNAmir(Cnr1). Behavioral testing and morphological analysis were performed following 3 weeks of recovery and AAV expression. Injection placement was validated with visualization of GFP, GFAP and CB1 immunostaining. Validation of the specificity of Cnr1 overexpression has been done with RNAscope both in vivo and in vitro.
Endocannabinoid content measurement with HPLC–MS/MS
HPLC–MS/MS was used to characterize endocannabinoidome changes77. Two bilateral 2 mm punches were collected from one adjacent 1 mm thick coronal slice on wet ice and immediately flash-frozen before processing. Next, tissue punches were homogenized in a 1:1 solution of 50 mM Tris–HCl (pH 7) and methanol containing 0.575% acetic acid and 5 μl of deuterated standards. After the addition of 1 ml of chloroform, samples were vortexed for 30 s and centrifuged at 3,000g for 5 min, with 3 ml of chloroform and three repetitions in total. The organic phases were collected and evaporated under reduced pressure using a speed-vac evaporator and then suspended in 50 μl of mobile phase containing 50% of solvent A (water + 1 mM ammonium acetate + 0.05% acetic acid) and 50% of solvent B (acetonitrile/water (95/5) + 1 mM ammonium acetate + 0.05% acetic acid). For the analysis, 40 μl of each sample was finally injected into an HPLC column (Kinetex C8, 150 × 2.1 mm, 2.6 μm; Phenomenex) and eluted at a flow rate of 400 μl min−1 using a discontinuous gradient of solvent A and solvent B18. Quantification of endocannabinoid AEA and 2‐AG content was carried out by HPLC system interfaced with the electrospray source of a Shimadzu 8050 triple quadrupole mass spectrometer and using multiple reaction monitoring in positive ion mode for the compounds and their deuterated homologs. Full lists of HPLC–MS/MS raw data are provided in Supplementary Data 3 and 4.
FACS of astrocytes
NAc samples were collected following the CSDS protocol as described above. Following rapid decapitation, six bilateral 2 mm punches per animal were collected from two adjacent 1 mm thick coronal slices on wet ice and immediately processed for cell dissociation. NAc punches were dissociated using a neural tissue dissociation kit according to the manufacturer’s protocol (Miltenyi Biotec), applied on a 70 μm MACS smart strainer (Miltenyi Biotec) and washed with 1× Hank’s Balanced Salt Solution (HBSS). Following centrifugation at 400g for 10 min at 4 °C, pellet was resuspended in 50 µl and incubated for 30 min on ice with antibody mix to select astrocytes (ACSA2 APC; Miltenyi Biotec, 130-116-244; 1:10), CD45 (CD45 PECy7; Invitrogen, 25-0451-81; 1:25), CD11b (CD11b PE; Invitrogen, 12-0112-81; 1:25) and CD31 (CD31 PECY7; BioLegend, 102417; 1:25). A viability dye (LIVE/DEAD fixable green; Molecular Probes, L34969) was added to the previous panels to discriminate live cells. For isolation of astrocytes from AAV2/5-GFAP-eGFP or AAV2/5-GFAP-Cnr1-eGFP transduced animals, eGFP (anti-GFP PE; BioLegend, 338004; 1:10) antibody was used. Cells were washed with HBSS, resuspended in 300 μl HBSS and sorted with FACS. Astrocytes were sorted as CD45−, CD11b−, CD31− and ACSA2+ alive cells. All analyses were performed on BD LSR II, and data were analyzed with FACS Diva software (BD Biosciences, v.6.1.3). To proceed with gene expression analysis, RNA was extracted from the isolated astrocytes with the PicoPure RNA Isolation Kit, as described by the manufacturer (Arcturus, KIT0202).
MACS of astrocytes
NAc samples were collected 24 h after behavioral assessment3. Bilateral 14-gauge NAc tissue punches were collected from two adjacent 1 mm coronal slices on wet ice after rapid decapitation and immediately processed for MACS purification3. Astrocyte cells were enriched from NAc punches by using MACS according to the manufacturer’s protocol (Miltenyi Biotec). Briefly, brain punches were dissociated using a neuronal tissue dissociation kit (Miltenyi Biotec, 130-092-628), applied on a 70 μm MACS smart strainer and washed with HBSS 1×. Thereafter, cells were magnetically labeled with Acsa2 microbeads (Miltenyi Biotec, 130-097-679) and passed through a MACS MS column (Miltenyi Biotec, 130-042-201). Samples containing Acsa2+ cells were pulled from two mice with similar SI values and immediately flash-frozen before processing for HPLC–MS/MS.
Human postmortem tissue collection
Male human brains were collected, and NAc tissue samples were dissected by the Suicide section of the Douglas-Bell Canada Brain Bank (https://douglasbrainbank.ca) under the approval of the institution’s research ethics board3,4,5. Familial consent through the Quebec Coroner’s Office predeceases all tissue collection to the Suicide section of the Douglas-Bell Canada Brain Bank. Individuals with evidence of drugs or psychotropic medications, including cannabis, were excluded based on blood toxicology results. Demographic characteristics associated with each sample are listed in Supplementary Table 4. Clinical records and interviews were obtained for each case and reviewed by three or four mental health professionals to establish independent diagnoses followed by a consensus diagnosis in line with the Diagnostic and Statistical Manual of Mental Disorders IV criteria. All experiments were performed with the approval of Université Laval and CERVO Brain Research Center Ethics Committee Neurosciences et santé mentale (project 2019-1540).
Human RNAscope
In situ hybridization was performed on human NAc tissue slices with RNAscope (Advanced Cell Diagnostics). Samples were postfixated in 4% PFA solution, followed by a three-step dehydration with 50–100% ethanol solution and a pretreatment protocol of 10 min with hydrogen peroxide and protease IV for 30 min at room temperature. Next, probe hybridization with the Multiplex Fluorescent Detection Reagents V2 (Advanced Cell Diagnostics) was performed according to the manufacturer’s protocol. Probes included CNR1—Hs-CNR1-C3 (591521-C3); AQP4—Hs-AQP4-C2 (482441-C2); and NEUN—Hs-RBFOX3 (415591). Probe signal was developed with TSA Vivid Fluorophore dyes—NEUN with 520 nm (Advanced Cell Diagnostics, 323271; 1:1,000), AQP4 with 570 nm (Advanced Cell Diagnostics, 323272; 1:1,000) and CNR1 with 650 nm (Advanced Cell Diagnostics, 323273; 1:1,000). Tissue slices were mounted and coverslipped with ProLong Diamond Antifade Mountant (Invitrogen). Confocal fluorescent images were captured with a Zeiss LSM 700 microscope using a ×63 objective (Zeiss PLAN-APOCHROMAT, numerical aperture = 1.3) with oil immersion. Cell bodies stained with DAPI (subregion of 200 × 200 pixels) and RNA signal (pixels with intensities higher than the mean plus 0.5–1 s.d.) were identified, and colocalization analysis was performed using Imaris software (v.9.7.2; Oxford Instruments).
Mouse RNAscope
Mice were anesthetized with a mixture of ketamine (100 mg kg−1 of body weight) and xylazine (10 mg kg−1 of body weight), perfused for 7 min with 0.1 M PBS and the brains were quickly extracted and frozen in optimal cutting temperature compound using isopentane on dry ice. Blocks were stored at −20 °C for 24 h before slicing on a cryostat at 12-μm thickness. Slices were thawed, mounted onto Superfrost Plus (Thermo Fisher Scientific) slides and then stored at −80 °C. In situ hybridization was performed as described above with the Multiplex Fluorescent Detection Reagents V2 (Advanced Cell Diagnostics). Cnr1 mRNA was detected using Mm-Cnr1-C3 probe (420721-C3), Neun—Mm-Rbfox3 (313311) and Gfap—Mm-Gfap-C2 (313211-C2). The signal was visualized with 650 TSA Vivid Fluorophore dye for Cnr1 (Advanced Cell Diagnostics, 323273; 1:1,000), 570 TSA Vivid Fluorophore (Advanced Cell Diagnostics, 323272; 1:1,000) for Neun or Gfap. For localizing Cnr1 mRNA onto the BBB interface, RNAscope detection was followed by immunolabeling of astrocytic end feet (Aqp4; Synaptic Systems, 429004 (SY); 1:50) and endothelial cells (CD31 (Thermo Fisher Scientific, Invitrogen, 14-0311-85), 1:25) based on the protocol by Christopher M. Reid from Harwell Lab. Briefly, 50 µl of primary antibodies solution in PBS was incubated in hybEZ oven at 37 °C for 1 h. Following sample rinse in wash buffer, slides were incubated with secondary antibodies—donkey antiguinea pig Cy3 (1:400) and donkey antirat Cy2 (1:400; Jackson ImmunoResearch) in hybEZ oven at 37 °C for 30 min. Finally, tissue slices were mounted and coverslipped with ProLong Diamond Antifade Mountant (Invitrogen). Confocal fluorescent images of the NAc shell were captured with a Zeiss LSM 700 microscope using a ×63 objective (Zeiss PLAN-APOCHROMAT; numerical aperture = 1.3) with oil immersion. Cd31+ endothelial cells and Aqp4+ astrocytic end feet were identified (subregion of 100 × 100 pixels) and Cnr1 RNA signal (pixels with intensities higher than the mean plus 0.5–1 s.d.) were identified. Colocalization analysis was performed using Imaris software (v.9.7.2 and v.10.2; Oxford Instruments).
Astrocyte primary cell culture
Brains from pups aged 4 days were extracted, and cortices were dissected for primary astrocyte culture preparation78. Extracted tissue was digested in 0.25% of trypsin solution in HBSS (Gibco) for 30 min at 37 °C and mixed every 10 min. The supernatant containing trypsin was removed, and tissue was resuspended in 10 ml of prewarmed culture media (DMEM high glucose, 10% fetal bovine serum, 1% penicillin–streptomycin, 10 ng ml−1 epidermal growth factor (Gibco) and 10 ng ml−1 fibroblast growth factor (Gibco)). Digested tissue was dissociated by pipetting and passed through a 70 µm cell strainer (Miltenyi Biotec). The resulting cell filtrate was then plated in a six-well plate precoated with 5 µg ml−1 poly-d-lysine (PDL; Millipore, A-003-E) at a dilution corresponding to one brain per well and incubated at 37 °C in 5% CO2. Media was changed every 2–3 days. After 7 days in culture, the six-well plate was placed on an orbital shaker for 30 min at 180 rpm to remove microglia. After discarding the supernatant and replacing it with warm astrocyte media, the plate was shaken at 240 rpm for 6 h to remove oligodendrocyte precursor cells. Isolated astrocytes were removed from plates with TrpLE (Gibco) and transferred to T75 flasks precoated with PDL. Astrocyte identity was confirmed by gene expression and immunofluorescence staining. Cells seeded at a density of 2.5 × 10⁴ cells per cm2 were used for experiments up to passage 1.
Astrocytes exposure to pro-inflammatory IL-6 and 2-AG
Astrocytes were cultivated on a precoated six-well plate and grown for 7 days before infection with pro-inflammatory mouse recombinant IL-6 (100 ng ml−1; Life Technologies, RMIL6I), diluted in cell culture media. Cells were then incubated for 24 h at 37 °C and 5% CO2 followed by RNA extraction and qPCR analysis. For chronic IL-6 stimulation, media was removed every day and replaced with fresh media containing 100 ng ml−1 IL-6 for up to 7 days. For IL-6 and 2-AG cotreatment (100 µg ml−1; Cayman Chemical), cells were incubated for 3 h at 37 °C and 5% CO2 followed by media collection and immediately flash-frozen before processing for HPLC–MS/MS. Cells were resuspended in 200 μl of TRIzol for RNA extraction and transcriptome-wide gene-level expression profiling. Cell viability after IL-6 and 2-AG treatment was assessed by conversion of 3-(4,5-dimethyl-2-thiazolyl)-2,5-diphenyl-2H-tetrazolium (MTT; Millipore Sigma) to formazan by mitochondrial complex II of the electron transport chain. Briefly, cells in a 24-well plate are treated with 500 μM MTT and incubated (37 °C and 5% CO2) for 2 h. Media was removed, and formazan crystals were dissolved in 500 μl dimethyl sulfoxide for absorbance readings at 570 nm using a spectrophotometer. Viability is calculated as a percent of the control reading.
Astrocytes infection with AAV viruses
Astrocytes were cultivated on a six-well plate for qPCR analysis or a 24-well plate for immunolabeling for 4 days before infection. Next, half of the cell culture media was removed to facilitate infection, and viral particles corresponding to 80,000 genome copies (GC) per cell of either control AAV AAV2/5-GFAP-eGFP or AAV2/5-GFAP-Cnr1-eGFP were added. Infected astrocytes were incubated overnight at 37 °C, 5% CO2. The next day, the media was replenished to provide nutrients to the cells while the infection proceeded. Following 4 days of infection, cells were either exposed to IL-6 treatment or processed for qPCR or immunolabeling.
RNA sequencing of mouse NAc astrocytes
Samples were shipped to Genome Quebec for RNA extraction, quality control and gene expression profiling with the Illumina NovaSeq assay for mice (Illumina). For FACS-isolated mouse NAc astrocytes transduced with AAV2/5-GFAP-eGFP or AAV2/5-GFAP-Cnr1-eGFP, total RNA was quantified using a NanoDrop Spectrophotometer ND-1000 (NanoDrop Technologies), and its integrity was assessed on a 2100 Bioanalyzer (Agilent Technologies). Libraries were generated from 1.2 ng of total RNA. For in vitro primary mouse astrocytes, total RNA was quantified, and its integrity was assessed using a LabChip GXII (PerkinElmer) instrument. Libraries were generated from 100 ng of total RNA. Libraries were prepared as follows: mRNA enrichment and cDNA synthesis were achieved with the NEBNext Single Cell Low Input RNA Library Prep Kit for Illumina (New England BioLabs). Libraries were quantified using the KAPA Library Quantification Kits—Complete kit (Universal; Kapa Biosystems). Average size fragment was determined using a Fragment Analyzer (Agilent) instrument. The libraries were normalized and pooled and then denatured in 0.02 N NaOH and neutralized using a preload buffer. The pool was loaded at 140 pM on an Illumina NovaSeq X Plus 10B lane following the manufacturer’s recommendations. The run was performed for 2 × 100 cycles (paired-end mode). A phiX library was used as a control and mixed with libraries at a 1% level. Program BCL Convert 4.2.4 was used to demultiplex samples and generate fastq reads. To identify significant changes between groups, filters were set at fold change ±2 and P < 0.05. To identify significant pathways, gene set enrichment analysis was performed with a P value adjusted with Benjamini–Hochberg and a q value cut off at 1. Full lists of genes and pathways are provided in Supplementary Data 2.
Statistical analysis
All data are presented as means ± s.e.m. The sample size was calculated based on previous studies5,6,7. All mice were assigned to SS or RES groups based on their behavioral profile (no outlier) when compared to unstressed CTRL. SI screening and behavioral tests were performed with automated tracking systems when possible. If not (for splash, sucrose preference, tail suspension and FSTs), scoring was done by experimenters blinded to experimental conditions. Outliers for behavioral testing after viral-mediated manipulations—for example, those characterized by impaired locomotion—were identified as being greater than 2 s.d. from the mean and excluded from statistical analysis. All quantitative PCR, immunohistochemistry and transcriptional quantification were performed in duplicate in at least two different cohorts of mice. Normality was determined with Shapiro–Wilk tests and Levene’s test for homogeneity of variances. Comparisons between groups were performed using two-tailed t-test, one-way analysis of variance (ANOVA) and two-way ANOVA with Holm–Šídák’s or Tuckey’s post hoc follow-up test for data with normal distribution and equal variances. Data were analyzed using the nonparametric Kruskal–Wallis test, Brown–Forsythe ANOVA or Mann–Whitney U test for pairwise comparisons followed by Holm–Šídák’s or Dunn’s multiple comparisons evaluation when it did not meet the assumption of normality or the n was lower than 8. For two-factor analysis, nonparametric two-way ANOVA on ranks followed by the Wilcox multiple comparison test was applied. Values of P < 0.05 were regarded as statistically significant. Graphs and statistics were generated using GraphPad Prism Software (v.9 and v.10; GraphPad Software).
The exact sample size (n) for each experimental group/condition is provided on the figure graphs and source data files. For detailed statistical analysis including tests of normality, if statistical tests used were one- or two-sided, for multiple comparisons, a full description of the statistical parameters, test statistics and estimates of effect sizes, refer to Supplementary Data 1.
Reporting summary
Further information on research design is available in the Nature Portfolio Reporting Summary linked to this article.
Responses