Atlas of imprinted and allele-specific DNA methylation in the human body
Introduction
DNA methylation is a stable epigenetic mark that alters the accessibility and 3D packaging of the genome, allowing differentiated cell types to selectively utilize transcriptional programs and maintain their cellular identity throughout life1. Methylation patterns are generally identical between the paternal and maternal alleles2,3,4,5,6, although a small fraction of the genome, estimated at 5% based on common SNPs, was reported to show allelic methylation differences4,7,8,9,10,11.
The molecular basis of monoallelic methylation patterns and their functional consequences varies. In the case of meQTLs, genetic variation is associated with varying levels of methylation. One cis-acting genetic variant is associated with hyper-methylation, whereas another variant is associated with hypo-methylation, possibly to regulate the expression of an adjacent gene7. In other cases, for example in mammalian female X-chromosome inactivation, at some early embryonic developmental stage each cell randomly methylates one chromosome, and this selection is then maintained in future cell divisions8,12,13,14. In other instances allelic methylation relates to the parent of origin, wherein either the maternal or paternal allele is methylated15,16,17,18. Parental allele-specific methylation at imprinted differentially methylated regions (iDMRs), that are established early in development and retained throughout adult life, is the basis for genomic imprinting whereby genes are expressed only from one specific parental allele19,20,21,22. These epigenetic differences play an important role in placental function and embryonic development, and dysregulation of imprinted genes is associated with developmental disorders such as Beckwith-Wiedemann syndrome, Angelman syndrome, and Prader-Willi syndrome23,24,25,26,27,28. In fact, sperm and oocytes show thousands of differences in methylation, with sperm usually being highly methylated while oocytes are generally unmethylated29. This suggests that there might be multiple genomic regions besides imprinted DMRs, which escape epigenetic reprogramming and are not necessarily associated with the regulation of gene expression.
Nonetheless, our understanding of allele-specific methylation remains incomplete. To a large extent, this is due to the fact that most genome-wide methylome datasets are based on DNA methylation arrays (Illumina BeadChip 450 K and EPIC), and are limited to a predefined set of CpGs, capturing only 1.5%-3% of the 28 million methylation sites in the human genome. Additionally, methylation arrays capture the average methylation levels of individual CpGs, and genetic (SNP) information or epigenetic dependencies between neighboring sites on the same DNA molecule are unobservable. Finally, the study of imprinting and allele-specific methylation in humans was previously limited to few cell types, focusing on easily accessible blood DNA15,28,30,31,32.
Several next-generation sequencing studies recently analyzed allele-specific methylation (ASM) from blood15,30. Other studies analyzed uniparental disomy samples31,32 using a combination of iPSC, ESC and blood cells33, or focused on sequence-dependent allele-specific changes7. Additionally, allele-specific gene expression was studied across human tissues16, using RNA-seq data from GTEx34, and reported biallelic expression for known imprinted genes in few tissues (e.g. IGF2 in the liver16); similarly tissue-specific allelic expression was reported in mice35. Such cases of cell-type-specific escape from parental repression raise questions as to the molecular mechanisms underlying imprinting, their relation to allele-specific methylation, and how they are modified in specific cell types, thus exemplifying the need for a detailed genome-wide pan-tissue atlas of allele-specific methylation. Recently, we characterized the DNA methylation landscape of over 200 surgical and blood samples that were obtained from 135 donors, purified to homogeneity, and deeply sequenced at a whole-genome scale3.
Here, we developed computational algorithms for the identification and characterization of allele-specific methylation (ASM), including sequence-dependent effects (e.g. meQTLs) as well as parental-ASM regions. Overall, we identified 325k regions with bimodal DNA methylation patterns, 34k of which overlap heterozygous SNPs that segregate with DNA methylation, thus supporting allele-specific differences. We also identified 460 putative parental-ASM regions where allele-specific methylation across multiple donors cannot be explained by heterozygous variations. These cover 45 known imprinted DMRs (out of a total of 55 known), a set of 34 novel regions near known imprinted genes, and 381 novel tissue-specific parental-ASM regions, which are enriched for regulatory regions, polycomb domains, and origins of asynchronous replication. We used parent-child trios to validate one putative parental-ASM region residing in the CHD7 gene, providing a potential mechanism for the mode of inheritance of CHARGE syndrome that is associated with heterozygous mutations in CHD7. The atlas presented here expands our knowledge of parental imprinting, with implications for understanding the crosstalk between genetic variation, DNA methylation, allele-specific expression and tissue-specific gene expression.
Results
To analyze the landscape of allele-specific methylation and imprinting, we revisited our human DNA methylation atlas describing the methylomes of 202 healthy samples, representing ~40 primary cell types collected and purified from 135 donors3. The purity of these samples and the high sequencing depth facilitate a fragment-level analysis of DNA methylation, capturing both genetic and epigenetic information from each sequenced fragment. This dataset offers a unique resource to uncover cell-type-specificity of allele-specific methylation (Fig. 1). To further understand how ASM may impact gene expression, we integrated the methylation atlas with allele-specific expression data from GTEx36 spanning >50 tissues and cell types.

Using fragment-level analysis, we identified 324,759 genomic loci showing a mixture of fully methylated and fully unmethylated DNA fragments. Genetic variation at neighboring SNPs was used to split the fragments by genotype, and to identify 34,426 loci that show allele-specific methylation. These were analyzed across multiple donors and classified as sequence-dependent allele-specific methylation (SD-ASMs, bottom-left) where methylation consistently segregates with one allele, or parental allele-specific methylation (bottom-right) if both methylated and unmethylated epialleles exist, regardless of the genotype, suggesting that methylation is associated with parental, rather than genetic, origin. Overall, we identified 460 parental-ASM loci, including most known imprinted DMRs, as well as multiple novel regions. 78 of these regions are associated with imprinted genes. One such novel region within CHD7, a gene associated with CHARGE syndrome, was validated as maternally methylated. Remarkably, some of these regions also show cell-type-specific effects, including escape of allele-specific methylation.
Identification of regions with bimodal methylation
Our initial analysis focused on identifying regions of bimodal methylation, where half of the sequenced reads are methylated, and the other half are unmethylated33,37,38. Such bimodality could be attributed to differential methylation in sub-populations of cells; however in the case of primary cell types purified to homogeneity from a single donor, the existence of two epialleles suggests allele-specific methylation (ASM) – either parental-ASM regions, where one parental allele is methylated while the other is not, or at sequence-dependent ASM (SD-ASM) regions, where a heterozygous genetic variant is associated in cis with differential methylation7,15. To identify bimodal regions, we classified each DNA fragment, typically covering multiple neighboring CpG sites, as “mostly unmethylated” (U), “mostly methylated” (M), or “mixed” (X)39. We then calculated the percent of U/X/M fragments in each genomic position, and developed an algorithm to identify genomic regions consisting of a mixture of methylated and unmethylated fragments (Fig. 2A, S1).

A A computational algorithm identifies bimodal regions (n = 324,759), by analyzing deeply sequenced methylomes from 39 cell types. Shown is a bimodal region (chr19:54039871-54043130, hg19, highlighted) where 51% of DNA fragments are methylated (black), and 46% are unmethylated, in a colon macrophage sample purified from a single donor. B Similarly, DNA fragments from Adipocytes were split by a common T/G SNP (rs2071094, chr11:2021164) to show allele-specific methylation. Fragments carrying the T allele are unmethylated (white), whereas G allele fragments are methylated. (C) Contingency table of alleles by methylation, as shown in (B). All 29 unmethylated fragments are from the G genotype, whereas all 22 methylated ones carry the T genotype (adj. p 7.1E-19 ≤ 7.1E-19, Fisher’s exact). D Genetic/Epigenetic table across multiple samples/cell types (rs9330298, chr1:153590254, hg19). Here, for all samples (homozygous or heterozygous), unmethylated fragments (U) have the G genotype, whereas the methylated fragments (M) are associated with the alternative T genotype, consistent with sequence-dependent allele-specific methylation (SD-ASM). E A similar table for rs80269905 (chr11:2720873), is consistent with parental allele-specific methylation. All samples are bimodal (showing both U and M fragments), and heterozygous samples are associated with allele-specific bimodal patterns but switch across different donors.
Importantly, our algorithm is based on fragment-level analysis and does not rely on fixed-sized windows, allowing for flexible and accurate determination of start and end positions, at a single base-pair resolution. Overall, we identified 324,759 regions showing a significant bimodal pattern in at least one sample (Data S1). These bimodal regions cover all (100%) known imprinted differentially methylated regions (iDMRs), spanning a total of 172 Mb (5.7% of the genome, 11% of all CpG sites). On average, each individual sample shows bimodal patterns across 2.45% of CpG sites (std = 1.6) or 1.15% of the genome (34.76 Mb, std = 0.94), with most bimodal regions (65%) showing bimodal patterns in at least 10 samples.
Ubiquitous and cell-type-specific methylation patterns at known imprinted differentially methylated regions
Most notable of these regions is the imprinted DMR associated with IGF228 (chr11:2018812-2024740, hg19), which shows bimodal methylation patterns in all 202 samples. As Fig. 3A, B demonstrate, half of the sequenced reads at this region are methylated across multiple CpGs, whereas the other half are unmethylated, consistent with bimodal allele-specific patterns originating from differential parental allele-specific methylation. Similarly, the known iDMRs28 associated with DIRAS3, ZDBF2/GPR1-AS, PLAGL1, PEG10, and others are ubiquitously bimodally methylated (Fig. S2).

A DNA fragments from adipocytes purified from a single donor, at the known imprinted differentially methylated region (iDMR) of the IGF2 gene (chr11:2018812-2024740, hg19). 52% of fragments are fully methylated (black circles) whereas 45% are fully unmethylated (white circles). B Stacked bars showing the percent of methylated (red), unmethylated (green) or mixed (yellow) DNA fragments, across 202 purified samples, spanning from 39 cell types, where a nearly balanced pattern of 1:1 ratio between unmethylated and methylated fragments is shown for this known imprinted region. C Same for the known iDMR of IGF2R (chr6:160426558-160427561, hg19), showing a bimodal (imprinted) pattern across all samples, except for small intestine and colon epithelial cells (n = 13 samples), where both alleles are fully methylated (right, bottom). Grey asterisks mark samples from a single donor who exhibits bi-allelic methylation.
Remarkably, not all iDMRs are bimodally methylated across all adult tissues. For example, IGF2R is maternally expressed in mice, but not in humans40 where both alleles are expressed, purportedly due to the loss of the ncRNA Air41,42. Nonetheless the known iDMR for IGF2R (chr6:160426558-160427561, hg19) was thought to show allele-specific methylation in all human adult tissues41,43,44. Using our data, we show that while this iDMR is generally bimodal, it is fully methylated, across both alleles, in all 13 colon and small intestine epithelium samples (Fig. 3C). Besides IGF2R, we found 13 known iDMRs that show cell-type-specific alterations of the bimodal (imprinted) pattern. Intriguingly, we observed regions that became biallelically hypomethylated as well as regions that became fully methylated, suggesting high cell-type-specific plasticity at parental-ASM regions (Figs. S2, S3).
Additionally, a detailed examination of known iDMRs across different cell types identified fluctuations in their exact boundaries, as well as internal patches that are fully methylated in some cell types. For example, the imprinted DMR of H19/IGF228 is bimodal in all blood samples but contains a small 700bp-long region of biallelic methylation in hepatocytes and pancreatic samples (Fig. 4A, B).
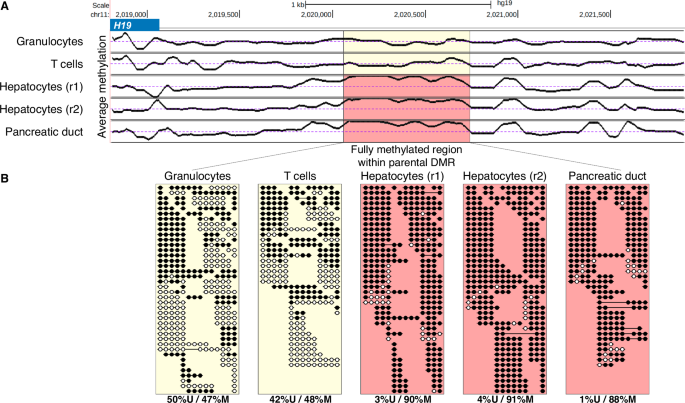
A Average CpG methylation plot (chr11:2018807-2021899) within the known iDMR for H19/IGF2. The highlighted 692 bp patch (chr11:2020097-2020789) shows monoallelic methylation in purified granulocytes and T cells samples (as expected) but is fully methylated in hepatocytes, and pancreas ductal epithelial samples. An average of 50% methylation is expected for known iDMRs (dotted line). B Sequenced DNA fragments from within the highlighted region, revealing intra-iDMR biallelic methylation. Indeed, almost all fragments from the hepatocytes and pancreas are fully methylated, compared to half of granulocyte and T cell DNA fragments.
We therefore used the genome-wide catalog of bimodal regions to automatically highlight and mask out within-iDMR sub-domains that show a biallelic methylation pattern (hyper- or hypo-methylated), thus improving the positional definitions of known imprinted DMRs near imprinted genes (Data S2).
Allele-specific methylation patterns segregated by SNPs
Bimodal methylation patterns within a pure cell population can originate from random patterning (metastable epialleles)45, from genetic polymorphisms (meQTLs), or from parent-specific mechanisms. To distinguish between these possibilities, we developed a statistical procedure to test whether epialleles are associated with specific SNPs. We examined gnomAD46 and identified common SNPs (minor allele frequency, MAF > 1%) that intersect with our set of 325k bimodal regions. In 152k regions, at least one sample exhibited both bimodal methylation and heterozygous SNP (Fig. 2B, C). Overall, we identified 55,271 SNPs that segregate within 34,426 unique allele-specific methylation regions (Data S3). These regions show a bimodal methylation pattern across DNA fragments that cover ≥3 CpG sites, which is segregated in at least one sample. Thus, 4% of SNPs tested were found to associate with ASM, which is more conservative than previous estimates4,7,9. Note that for the majority of bimodal regions, where no informative SNP were found, we are unable to assess if their methylation is sequence-dependent or not. Since sequence reads are typically ~200 bp long, it is impossible to assess the presence of distant genetic variants controlling methylation. Thus, the 34k regions that show bimodal methylation associated with SNPs is a lower bound, and the actual magnitude of sequence- or parent of origin-controlled methylation is likely much larger.
Parental or sequence-dependent allele-specific methylation?
Once regions showing allele-specific methylation were identified, we examined their genetic and epigenetic patterns across multiple samples. As Fig. 2D demonstrates, regions of sequence-dependent allele-specific methylation (SD-ASM)7,15,16 show similar associations between allele and epiallele across donors, including biallelic methylation patterns for homozygous donors. Conversely, iDMRs show bimodal patterns across multiple donors, regardless of genotyping (Fig. 2E). Using stringent statistical thresholds, we identified 460 putative parentally methylated DMRs, covering most known iDMRs (45/55, 82%)27,28. The remaining regions we identified include 78 that are adjacent to known imprinted genes (≤100Kb), 14 that reside near known iDMRs (≤100Kb), and 373 parental-ASM regions whose function is yet to be determined, of which 347 are novel (Data S4). Fig. S4 shows the distribution of bimodality, allele-specific methylation, and known iDMRs across the human genome (hg19), and Fig. S5 shows the distribution of the number of samples exhibiting bimodality, per parental-ASM region.
Validation of parent-of-origin methylation at a novel tissue-specific locus
To validate tissue-specific parent-of-origin methylation patterns, we selected one novel parental-ASM region and studied its methylation patterns across different tissues and cell types. We focused on a genomic region that is fully methylated in blood but bimodal in epithelial cells (Fig. 5A), and performed targeted-PCR methylation sequencing across 33 mother-father-child trios (Data S5–7). This allowed us to capture the epigenetic landscape across multiple CpGs while genotyping the target SNP at each sequenced molecule.

A Fragment-level analysis of a novel parent-of-origin cell-type-specific ASM region we identified (chr8:61627212-61627412, hg19) shows biallelic methylation (red) in endothelial cells, neurons, fibroblasts, and blood cells, but bimodal methylation patterns in hepatocytes and epithelial cells (1:1 ratio of fully methylated and fully unmethylated sequenced fragments of ≥3 CpGs). B–F Genetic/epigenetic analysis of parental allele-specific methylation in tongue-epithelial cells, validated across 15 families (a total of 33 children and their parents, Data S7). For each trio, we used targeted-PCR next-generation sequencing (after bisulfite conversion) to measure the genotype (rs7826035, C/T, chr8:61627312 hg19) and the methylation status of six CpG sites (chr8:61627190-61627349 hg19, measured on the bottom strand). B A trio (family ID IMP017) showing homozygous C/C for the mother, with C/T heterozygosity for the father. The child T allele is therefore of paternal origin. Blue bars correspond to relative allelic read count. Unmethylated DNA fragments (green bars) are limited to the parental T allele, suggesting maternal-specific methylation. C same as (B) for a family with three heterozygous children (family ID IMP012). D A family where the T allele of heterozygous child 1 is maternal, whereas unmethylated fragments (green) are all from the paternal C allele. Two additional siblings are C/C homozygous and not shown (family ID IMP005). E–F Examples of a C/C homozygous family and a C/T heterozygous family, where the parent-of-origin of unmethylated fragments cannot be associated with a parent-of-origin (family IDs IMP014, IMP011). All remaining families were homozygous (C/C, not shown). G Bimodal tissue count track (orange) and -log10 of Fisher’s method for combining Fisher’s exact p values for allele-specific methylation at individual samples (blue track), along with a gene annotation track showing the region surrounding the identified DMR.
As predicted by the WGBS atlas data, unmethylated fragments in this locus were associated with the paternal allele in all discernible cases (Fig. 5B–F). The region identified (chr8:61627190-61627349, hg19) is within an intron of the CHD7 gene (Fig. 5G), bordering a CTCF binding site and CpG island. Importantly, heterozygous mutations in CHD7 cause CHARGE syndrome (see Discussion), and there is evidence that the mutant allele tends to be inherited from the father47. We investigated the common SNP rs4237040 in the data of Hofmeister et al.48 showing strong paternal associations in the Apolipoprotein A, and HDL cholesterol UK Biobank49 phenotypes, further corroborating the existence of parentally associated effects. These results, along with the findings presented here, make this gene a candidate for a novel tissue-specific imprinted gene with clinical significance, and this region putatively involved in its regulation.
Parental allele-specific methylation at regulatory regions
Parent-of-origin differential methylation is key to regulating allele-specific expression of imprinted genes. We therefore used functional annotations to test whether our catalog of parental-ASM regions is enriched for various genomic features. Indeed, we have observed significant local enrichment for promoters (68% of regions, chromHMM annotations), enhancers (8%)50, transcription factor binding sites51 (Data S8, 9, Fig. 6, S6), histone marks of active gene regulation (H3K27ac, 56%)52, and origins of replication (46% of parental-ASM regions)53.

A Percent of parental ASMs annotated as active promoters and bivalent enhancers (chromHMM TssA and EnhBiv terms, respectively). B Enrichment of gene regulatory activity, based on H3K27ac peak annotation in 387 ChIP-seq experiments (AREs)53. C Enrichment for Polycomb repressive regions (chromHMM ReprPC). D Local enrichment for origins of replication, identified using peaks of nascent strand DNA (left), as well as early replication, measured as the ratio of S to G1 phase DNA fragments53. E Enrichment of parental-ASM regions with allelic difference in S/G1 ratio at heterozygous sites53.
These observations highlight the regulatory role of the putative parental-ASM regions we identified through various molecular mechanisms. Furthermore, gene-set enrichment analysis for the putative parental-ASM regions we identified showed a 47-fold enrichment for “maternal imprinting” (FDR ≤ 2.6E-42)54. Intriguingly, over 46% of parental-ASM regions (213/460) overlap with origins of replication53, compared to 17% expected by random (FDR ≤ 9E-58), with an average S/G1 ratio of 1.46 at parental-ASM regions (Fig. 6D).
Parental allele-specific methylation near imprinted and allele-biased genes
Having identified regions exhibiting putative parent-of-origin allele-specific methylation, we sought to associate them with imprinted genes and their iDMRs (Data S10). Combined with Data S1, this map represents a comprehensive catalog of imprinted DMRs in humans. Remarkably, we identified novel parental-ASM regions near seven imprinted genes for which no imprinted DMR was previously found, including PAX8/PAX8-AS1, GNG7, ZNF215, UTS2, AXL, and KIF25 (Data S10). While the imprinted DMRs near UTS2 and ZNF215 were reported in15 the others are novel. As Fig. S7 shows, the novel region we identified 18Kb upstream of PAX8 (chr2:113953706-113955952) shows bimodal methylation in neuronal cells, on par with allele-biased gene expression in the brain16.
We used expression data from GTEx to examine allele-specific expression across the human genome, using 15,253 samples collected from 838 donors55,56, and identified 2,246 genes exhibiting a significant bias in at least one tissue type. Of these, 216 genes are located near regions that we identified as parental-ASM or bimodal in matched cell types (≤250Kb, Fig. 7, S8), compared to 111 genes expected at random (std = 10; permutation test p ≤ 4E-34, Data S11). We then conducted tissue-specific analyses where we asked if genes with biased expression in a specific tissue tend to reside near bimodal regions, compared to randomly selected genes (expressed in the same tissue). Indeed, such an enrichment is observed and is often greater than 4-fold, e.g. for liver, blood vessels, kidney, and breast (Fig. 7A, Data S12). We further checked which of these genes are distal (>100Kb) from previously identified parental-ASM regions, and found 58 genes that are far away from known iDMRs and parental ASMs15,31,32. For example, PRKRA shows biased allelic expression in most pancreatic samples (Fig. 7, S8), with a novel parental-ASM region at a CpG island 60Kb from its TSS.

A Genes showing biased allelic expression (GTEx) are enriched for regions of bimodal methylation (in matched cell types; blue bars) compared to random genes (red). B Allele-specific read counts of phased expression from GTEx are shown using density plots, for the biallelically expressed MYL4 gene in heart samples (left), for the monoallelically and known imprinted gene IGF2 in colon samples, and for PRKRA in pancreas samples, where 85% of expressed samples (>100 total read count) show mono-allelic expression along the two axes. C The proportion of mostly unmethylated reads (avg. methylation per fragment ≤35%, green), of mixed-methylation reads (orange), and of mostly methylated reads (avg. methylation per fragment ≥65%, red) at the MYL4 intronic enhancer in cardiomyocytes (left), at the known imprinted DMR of IGF2 colon epithelial cells (center), and at a putative parental-ASM region 60Kb downstream of PRKRA in pancreatic acinar cells (right).
Previously Baran et al.16, identified parentally biased expression and imprinted genes using the GTEx atlas. Four genes were identified in both the analyses (SYCE1, MYOM2, DLGAP2, and BMP8A). DLGAP2 was previously implicated as imprinted in humans57, and interestingly, altered DNA methylation of its maternal allele is associated with increased diabetes risk58.
Recently, several studies have found parent-of-origin associations with inherited phenotypes. UMODL159 and RTL160 are near a parental-ASM region discovered in our work (Data S10, 11). Additionally, a recent study by Hofmeister et al., used the UK Biobank data for parent-of-origin allelic phasing, enabling parent-specific GWAS48. They identified many of the genes discovered by us (Data S11), including AC139099.2, SDK1, SNHG14, ESPNL, KCNQ1, and TRAPPC9. Using more lenient thresholds, we found 104 genes in their list that show biased expression and reside near bimodal regions in corresponding cell types (Data S13).
Additionally, we used the PanelApp61 Genomic Imprinting panel. The panel denotes multiple genes as having parental allele-biased expression but weak evidence of imprinting. Several of these genes (e.g. PSCA – associated with peptic ulcer, NAP1L5, SNU13, PTCHD3, and PLEKHG4B – associated with asthma) reside near loci we identified as having parental ASM. Additional panel genes near parental-ASM regions (including PROSER2, ART5, MIR134, SNORD107, RYR3, CACNA1A, ZNF714, MIR512, CBR1, PRMT2, ARVCF, RAB7A, FGF12, FAM149A, and SCIN) appear in Data S14.
Finally, to identify additional novel bimodally methylated regions associated with disease, we used Phenotype-Genotype Integrator (PhenGenI)62, ClinVar63, OMIM64, and the NHGRI-EBI GWAS Catalog65 (Data S15). The findings further support the idea that our atlas and regions of bimodal methylation are of clinical significance, and identify promising candidates for previously undiscovered genes with parental allelic bias.
Putative mechanism underlying tissue-specific biallelic expression of imprinted genes
Despite the common canonical examples wherein imprinted genes are monoallelically expressed in all cell types, in certain instances imprinted genes were shown to “escape” parental repression and to exhibit biallelic expression in a tissue-specific manner16,66,67. One notable example is IGF2, which is monoallelically expressed in most tissues, but is expressed in the liver from both maternal and paternal alleles16 (Fig. 8A). The mechanisms underlying the parent-of-origin regulation of IGF2 are well studied – in the paternal allele, the primary iDMR is methylated to prevent binding of the insulation factor CTCF, thus allowing IGF2 activation by distal enhancers. Conversely, the maternal allele is unmethylated and CTCF is bound, leading to distal activation of H19, but not IGF266,68 (Fig. 8B). However, the regulatory mechanisms underlying biallelic expression of IGF2 in the liver have not been elucidated66,68.

A Allele-specific read counts for IGF2 (GTEx) show expression of either the A (X-axis) or B (Y-axis) alleles (blue dots). Conversely, mRNA from liver cells (red) show a diagonal, 1:1 allelic ratio, consistent with liver-specific escape of imprinting. B Known imprinting control mechanism for IGF2/H19. In the paternal allele (top), methylated CpGs (black lollipops) prevent CTCF from binding the iDMR, facilitating the activation of IGF2 by a distal enhancer. Conversely, in the maternal allele CTCF binds as the DMR is unmethylated, acting as an insulator66,68. We propose a mechanism by which liver-specific enhancers activate IGF2 in both maternal and paternal alleles, thus escaping maternal imprinting. C Genomic view of the H19/IGF2 locus. The putative liver enhancers (highlighted in blue) show strong H3K4me1 and H3K27ac ChIP-seq peaks in adult liver tissue (green and blue tracks), but not elsewhere. chromHMM adult liver (AL) track shows a putative annotation of this region as active enhancers (yellow). D Fragment-level analysis using our whole-genome methylation atlas shows fully unmethylated fragments (green) in six hepatocyte samples, at two adjacent putative enhancers (black frame), compared to fully methylated fragments in other cell types, where IGF2 is maternally imprinted.
Our data shows bimodal methylation at the IGF2 imprinted DMR across all samples (Fig. 3A, B) including hepatocytes, suggesting that a different mechanism is underlying liver-specific maternal activation. We identified two genomic regions in the vicinity of IGF2 that are fully unmethylated in hepatocytes (in both alleles) but are fully methylated elsewhere in the human body3. These two putative enhancers are also characterized by enhancer-specific chromatin marks (H3K4me1 and H3K27ac), and were annotated as putative liver enhancers by chromHMM69,70.
These findings suggest the presence of liver-specific enhancers that activate IGF2 specifically in the liver, including in the otherwise silenced maternal allele, thus overriding iDMR-driven maternal allele repression (Fig. 8B–D). Based on this example, we developed a computational score to compare allele-specific gene expression data56 with the presence of differentially unmethylated neighboring regions, and identified putative cell-type-specific enhancers for 34 imprinted genes (Data S16), suggesting a general mechanism for tissue-specific escape from parental imprinting.
Discussion
We describe here a comprehensive atlas of allele-specific DNA methylation in all major human cell types, based on deep whole-genome bisulfite sequencing of DNA from freshly isolated cells. A unique strength of this atlas is that it is based on DNA from purified cell types, allowing identification of bimodal methylation patterns that are due to within-cell-type phenomena, rather than cell mixture effects.
Overall, we identified 325k genomic loci that exhibit bimodal methylation patterns in at least one sample, covering 5.7% of the genome and 11% of CpGs (average of 2.45% of CpGs in bimodal regions, per sample). We observed differences in bimodality both between and within-cell types, due to cell-type-specific effects in parental allele-specific methylation, as well as genetic differences between individuals in regions associated with sequence-dependent allele-specific methylation. In 10% of bimodal regions (34k loci), we were able to identify SNPs that segregate with methylation, demonstrating allele-specific methylation. The remaining loci may feature allele-specific methylation with distant sequence determinants that cannot be captured with short-read sequencing, or cases in which one random allele per cell is methylated, similarly to the situation in the mammalian X chromosome14. We were able to identify some definitive examples of the latter (i.e. bimodal methylation that is neither parental nor allele-specific), therefore the scope of this phenomenon remains to be determined. Additionally, it is possible that in some of our purified samples there are hidden sub-types of cells that harbor distinct methylation patterns (e.g. different types of pancreatic beta cells, all expressing insulin).
The comprehensive catalog of allele-specific and parental ASM presented here is consistent with previously published maps of parentally-derived ASM7,15,31,32. The main differences we present stem from our use of homogenous samples of various purified cell types, deeply sequenced across multiple donors and cell types. Two previous studies utilized samples with uniparental disomy and conducted bisulfite sequencing from blood to collectively discover 92 parental-ASM regions31,32. Of the 36 regions identified by32 we classified all 36 as bimodal, with 32 supported by SNPs indicating parental ASM31. Identified 79 regions, of which we classified 76 as bimodal, with 44 supported by heterozygous SNPs in our samples. A more recent study utilized a WGBS blood dataset consisting of 285 samples with complete parent-of-origin genetic information for over 1.9 million SNPs15, and identified regions of parental ASM. 76% of these (174/229) were recognized as bimodal in our atlas, and 85 regions had enough samples with heterozygous SNPs to be classified as parental ASM. The remaining 55 regions did not pass our strict threshold for statistical significance for bimodality. Thus our atlas reproduces most regions identified by previous studies in blood cell types, and highlights the importance of studying allele-specific methylation in a variety of cell types.
The association of methylation patterns with SNPs allowed us to identify 460 genomic regions with putative parental ASM. Reassuringly, most known imprinted DMRs—loci with parentally determined allele-specific methylation and regulatory involvement – are present in this list (45/55). In addition, 78 of the loci we discovered are associated with known imprinted genes, providing a putative mechanism of regulation, and 14 loci reside in vicinity to known imprinted DMRs (up to 100Kb). The remaining 373 loci represent a comprehensive landscape of parental allele-specific methylation. We validated one such locus, showing parentally-associated allelic differences in epithelial—but not blood—cells, using trio analysis in swab samples. The validated region is in the first intron of CHD7, in which heterozygous mutations are causal for CHARGE syndrome. This developmental disorder is associated with defects in the neural crest, a transient embryonic structure. Strikingly, there is evidence of CHARGE syndrome being paternally inherited47. Further work is needed to validate whether CHD7 expression is imprinted and whether the discovered region is involved in its regulation. Further, the validation of this methodology and the existence of tongue epithelium-specific parental ASM markers exemplify the plausibility of using tongue swabs to detect congenital imprinting-related disease. To date, only screens using blood samples have been developed27.
The substantial number of loci with putative parental allele-specific methylation allowed us to characterize these regions, revealing enrichment for regulatory regions (bearing chromatin marks of enhancers and promoters) and for polycomb targets, consistent with a role in regulation of monoallelic expression of nearby genes. Putative parental ASM loci also tend to reside near origins of DNA replication, raising the testable hypothesis that parent-of-origin dependent asynchronous DNA replication controls parent-of-origin-dependent allele-specific methylation71,72. Further analysis is required to investigate the relationship between cell-type-specific allele-specific methylation and cell-type-specific asynchronous DNA replication. While the replication origins we analyzed are from erythroblasts, similar enrichment was obtained for other replication datasets.
One striking phenomenon emerging from the atlas is tissue-specific escape from imprinting. Previous studies of imprinting mostly focused on blood cells, and assumed that parental imprinting in the gametes persists in all tissues19,20,21,22. The presence of multiple rarely studied cell types in the atlas exposed the fact that many loci with parent-of-origin determined methylation (including almost a quarter of known iDMRs, 13/55) escape mono-allelic methylation and become fully methylated or fully unmethylated in specific cell types. The biological significance of this fascinating phenomenon and the underlying molecular mechanisms likely vary, depending on the affected gene and cell types. Our analysis of selected cases suggests one way by which specific cell types may overcome monoallelic expression imposed by parent-of-origin-dependent methylation. As we showed for IGF2, the presence of a tissue-specific enhancer near the gene (in this case, a proximal enhancer that is fully unmethylated only in hepatocytes) likely allows expression from both alleles, despite monoallelic availability of the remote enhancer. Clinically, our findings suggest that tissue-specific ASM may represent a previously unknown mechanism for autosomal dominant diseases that do not show imprinting in blood.
The comprehensive atlas of parental and sequence-dependent ASM in a variety of human cell types provides a platform for additional computational and molecular analysis, to address the fundamental questions of how, why, and to which extent cells distinguish between different alleles of the same gene, a phenomenon with important biological and clinical implications.
Methods
Experimental model and study participant details
WGBS data were sequenced at 150 bp paired-end reads, with an average of 984 million pairs per sample, mapped to the Human genome (hg19), and analyzed using the wgbstools39 (github.com/nloyfer/wgbs_tools) as described in Loyfer et al.3.
The clinical study of the trios was approved by the ethics committee of the Hadassah Medical Center. Procedures were performed in accordance with the Declaration of Helsinki (HMO-0198-14). Swab sampling donors have provided written informed consent. Participant details are provided in Data S5. There was no selection criteria to reject participants.
DNA processing and analysis
Swab samples were collected with an inoculating loop by swabbing it against the tongue of healthy donors for 20 s and breaking the inoculating loop into a 2 ml Eppendorf tube with 200 μl of PBS. The sample was saved in a freezer at −20C until extraction. DNA extraction was performed via DNeasy Blood and tissue kit (QIAGEN) according to the manufacturer’s instructions with the following change: incubation time of AL buffer was performed overnight. The DNA concentration was measured using Qubit High Sensitivity double-strand molecular probes (Invitrogen) and bisulfite treatment (Zymo). Bisulfite-treated DNA was PCR amplified using primers (Data S6) specific for bisulfite-treated DNA but independent of methylation status at monitored CpG sites or genotype. We used a multiplex 2-step PCR protocol as described in Neiman et al.73. Pooled PCR products were subjected to multiplex NGS using the NextSeq 500/550v2 Reagent Kit (Illumina). Sequenced reads were separated by barcode, aligned to the target sequence, and analyzed using custom scripts written and implemented in R. Reads were quality filtered based on Illumina quality scores. Reads were identified by having at least 80% similarity to target sequences and containing all the expected CpGs in the sequence. CpGs were considered methylated if “C” was read at a CpG site and were considered unmethylated if “T” was read. The efficiency of bisulfite conversion was assessed by analyzing the methylation of non-CpG cytosines. We then determined the fraction of molecules in which all CpG sites were unmethylated. Further ASM analysis was similar to those of the WGBS samples. Reads were segregated by genotype at SNP rs7826035 (C/T, chr8:61627312, Data S6). As this SNP is a C/T variant, only bottom-strand reads are considered. Tongue swab samples contain a mix of blood and tongue-epithelial cells. Since the novel region detected is biallelically methylated in blood cells we verified that unmethylated fragments (which must come from tongue-epithelial cells) always contained the paternal genotype. Alleles are required to contain ≥1000 sequenced reads (per sample), and samples with ≥40% for each allele were considered heterozygous. We classified children as exhibiting paternal-specific demethylation if over 95% of unmethylated fragments contained the paternal genotype (Data S7).
Raw sequencing counts, split by sample/allele are included in Data S17. Gzipped files are named as “[Trio_ID][Member_code].chr8:61627312.[Geno].pat.gz”, where Trio_ID is indicative of family, Member_code is A for father, B for mother, and C[0-9] for child ID. Reads were split by genotype (C or T), after which only CpG sites are retained in a tab-separated .pat format (from wgbstools, https://github.com/nloyfer/wgbs_tools), including chromosome, genomic CpG index of first CpGs in pattern, binary methylation pattern (C = meth, T = unmeth, . = N/A), and number of sequenced reads showing that pattern.
chr8 12699028 CC.CCC 1
chr8 12699028 CCCCCC 49
chr8 12699028 CCCCTC 3
chr8 12699028 TTTTTT 5
Data and identification of bimodal methylation regions
Sequenced read pairs were then merged, and classified as hyper-methylated (M) if covering three CpGs or more, with an average methylation (per fragment) ≥65%. Similarly, hypo-methylated (U) fragments were defined as having average methylation ≤ 35%. Fragments with less than 3 CpG sites are ignored, and the remaining fragments, with an avg. methylation of (35%-65%), were classified as mixed (X). For each CpG site, we calculated the {U,X,M} proportions across all overlapping fragments with ≥3 CpGs. Bimodal regions were then defined as contiguous regions (≥5 CpGs) where the proportion of both hyper- and hypo-methylated fragments (i.e., U, M) is ≥ 20%.
We then devised a statistical test to distinguish between a null hypothesis model H0 of one epi-allele (possibly showing ~50% methylation, on average), vs. a mixture model H1 of two equally likely epi-alleles (A, B), corresponding to DNA fragments originating from the methylated and the unmethylated alleles. Both models assume conditional independence between neighboring CpGs, and model the expected methylation at the i’th CpG (for a given epiallele) using a Bernoulli parameter (Pleft({r}_{i}{|epiallele}right)) where ({r}_{i}) is an indicator for whether the DNA fragment r shows that CpG i is methylated. For H0, these probabilities could be estimated using a maximum likelihood estimator, based on the empirical probability of methylation at the i’th CpG (beta value). For H1, we used the expectation-maximization (EM) algorithm, to iteratively infer the posterior probability that each fragment r is associated with each epiallele (Pr left({A|r}right)), (Pr left({B|r}right)), and estimated the expected methylation (Pleft({r}_{i}{|A}right)), (Pleft({r}_{i}{|B}right)) of each CpG i given the two epialleles.
In H0 we define the probability to be methylated at CpG i as: ({theta }_{i}).
Thus, the likelihood of one region, based on H0, could be viewed as the product of likelihood across all fragments as in Eq. 1:
Alternatively, based on H1 where the probability to be methylated at CpG i on allele A is ({{theta }^{1}}_{i}) and on allele B is ({{theta }_{i}}^{2}), the likelihood could be described as in Eq. 2:
We infer the posterior probability (Pleft({A|r}right)) per read. We assign each read to an allele by choosing the allele with the maximum posterior probability (hard assignment). We then calculate the expected methylation probability per CpG, for each of the A or B epialleles (expected counts).
Finally, we applied a log-likelihood ratio test to estimate the statistical significance of each bimodal region (comparing the two-epiallele mixture model H1 with the nested, single-epiallele, H0 model), using the software package wgbstools (test_bimodal function)39. p values were then corrected for multiple hypotheses using the Benjamini-Hochberg FDR correction scheme74.
To further extend identified bimodal regions beyond domains of densely located CpG (resulting with sequenced fragments covering ≥3 CpGs), we allow expansion into flanking regions, as bimodality is maintained (namely, while both hypo- and hyper-methylated fragments are ≥20%).
This computational procedure was applied to each sample independently, to account for genetic and environmental changes. We then set the start and end position of each bimodal region to the closest methylation block boundary, as determined using a genome-wide segmentation of the genome, using the wgbstools package as described in Loyfer et al.3,39.
Allele-specific methylation
To associate bimodal regions with two independent allele-specific methylation (ASM) patterns, we integrated these regions with 1,360,985 SNPs showing a minor allele frequency (MAF) ≥ 1%, using GnomAD46 data (Ashkenazi Jewish population). For each such SNP, we retained the heterozygous samples (≥5 fragments from each allele), and built a contingency table comparing the number of U/X/M fragments (≥3CpGs) from each individual genotype. Fisher’s exact test was then used to test for association between allele and methylation patterns, followed by Benjamini-Hochberg FDR correction74 (Data S3).
Sequence-dependent and parent-of-origins ASMs
Once allele-specific methylation (ASM) was identified, per sample, we performed a broad cross-sample analysis to test for sequence-dependent (SD-ASM) and parent-of-origin effects. For SD-ASM, all samples (of a given cell type, or in general) are expected to show concordance between genotype and methylation. That is, regardless of donor heterozygosity, all fragments from a given allele (genotype) are expected to be methylated, whereas fragments from the alternative allele are not. Conversely, parent-of-origin effects are expected to show bimodality regardless of heterozygosity, and switch alleles between unrelated donors. Specifically, we require ≥3 samples to exhibit ASM and that the association between genotype and hyper/hypo methylation switch across samples. Thus if one sample allele A is associated with unmethylated epialleles and in another sample allele A is associated with methylated epialleles, the region is classified as putatively parent-or-origin derived ASM, as opposed to SD-ASM. Parental ASMs were defined as novel if they were not identified in the previous studies of Zink et al., Court et al., and Joshi et al.15,31,32.
Gene enrichment analysis
These putative parent-of-origin ASM regions were compared against all imprinted genes, as reported by Tucci et al.75, as well as known imprinted DMRs (iDMRs) from Monk et al.28. For the definition of promoters, bivalent enhancers, and polycomb repressive we used chromHMM genomic annotations76. Each type was merged (“bedtools merge”) across all cell types. Active regulatory elements were determined using H3K27ac ChIP-seq data52. Origins of replication and S/G1 ratio bedGraph files were taken from Mukhopadhyay et al. 53. Statistical enrichment was estimated by intersecting the merged annotation track with the list of putative parental-ASM regions (“bedtools intersect”). Statistical significance was estimated using a two-tailed permutation test of 100 randomized length-preserving chromosome-wide shuffles, fitted using a Normal distribution.
Identifying biased allelic expression
Allele-specific expression data from GTEx (https://gtexportal.org/home/datasets, v8 phASER haplotype matrix) was used. For each gene, a background noise model was applied by fitting a Normal distribution for the A vs. B allele-specific read count, at discrete bins of expression levels (100–150 read counts, 150–200, 200–250, etc. Samples below a total of 100 reads per gene were discarded). We then calculated the fraction of reads in the expressed allele, and fit a Normal distribution for each bin. A gene with expressed allele fraction ≥3 standard deviations above the mean of genes in its bin was classified as showing allelic bias in that sample.
Associating tissue-specific allelic bias with bimodal methylation
Using the allele-specific read count data from GTEx, we classified a tissue/gene pair as showing allelic bias if ≥25% of samples in that tissue show allelic bias. Cell-type-specific bimodality was defined as genomic regions for which ≥90% of sequenced samples are classified as bimodal. We identified 2246 such genes. GTEx tissues and our purified cell types were matched across 23 tissues/cell types, and the mutual information across genes with allelic expression and bimodal regions (≤250Kb away) was computed. We compared the number of genes identified to what happens at random using permutation testing (two-tailed). We selected 2246 genes at random and counted the number which were near (≤250Kb away) parental ASM regions with bimodal patterns in matching cell types as those exhibiting bias. We ran 50 iterations of random permutations. GTEx tissue type were compared to our cell type, as follows (GTEx vs Atlas names): Blood: Blood-Mono+Macro; Blood Vessel: Vascular endo..; Brain: Neuron; Breast: Breast-Basal-Ep; Colon: Colon-Ep; Heart: Heart-Cardio; Kidney: Kidney-Ep; Liver: Liver-Hep; Lung: Lung-Ep-Alveo; Pancreas: Pancreas-Acinar; Prostate: Prostate-Ep; Small Intestine: Small-Int-Ep; Stomach: Gastric-Ep.
Associating parental ASM and parent-of-origin phenotypes
Parental GWAS data was downloaded from Hofmeister et al. 48. We used a threshold of 1E-5 on the general GWAS additive model. We then required that the significant parental association have a p value < 5E-4 and the non-significant parental association have a p value ≥ 0.1.
Escape from imprinted expression mechanisms
For every imprinted gene we find those which exhibit biallelic expression in at least one tissue type. Each gene/sample is classified as biallelically expressed if the allelic bias is within one standard deviation of the noise model described above. Tissue/gene pairs are classified as biallelically expressed if at least 25% of samples show biallelic expression. For each such gene/tissue we search for hypomethylated DMRs using wgbstools’ find_markers command with the following parameters: “–min_cpg 5 –delta_quants 0.35 –tg_quant 0.15 –bg_quant 0.4”. For our analysis of IGF2 (Fig. 8), ChIP-seq from Roadmap Epigenomics’ Adult Liver was used (H3K27ac and H3K4me1 from Donor 3, DNA_Lib 1057)69, as well as chromHMM primary annotations for Adult Liver70.
Quantification and statistical analysis
Quantification of bimodal regions, ASM, and putative parent-of-origin ASM are described above. Bimodal regions are detected using the EM algorithm to fit model parameters and then a log odds ratio test is used to determine significance (described above). FDR is used to correct for multiple hypothesis testing, with a threshold of 0.05. For ASM analysis, Fisher’s exact test is used to determine significance of ASM with an FDR threshold of 0.1. All regions and their significance can be found in Data S1 and Data S3. Enrichment analysis used permutation testing, as described above, with an FDR threshold of 0.05.
Reporting summary
Further information on research design is available in the Nature Portfolio Reporting Summary linked to this article.
Responses