Augmented BindingNet dataset for enhanced ligand binding pose predictions using deep learning

Introduction
Protein-ligand binding complex structures play a fundamental role in drug discovery by revealing atomic interactions between proteins and ligands. These structural insights are critical for identifying novel hits, analyzing structure-activity relationships (SAR), and optimizing hit compounds for improved efficacy1,2,3. Moreover, large and diverse protein-ligand complex datasets significantly enhance deep learning (DL) model training for tasks such as binding pose prediction, binding affinity prediction, and molecule generation4,5,6,7,8,9. Despite these advantages, the availability of high-quality complex structures remains limited.
In the realm of protein-ligand interactions, Protein Data Bank (PDB) stands out the largest repository containing experimentally determined structures, which is updated weekly. The most recent version (September 8, 2024) comprises as many as 224,572 structures10. However, it is important to note that PDB primarily focuses on biomolecule structures, with only 44,234 small molecules listed in the chemical component dictionary as of September 8, 2024. These limitation underscores the vastness of chemical space occupied by small molecules (~1060)11. In addition, PDB does not directly associate experimental binding affinity data for complex structures, necessitating the manually curated datasets such as Binding MOAD12,13, PDBbind4, and PDBbind+ for detailed binding affinity annotations (Table 1). The latest Binding MOAD release (2020) comprises 41,409 protein-ligand complex structures, with 36.76% annotated with binding affinities. Similarly, the latest PDBbind+ (v2021) dataset includes 22,920 structures, each associated with corresponding binding affinity. Notably, both PDBbind and Binding MOAD have been extensively utilized for developing data-driven approaches in structure-based virtual screening (SBVS) and related studies14. BioLiP2 is another dataset designed to extract biologically relevant protein-ligand interactions from the PDB15,16. However, it has some limitations, including redundancy and the inclusion of non-drug-like molecules.
To bridge the gap when experimental data is scarce and absent, protein-ligand complex structures can be computationally constructed via molecular docking and template-based modeling approaches, including CrossDocked 202017, NLDB18, eMoldel-BDB19, HelixDock6, SIU20, and BindingNet v1 datasets21. Both eModel-BDB and BindingNet v1 datasets modeled 3D structures for protein-ligand pairs from BindingDB and ChEMBL databases using experimentally-determined structures as templates. However, eModel-BDB suffers from steric clashes between modeled ligands and proteins, indicating unreliable protein-ligand interactions21. Additionally, it has not been updated since 2018. Nevertheless, these datasets collectively empower the exploration of protein-ligand interactions, facilitating the development of DL-based approaches.
While experimental structural data remains limited, a wealth of experimental binding affinity data between proteins and drug-like molecules is available on open-source platforms. For instance, ChEMBL (v34) collects 20.7 million activity data for 2.4 million compounds and 15,598 targets22. PubChem’s BioAssay database houses 295 million bioactivity data points as of September 202423. BindingDB provides 2.9 million binding data for 9,300 targets by September 202424. Furthermore, significant efforts have been made to clean and standardize these datasets, such as Papyrus25, MolData26, and the work of Daniel Merk et al. 27.
To bridge the gap between binding affinity and structural data, our project focuses on modeling all the potential protein-ligand complex structures with available experimental binding affinities. In our previous work, BindingNet v1 constructed 69,816 high-quality 3D structures for protein-ligand pairs from ChEMBL, using a comparative complex structure modeling approach21. Since the quality of the modeled structure is highly related to the similarity between the compounds of interest and the crystal ligand templates, we only considered active compounds with a highly similar template (Tanimoto coefficient (Tc) > 0.7) for inclusion in the BindingNet v1 dataset.
Our current study aims to improve the comparative modeling approach to yield reasonable complex structures for compounds without highly similar templates. Not only do compounds with similar chemotypes share common binding mode against the same target28,29, but distinct ligands without common substructures can exhibit similar binding modes due to pharmacophore and molecular shape similarities30. These nuances are crucial considerations in virtual screening practices31. To achieve this, we revamped our previous template-based modeling workflow by incorporating pharmacophore and shape similarities to the crystal templates, resulting in a hierarchal template-based complex structure modeling pipeline. As a result, our updated BindingNet v2 dataset comprises 689,796 modeled protein-ligand binding complexes across 1794 targets. These structures are categorized into high confidence (33.63%), moderate confidence (23.91%), and low confidence (42.45%) structures based on the degree of match.
While recent DL models have achieved outstanding protein-ligand binding pose generation capacity on the PoseBusters dataset6,32,33,34, these models are primarily evaluated using a lenient time-based data splitting method, raising serious concerns about their true predictive on novel ligands and pockets. Our findings reveal that Uni-Mol model achieved only a 38.55% success rate (ligand RMSD < 2 Å) for novel ligands (Tc < 0.3) when trained with PDBbind dataset. Encouragingly, this generalization ability was consistently improved when trained with larger subsets of BindingNet v2 dataset, with success rates increasing from 38.55% to 54.21%, 57.71%, and ultimately 64.25%. Specifically, when combined with a physics-based refinement and rescoring method, Uni-Mol model’s generalization ability further increased to a success rate of 74.07%, while also passing PoseBusters validity (PB-valid) checks. In summary, our study highlights the promise of leveraging a larger and more diverse set of modeled protein-ligand complex structures to enhance DL models in protein-ligand binding prediction.
Results
Comparative analysis of sampling ability
Both hierarchal template-based modeling and molecular docking approaches commence with sampling ligand conformations, followed by scoring to identify the near-native binding poses. The ability of an algorithm to generate accurate ligand binding poses is crucial for precisely modeling protein-ligand complex structures. Our analysis consistently showed that the sampling capabilities of our approach and Glide were correlated with template similarity, demonstrating improved performance when similar templates or pockets were employed (Fig. 1A). Specifically, the hierarchal template-based modeling with minimization approach achieved a success rate of 92.65% when highly similar templates (MCS coverage > 0.8) were utilized, but this rate dropped to 66.67% with less similar templates. Similarly, the success rate of Glide cross-dock (Tc) decreased from 75.00% to 57.33% when less similar pockets were used.

A The sampling success rate is defined as any ligand RMSD less than 2.0 Å. “Superimposition without minimization” and “Superimposition with minimization” represent the hierarchal template-based modeling approach without and with MM-GB/SA minimization. The numbers in brackets indicate the count of benchmarking systems within each MCS coverage interval. B The scoring success rate is defined as the top 1 ligand RMSD less than 2.0 Å. The descriptions before and after “/” denote the sampling and scoring algorithms. “Superimposition” refers to the hierarchal template-based modeling approach with MM-GB/SA minimization. The red dashed lines represent the sampling success rates of different sampling methods. C The plot illustrates the relationship among ligand RMSDs, hybrid scores, and MCS coverages. The labels represent the scoring success rates within different hybrid score intervals.
However, the hierarchal template-based modeling approach still outperformed both Glide cross-dock (Tc) and Glide cross-dock (MCS) methods across all MCS coverage intervals (Fig. 1A). In addition, our approach sampled fewer than 20 conformations per compound, roughly one-tenth of the Glide sampling size (Table S1). The disparity in sampling accuracy between our approaches with and without MM-GB/SA minimization was minimal when MCS coverage was above 0.6. However, this gap widens as template similarity decreases, highlighting the essential role of MM-GB/SA minimization in our protocol.
Comparative analysis of scoring performance
After ligand conformation sampling, an accurate scoring function is employed to select native-like binding poses. In our experiments, we evaluated the accuracy of the top-ranked binding poses across four combinations of various sampling methods (hierarchal template-based modeling with minimization, Glide cross-dock (Tc), Glide cross-dock (MCS)) and different scoring methods (hybrid score, MM-GB/SA, and Glide score).
Despite their excellent sampling capabilities, all approaches witnessed a significant drop in pose selection accuracy (Fig. 1B and Table S2). Overall, the hierarchal template-based modeling with MM-GB/SA approach correctly sampled 77.78% complex structures, with 56.46% precisely scored by hybrid score. This rate decreased to 38.14% when using Glide cross-dock (Tc) and Glide scores (Fig. 1B and Table S2).
We observed that hybrid scores consistently outperformed the MM-GB/SA interaction energy scores in ranking ligand binding poses, especially when MCS coverages were below 0.6. Additionally, there was also a noticeable reduction in ligand RMSDs with higher hybrid scores (Fig. 1C). Compounds with an MCS coverage over 0.8 typically exhibited hybrid scores above 1.2 and RMSDs within 2.0 Å (Fig. 1C).
As a result, we selected the hybrid score as our scoring function within the hierarchal template-based modeling workflow and as our measure of confidence. We defined high confidence complex structures as having a hybrid score of at least 1.2, moderate confidence as having a hybrid score between 1.0 (inclusive) and 1.2, and low confidence as having a hybrid score below 1.0. The success rates (ligand RMSDs < 2 Å) for top 1 binding pose were 73.79%, 33.33%, and 16.22% for high, moderate, and low confidence structures, respectively (Fig. 1C).
Case studies
In the following, we explored scenarios where templates with lower ligand similarities and lower MCS coverages remained valuable for modeling near-native binding poses. In BindingNet v1, only the active compounds with a highly similar (Tc > 0.7) template were considered in the pursuit of high-quality modeled complex structures21. However, compounds with low topological fingerprint similarity could also feature similar functional groups and scaffolds, as illustrated in Fig. 2A-B. Specifically, the Tc value was 0.38 for the candidate compound and template ligand in the case of dipeptidyl peptidase-4, but both compounds characterized methylamine-substituted aromatic heterocycles, which played roles in forming charge-charge, hydrogen bonding, and cation-π interactions with proteins. The resulting top-ranked pose achieved an RMSD of 1.12 Å and a hybrid score of 1.47 (Fig. 2A). Similarly in the component factor D, although the Tc value was low, critical amide groups helped the candidate compound to model the near-native binding pose by maintaining the hydrogen bonding interactions with the protein backbone (Fig. 2B).
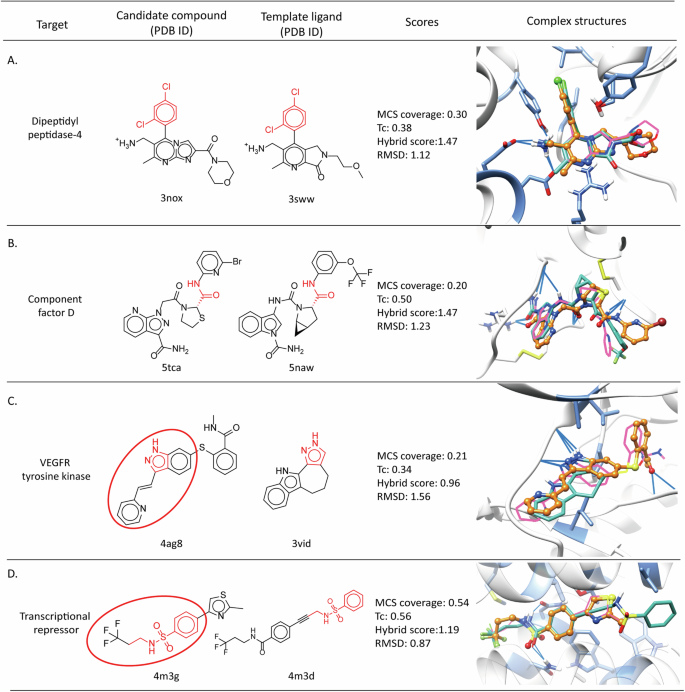
Chemical and complex structures of candidate compounds and template ligands for (A) dpeptidyl peptidase-4, (B) component factor D, (C) VEGFR tyrosine kinase, and (D) transcriptional repressor. The crystal binding poses are colored in pink for candidate compounds and in sea green for template ligands, while the modeled poses are colored in orange. The MCS between candidate compounds and templates are highlighted in red in the chemical structures. The substructures encircled in red represent the fragments of the candidate compound post-fragmentation. Images of complex structures are rendered in CHIMERA47.
In another case, our fragmentation strategy successfully yielded a near-native binding pose, even when functional groups were less similar. Specifically, a fragment from the candidate compound (highlighted in Fig. 2C) was superimposed onto the template through crucial hydrogen bonds with kinase backbone. After sampling the benzamide group and minimizing the structure, the top-ranked pose showed an RMSD of 1.56 Å and a hybrid score of 0.96 (Fig. 2C). Our protocol avoided relying solely on MCS superimposition because some cases would fail even with moderate MCS overlap. For instance, both the candidate compound and the template featured a benzene sulfonamide moiety, but their positions in the binding site differed (Fig. 2D). Nevertheless, both sulfonamide and amide groups functioned as hydrogen bond acceptors and donors in protein-ligand interactions. By emphasizing shared pharmacophore features, a specific fragment (highlighted in Fig. 2D) of the candidate compound was superimposed onto the template, resulting in a ligand RMSD of 0.87 Å. These findings underpin our comparative modeling approach and highlight the effectiveness of utilizing shape and pharmacophore feature similarities over MCS coverage or ligand topological fingerprint similarity alone.
BindingNet v2 and web server
In addition to refining our comparative modeling approach, we also significantly expanded our template datasets and extracted more protein-ligand pair from updated ChEMBL (v33). Specifically, we augmented our template collection from 8,066 PDB structures in BindingNet v1 to 26,438 PDB structures in this version and collected a total of 724,319 protein-ligand pairs from ChEMBL (v33) leveraging the templates. The detailed selection and filtering process are outlined in the Methods section.
BindingNet v2 now consists of 689,796 complex structures, each associated with an experimental binding affinity. These structures cover 1794 targets and 475,309 unique ligands. Specifically, more than 74% of the targets interact with more than 10 compounds, with 113 (6.2%) targets have a bound small molecule. Additionally, three-quarters of the unique small molecules are bound to a single protein. However, we also discovered 1288 unique molecules that are bound to 10 different proteins (Fig. S1). Figure 3A illustrates the diversity of protein types covered in our dataset, including kinase (21%), enzyme (34%), G-protein coupled receptor (12%), transmembrane signal receptor (9%), nuclear receptor (5%), and ion channel/transporter (3%). To assess the quality of our modeled structures, we classified them as follows: 33.63% scored ≥ 1.2 (high confidence), 23.91% scored between 1.0 and 1.2 (moderate confidence), and 42.45% scored below 1.0 (low confidence) (Fig. 3B).
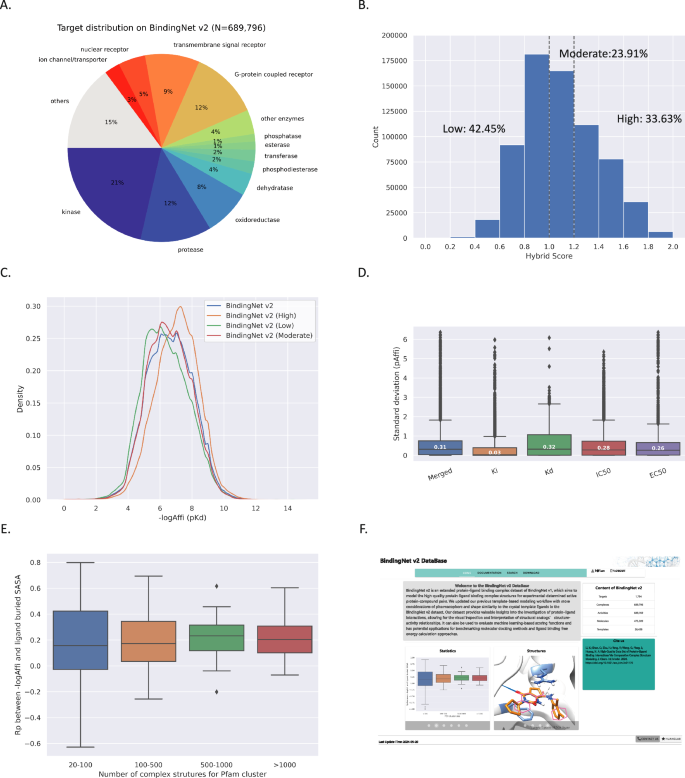
Characteristics of BindingNet v2 (A–D). The distributions of target classification, hybrid scores, and binding affinities of BindingNet v2 dataset, respectively (E). Rps between binding affinities and ligand buried SASA in each Pfam cluster in BindingNet v2. (F). Home page of BindingNet v2 website (http://bindingnetv2.huanglab.org.cn/).
Three subsets demonstrated similar distribution of experimental binding affinities, with most values falling between 10 and 1,000 nM and a small fraction (2.1%) exhibiting values worse than 100 uM (Fig. 3C). We acknowledged that potential noises could arise from varying laboratory practices and assay protocols35. By analyzing IC50, Ki, Kd, and EC50 assays from multiple sources (ChEMBL, BindingDB, and BindingMOAD), we found a standard deviation (std) of 0.3 log unit for binding affinities, with results from Ki assays being more stable than those from other experiments (Fig. 3D). This finding aligned with the work of Gergory A. Landrum et al., who suggested applying maximal curation settings to extract reliable data from various experiments for training and validating DL models35. Nevertheless, care must be taken to use the binding affinity labels in BindingNet v2 directly.
In our previous studies, we observed a positive correlation between binding affinities and the ligand’s buried solvent-accessible surface area (SASA) in the PDBbind v2020 dataset, which misled DL models’ learning on binding affinities36. However, with dataset augmentation, this correlation significantly decreased in both BindingNet v1 and v2 datasets21. In particular, the Pearson correlation coefficients (Rps) were low, mainly around 0.2 for Pfam protein clusters with over 100 complex structures (Fig. 3E). Interestingly, high correlations persisted in protein clusters with less than 100 structures, including tRNA_synt_II, 6_Hairpin, DNA_ligase, and UDG (Fig. S2), emphasizing the need for additional data to elucidate structure-affinity relationships.
BindingNet v2 is accessible at http://bindingnetv2.huanglab.org.cn/, featuring HOME, SEARCH, DOCUMENTATION, and DOWNLOAD interfaces (Fig. 3F). The SEARCH interface allows queries using various identifiers and provides an interactive Mol* view for visualizing atomic protein-ligand interactions. Templates and all subsets of BindingNet v2 are available for download from website.
Training deep learning models using BindingNet v2
The BindingNet v2 dataset serves as a rich resource for providing both modeled protein-ligand complex structures and experimentally determined binding affinities. Beyond these applications, it also plays an important role in developing DL models for binding affinity prediction, binding pose prediction, and molecule generation. Since the accurate prediction of binding affinity heavily relies on correctly determined binding poses, we initially evaluated the capacity of DL models to generate binding poses based on BindingNet v2 dataset.
Commonly used datasets for training DL models include PDBbind, BindingMOAD, PDB, and molecular docking datasets. Remarkably, the performance of DL models on the PoseBusters v1 dataset significantly surpasses that of traditional molecular docking methods, with high success rates of 62.4% (Uni-Mol v1)32, 77.6% (Uni-Mol Docking v2)33, 85.6% (HelixDock)6, and 90.0% (AlphaFold3 with pocket specified)34. However, commonly used training datasets share highly similar ligands and binding pockets with PoseBusters with a time-based data splitting method37. For example, 70.09% and 34.11% of the ligands in the PoseBusters v1 possess a highly similar (Tc > 0.7) counterpart within PDB (v2019) and PDBbind (v2020) training datasets (Figs. 4A and S3). In addition, more than 90% testing ligands possess a corresponding training ligand with Tc value larger than 0.3 from PDB (v2019) and PDBbind (v2020). As a Tc value between 0.3 and 0.4 is a generally-used cutoff for selecting novel ligands in SBVS practices1,38,39,40,41,42, we conducted ligand similarity-based data splitting method to evaluate the generalization ability of the Uni-Mol model. Figure 4B illustrates a notable trend: as the ligand similarity of the training dataset decreased from 1.0 to 0.3, the success rate (ligand RMSD < 2 Å) of Uni-Mol model significantly decreased from 60.98% to 38.55%, with only 10.98% ligands achieved a pose within 1 Å (Fig. 4B).
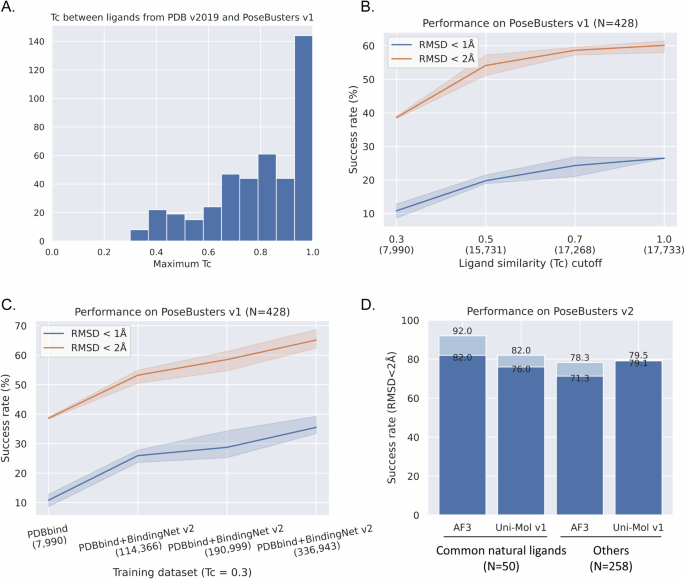
A The maximum Tc values between the ligands from PoseBusters v1 and PDB (v2019) datasets. B The pose generation ability of Uni-Mol training with different ligand similarity cutoffs on PDBbind (v2020). C The pose generation ability of Uni-Mol model training with larger datasets. D PoseBusters v2 structural accuracy and chemical validity of AlphaFold3 (AF3) and Uni-Mol trained on PDBbind + BindingNet v2 (Tc = 0.3). The numbers represent the percentage of ligands within RMSD <2 Å and passing PoseBusters validity checks.
To address this, we investigated the effect of data augmentation on enhancing generalization ability of Uni-Mol model. Importantly, only the complex structures with a dissimilar ligand (Tc < 0.3) from BindingNet v2 were included, resulting in the size of training datasets increased by approximately 14, 24, and 42 times from the PDBbind (v2020) (Table 2). Encouragingly, the success rates (ligand RMSD < 2 Å) significantly improved from 38.55%, 54.21%, 57.71% to 64.25%. Moreover, the success rate of generating a ligand RMSD within 1 Å increase by approximately threefold, rising from 10.98% to 33.87% (Fig. 4C).
The chemical and physical plausibility of generated binding poses is another great concern for DL-based approaches43. When analyzed the PoseBusters validity of the poses generated from the best Uni-Mol model, we found most of the ligands passed the intramolecular validity assessments. However, 40.89% ligands failed the intermolecular validity check due to severe steric clashes with proteins, cofactors, and metals (Fig. S4). The success rate of RMSD < 2 Å decreased from 68.69% to 51.41% after applying the PoseBusters validity filter.
Combining MM-GB/SA refinement and rescoring approach to select the best pose, the PB-valid ratio significantly improved to 51.41% and 74.07% for ligand RMSDs within 1 Å and 2 Å, respectively (Fig. S5). Moreover, when we categorized PoseBusters v2 testing dataset into common natural ligands (containing 50 ligands, mainly cofactors and crystallization aids) and others (containing 258 drug-like ligands)34, the performance of the Uni-Mol models trained on the PDBbind+BindingNet v2 (Tc = 0.3) dataset exceeded that of the published AlphaFold3 model on the PoseBusters drug-like ligand dataset, with success rates of 79.1% and 71.3%, respectively. This demonstrated a superior capacity for accurately modeling the poses of drug-like ligands compared to AlphaFold3 (Fig. 4D).
We conclude that a dataset containing extensive and diverse proteins and ligands is promising for boosting the generalization ability of DL models. However, while Uni-Mol model captures the coarse-grained distance distributions between proteins and ligands, physical-based methods are necessary to ensure chemical and physical plausibility.
Discussion
Protein-ligand complex structures serve as the foundation for structure-based drug discovery. However, relying solely on experimental methods to acquire structures is impractical. In this study, we adopted an enhanced comparative modeling approach to construct reliable protein-ligand complex structures with experimentally-determined binding affinities. Our resulting BindingNet v2 dataset comprises 689,796 complex structures across 1794 protein targets and 475,309 unique ligands.
The BindingNet v2 dataset is designed for mining protein-ligand interactions, analyzing large-scale SAR, and developing computational approaches for predicting protein-ligand interactions. In practical SBVS applications, the main challenge is to discover true binders with novel chemical scaffolds, where a Tc value of 0.3-0.4 is widely used as a novelty criterion1,38,39,40,41,42. Unfortunately, few studies carefully apply this criterion to access the performance of DL-based models41. After selecting complexes with dissimilar ligands to PoseBusters ligands (Tc less than 0.3), we found that Uni-Mol models trained on PDBbind exhibited poor generalization ability in predicting binding poses for novel ligands. To address this issue, we evaluated the impact of data augmentation on generalization ability. By augmenting the training datasets with complex structures from BindingNet v2, the pose prediction success rate (ligand RMSD < 2 Å) increased from 38.55% to 64.25%. Post-processing using a physics-based minimization tool further improved the success rate to 74.07% (RMSD < 2 Å and PB-valid) on PoseBusters v1 dataset.
While the BindingNet v2 dataset shows promise, its ligand diversity is still far lower than that of drug-like molecules. Additionally, the types of proteins are limited to those with experimental complex structures from PDB. Inspired by successful approaches like AlphaFold series34,44, we can envision to combine large-scale docking data, distillation data, manually modeled structures, and crystal structures together to build a model capturing more general and diverse protein-ligand interactions. This model would enable us to expand the coverage of chemical and target space and enhance the generalization ability of DL models.
BindingNet v2 provides a unique advantage—the availability of experimental binding affinities for 689,796 complex structures. Investigating the impact of training models with BindingNet v2 on protein-ligand binding affinity prediction is definitely a future research direction. However, it is essential to acknowledge that our dataset currently only modeled the complex structures between reported and experimentally evaluated proteins and ligands, where only a small fraction (2.1%) complex structures demonstrating binding affinities worse than 100 uM. This distribution is significantly different from those observed in actual SBVS scenarios, indicating incorporating inactive data is crucial for improving the models’ virtual screening capabilities. Therefore, future work will focus on integrating inactive data to enhance the virtual screening capabilities of our models.
Methods
Template dataset construction
Our template dataset construction began by applying specific selection criteria to the PDB as of August 2023. We focused on structures where the “polymer entity type is protein” and “refinement resolution < 3 Å” and removed complexes formed between biological macromolecules, such as protein-protein and protein-nucleic acids. To ensure the isolation of structures between drug-like molecules and proteins, we compiled a list of special molecules which were not considered as valid drug-like ligands, such as organic solvent molecules, crystallization aids, and biological cofactors/coenzymes commonly observed in PDB. This list was collected from various resources, including literature4, expert knowledge, and data from the PDBe website (Table S3)45. Fragment-based drug discovery typically begins with small fragment that have a molecular weight of about 150 to 300 Dalton (Da). Compounds exceeding 800 Da are generally considered non-drug-like and challenging to model accurately. Therefore, we applied molecular weight and the following criteria to refine our template dataset. Any PDB structure meeting the following condition was discarded: (1) ligand molecule weight less than 200 Dalton (Da) or greater than 800 Da; (2) ligand containing metal elements; (3) covalently bound ligand; (4) incomplete ligand atomic coordinates or (5) ligand identified as a special molecule.
Finally, we mapped the qualified protein-ligand complexes to ChEMBL target IDs using the online tool Retrieve/ID mapping from UniProt46. To simplify the process, we selected only complexes where a compound specifically interacts with a monomeric protein (ChEMBL protein type = “SINGLE PROTEIN”). This stringent selection resulted in a final set of 26,438 protein-ligand binding complexes across 2108 targets.
The complexes belonging to the same protein families were aligned based on the binding pockets using the UCSF Chimera matchmaker toolkit47. All waters and solvent molecules were excluded, while cofactors and metal atoms within the pocket were retained. Finally, the proteins were prepared using Schrödinger Protein Preparation Wizard software for filling side chains and loops and adding hydrogen atoms48. The ligands were processed using UNICON for protonation state prediction49.
Protein-ligand pair extraction
Protein-ligand pairs were extracted from the ChEMBL (v33) dataset based on 2,108 ChEMBL target IDs specified in the template dataset. Specifically, we designated compound as ‘ligand’ only if it exhibited a well-defined potency endpoint, including concentration at 50% inhibition (IC50), half maximal effective concentration (EC50), inhibition constant (Ki), and dissociation constant (Kd). The activity relation was either ‘=’ or ‘<’. When multiple experimental assays were available for a specific target-ligand pair, we prioritize the following: Kd > Ki > IC50 > EC50. If multiple data points existed for a specific assay, we used the median value. To maximize the number of active data points we can model, we excluded compounds with molecular weights below 125 Da. Additionally, we removed those with molecular weights exceeding 800 Da due to the challenges in accurately modeling complex structures of larger compounds. After applying these filters, we retained a total of 724,319 active protein-ligand pairs.
SHAFTS and hybrid score calculation
SHAFTS is a 3D molecular similarity calculation tool50. It identifies six pharmacophore features within molecules, including hydrophobic center, positive charge center, negative charge center, hydrogen bond acceptor, hydrogen bond donor, and aromatic rings. Subsequently, a superimposition of two 3D molecules was performed to maximize the hybrid score, which is a sum of the shape score (measuring shape densities overlap) and feature score (assessing pharmacophore feature congruence). Both scores range from 0 (no similarity) to 1 (identical shapes or features)50.
Hierarchal template-based modeling approach
The hierarchal template-based modeling approach consists of five main steps (Fig. 5): (1) Determination of maximum common substructure (MCS) coverage, (2) Superimposition of key substructure, (3) Sampling of poses, (4) Minimization, and (5) Scoring.
-
(1)
Determination of MCS coverage: The MCS between the compound of interest and each template ligand was calculated using the RDKit rdFMCS module51. MCS coverage is defined as:
$$MCS,coverage=frac{Number,of,heavy,atoms,in,MCS}{Number,of,heavy,atoms,in,compound,of,interest}$$ -
(2)
Superimposition of key substructures: If the largest MCS coverage exceeds 0.6, we assigned the atom coordinates of the MCS as those in the template ligand. For lower coverage, we fragmented the compound using BRICS52, sample it with ConfGen53, superimposed it to each template ligand using SHAFTS50, and retained fragments with a hybrid score larger than 0.7. These MCS and fragments were considered key substructures.
-
(3)
Sampling of poses: During sampling, key substructures’ coordinates were fixed based on superimposition results, and the rest of the compound was sampled using the ETKDG v2 algorithm54. The number of sampled conformations were determined by the number of rotatable bonds in the remaining structure, with a maximum limit of 500 conformations. This was followed by conformation clustering (RMSD < 2 Å), protein-ligand clash filtering, and scoring. The top 20 conformations with the highest hybrid score were processed for minimization.
-
(4)
Minimization: Considering the trade-off between benefits and computational cost, the modeled protein-ligand complex structures were subjected to molecular mechanics combined with generalized Born/solvent-accessible surface area solvation (MM-GB/SA) minimization using the Protein Local Optimization Program (PLOP, version 6.0)55,56,57,58. The binding-site residues within 5.0 Å to the ligand and the loops were made flexible during minimization.
-
(5)
Scoring: Complexes structures with high MM-GB/SA interaction energies ( >100 kcal/mol) were considered with severe steric clashes and discarded. Hybrid scores were recalculated for the remaining conformations, selecting the highest-scored complex as the final model. As the ligand protonation states may alter upon entering a pocket, the protonation states of ligands and proteins were reevaluated together using Schrödinger Protein Preparation Wizard48. For compounds with altered protonation states, we conducted a manual inspection and chose the protonation state that best aligned with the known physicochemical properties of the ligand, such as pKa values and the local environment within the protein binding pocket.
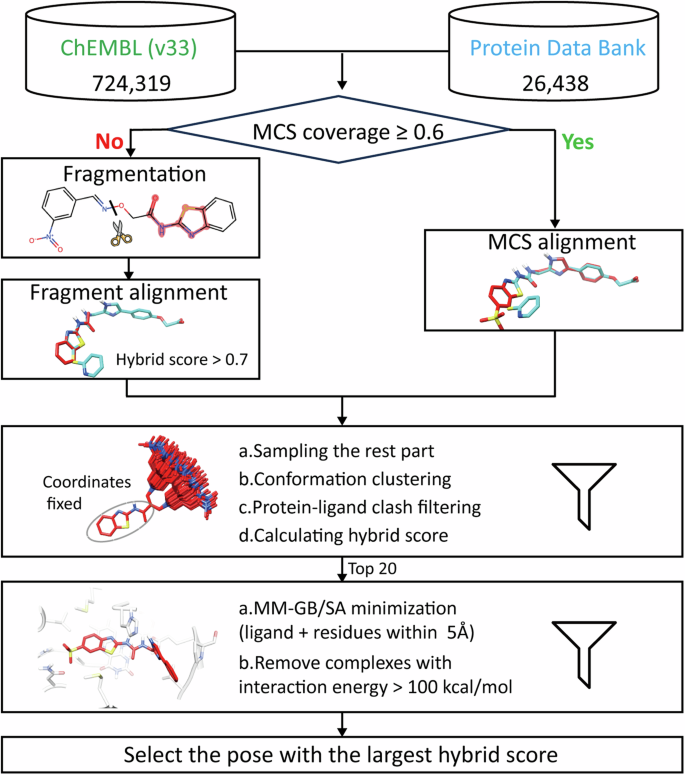
The MCS coverage was calculated between candidate compounds from ChEMBL and template ligands from PDB. If the largest MCS coverage exceeds or equals to 0.6, we assigned the atom coordinates of the MCS as those in the template ligand. Otherwise, the compound was fragmentated and aligned to templates with SHAFTS. The rest part of the compound was sampled, clustered, filtered, and scored, with 20 highest-scored conformations for MM-GB/SA minimization. Hybrid scores were determined again for minimized complex structures and templates, and the highest-scored complex was selected as the final model. Images of 3D structures are rendered with CHIMERA47 and image of 2D structure is generated with RDKit51.
Molecular docking using Glide
For benchmarking, we employed the commercial molecular docking software Glide, given its widespread usage in SBVS59. The initial compound conformations were generated using the LigPrep toolkit from the SMILES strings. The docking box size was set to 15 Å for the inner box and 30 Å for the outer box, with the centers determined by the coordinates of the co-crystal ligands’ centers. We used the standard precision (SP, version 5.0) docking mode for generating up to 500 poses per ligand and set other parameters as default. Recognizing that the efficacy of molecular docking heavily depends on the chosen protein structures, we implemented two different benchmarking settings:
Cross-dock (Tc)
The compounds were docked into the protein structures bound with a co-crystal ligand with the highest Tc relative to the docked compounds. The Tc values were calculated using topological fingerprints by RDKit51.
Cross-dock (MCS)
The compounds were docked into the protein structures bound with a co-crystal ligand containing the largest MCS coverage with the docked compounds.
Benchmarking dataset
To evaluated the accuracy of our hierarchal template-based complex structure modeling approach and molecular docking methods, we curated a benchmarking dataset. We selected crystal structures where various ligands bound to the same target, resulting a total of 333 protein–ligand complex structures for 85 protein targets (Supplementary Data 1). Additionally, we gathered the corresponding template ligands from the same protein within our template dataset for each of the 333 docking compounds. A detailed list of PDB IDs for the benchmarking dataset is provided in Supplementary Data 1. The MCS coverages and the Tc values range from 0.2 to 1.0 between the docking compounds and the template ligands, with the majority centered around 0.5 (Fig. S6). To evaluate the influence of template similarity on the quality of complex structure modeling, we compared the sampling and scoring capabilities of different approaches based on MCS coverage values. The number of benchmarking systems within each MCS coverage interval was as follows: 68 for the interval of 0.8-1.0, 73 for 0.6-0.8, 117 for 0.4-0.6, and 75 for 0.2-0.4.
Training and inference procedures of Uni-Mol model
Uni-Mol is a universal molecular representation learning framework, featuring a molecular pretrained model and a protein pocket pretrained model32. It supports various downstream tasks, such as molecular property prediction, molecular conformation generation, and protein-ligand binding complex generation. Here, we used the Uni-Mol v1 framework for ligand binding pose generation. During our training procedures, we utilized the official checkpoints for the ligand and protein pretrained models and fine-tuned protein-ligand contact modules using seven training datasets and three random seeds. For inference, we used LBFGS optimizer to update the translation, rotations, and torsion angles of ligands based on the predicted protein-ligand binding distance matrix. Detailed scripts for training and inference were provided in the supplementary materials.
Datasets used for training and testing Uni-Mol model
We utilized the PoseBusters v1 dataset as our testing dataset, which consists of 428 protein-ligand complex structures from PDB43. The ligands and proteins were prepared with Schrödinger LigPrep and PrepWizard48. Crystal waters were removed, and the pockets were cropped to a size of 6 Å around the crystal ligand. We used ligand similarity-based data splitting method to access the generalization ability of Uni-Mol model. The Tc between training and testing ligands were calculated with morgan fingerprints with RDKit toolkit51. Training datasets 1-4 are four subsets of PDBbind (v2020), where the ligand was chosen to have a maximum Tc value lower than 0.3, 0.5, 0.7, and 1.0 to any ligand in the PoseBusters dataset, respectively. Complexes containing ligands with the maximum Tc value lower than 0.3 from BindingNet v2 were added to Dataset 1 for evaluating the utility of data augmentation on generalization capability. Dataset 5 combined Dataset 1 with high-confidence complex structures from BindingNet v2, Dataset 6 added moderate-confidence structures, and Dataset 7 included low-confidence structures as well (Table 2).
Supplementary material
Supplementary Data 1. Benchmark dataset. It includes the PDB IDs for 333 benchmarking systems along with their corresponding templates. It also provides the maximum MCS coverage and maximum Tc values for the benchmarking compounds compared to the template ligands.
Supplementary PDF file includes the target, compound, binding affinity distributions of BindingNet v2 (Figs. S1-S2), the maximum Tc values between the ligands from PoseBusters v1 and PDBbind (Fig. S3), PB-valid analysis of Uni-Mol (Figs. S4-S5), distributions of maximum MCS coverage and maximum Tc for benchmark dataset (Fig. S6), sampling size comparison among different sampling methods (Table S1), comparative analysis of sampling and scoring ability (Table S2), and CCD codes for special compounds (Table S3).


Responses