Automated and virus variant-programmable surrogate test qualitatively compares to the gold standard SARS-CoV-2 neutralization assay

Introduction
The emergence of SARS-CoV-2 viral variants and the potential for continued spread of the virus underscores the need for rapid, adaptable, surrogate neutralizing antibody screening assays suitable for biosafety level (BSL)-2 facilities. Correlates of protection are typically defined as the level of the immune response induced by the infection or the vaccine that provides protection against future infection, usually determined by neutralizing antibody titers quantified by neutralization assays1. Established methods include the plaque-reduction neutralization test (PRNT) and the virus microneutralization test (mVNT), which measure neutralizing antibodies that inhibit virus-mediated cytopathic effects2; however, both tests require live cells, infectious virus, BSL-3 containment, and days to complete. Although pseudovirus neutralization tests (pVNTs) that replace infectious virus with pseudotyped viral particles (such as those based on vesicular stomatitis virus or lentivirus) do not require BSL-3 containment, the procedure is laborious and also takes days to complete3. Surrogate virus neutralization tests (sVNTs), which require neither infectious virus or BSL-3 containment, measure antibody-mediated inhibition of the spike (S) protein receptor binding domain (RBD) binding to the human angiotensin-converting enzyme 2 (hACE2) receptor4. Current sVNTs eliminate the need for containment and are frequently ELISA or chemiluminescence-based5. Although not an exhaustive review of the literature, other sVNT may be based on the use of virus-like particles6 or beads coated with SARS-CoV-2 proteins7 and flow cytometric assays or a label-free biosensor-based approach8. Many of the sVNTs require multiple hands-on steps, long incubations, and equipment that is usually found only in a research or clinical laboratory.
We developed a high throughput, adaptable sVNT SARS-CoV-2 assay that is comparable to the gold standard cell-based mVNT and pVNT and that can be performed using the microfluidic cartridge-based, portable Ella platform9. As a proof of concept, we designed two variant-specific assays using the SARS-CoV-2 wild-type (WT) and B.1.617.2 (Delta) variant RBDs. We evaluated this assay using sera from multiple cohorts, including post-COVID-19 vaccination and post-SARS-CoV-2 infection biospecimens10,11, in addition to SARS-CoV-2 negative sera from pre-pandemic serum samples stored at the Department of Defense Serum Repository (DODSR) from individuals after infection with other endemic human coronaviruses (HCoVs) or influenza viruses12. This sVNT measured levels of neutralizing antibodies following vaccination or infection that were comparable to the traditional cell-based assays and the procedure required less than an 80 min run on a small and automated platform that does not require additional laboratory biosafety precautions.
Materials and methods
Curation of sera for assay calibration and evaluation of sensitivity and specificity
The SARS-CoV-2 IgG-negative panel (Supplemental Table 1) (n = 203) comprised pre-COVID-19 DODSR negative samples (n = 50) or samples with known HCoV or influenza virus infections (n = 50), and pre-COVID-19-vaccination and pre-SARS-CoV-2 infection sera from the Prospective Assessment of SARS-CoV-2 Seroconversion (PASS study) (n = 103)10. Briefly, PASS is a longitudinal cohort study of healthcare workers that includes the serial collection of serum samples and regular assessments of vaccination and infection events. Participants in the PASS study, who were documented to be seronegative with no prior COVID diagnosis upon study entry between August of 2020 and February of 2021, have been followed serially since that time10 (Supplemental Table 2). The DODSR samples were collected before 202012 and a were PCR-confirmed to be associated with prior seasonal HCoV infections, H229E (n = 9), HKU1 (n = 9), NL63 (n = 10), or OC43 (n = 8), or influenza A (n = 6) or influenza B (n = 8).
We also curated a panel of sera obtained from individuals with prior SARS-CoV-2 infection and/or COVID-19 vaccination (Supplemental Table 1). Here we used post-vaccination sera from the PASS post-vaccination cohort (n = 103), which is the same cohort that provided pre-immune sera and had no prior SARS-CoV-2 infection (Supplemental Table 2)10. Additionally, we used post-infection sera from the Epidemiology, Immunology, and Clinical Characteristics of Emerging Infectious Diseases with Pandemic Potential (EPICC study), in which participants located at various military treatment facilities were enrolled after SARS-CoV-2 infection (n = 17 individuals) (Supplemental Tables 3 and 4)13. Serum samples were collected at enrollment (early, <60 days post-symptom onset), 6 months post-enrollment, and 12 months post-enrollment (n = 51 serum samples total).
Simple PlexTM sVNT assay
The Simple PlexTM sVNT assay is based on the binding of tethered Digoxigenin (DIG)-labeled RBD to a His-tagged ACE2 receptor (ACE2-His). The ACE2-His bound to the tethered DIG-labeled RBD was measured using a biotinylated anti-His antibody that produced a fluorescent signal when the biotin bound to a fluorescent streptavidin conjugate. Anti-RBD antibodies in serum competed with ACE2-His for binding to DIG-RBD, thereby decreasing the fluorescent signal (Fig. 1). Reagents for the detection of SARS-CoV-2 antibodies using Simple PlexTM Digoxigenin Open Cartridges (ST01D-OT-006229, ProteinSimple, San Jose, CA) were described previously14. Following a modified procedure from the Simple PlexTM Quick Start Guide, we conjugated WT S1-RBD (R&D Systems, Minneapolis, MN 10499-CV-100) and Delta B.1.617.2 S1-RBD (R&D Systems 10901-CV-100) with DIG. We determined RBD concentrations using a bicinchoninic acid (BCA) protein assay (Kit-23227, PierceTM, Thermo Fisher Scientific Rockford, IL) and prepared the DIG-labeled stocks at 10 µg/mL in sample diluent 13 (SD13; part # 896069, ProteinSimple). We determined the half maximal effective concentration at 50% (EC50) of ACE2-His (R&D Systems 933-ZN) for the WT and Delta DIG-S1-RBDs using a Simple PlexTM customizable 48-DIG open cartridge with a dilution series of ACE2-His and 10 μg/mL of each RBD, measuring the relative fluorescence unit (RFU) response with a biotinylated mouse anti-His-tag IgG antibody (R&D Systems BAM050) that was prepared at 3.33 µg/mL in SD13.

The capture reagent is a DIG-labeled RBD (red) that binds to the anti-DIG antibody attached to the GNR wall (blue). Capture-protein-specific antibodies (gold) in the serum compete with His-tagged ACE-2 (brown and orange) to decrease the signal. The ACE-2-His bound to the DIG-labeled RBD is measured using a biotinylated anti-His antibody (pink) that produces a fluorescent signal when the biotin binds to a fluorescent streptavidin conjugate (green).
For the assay setup, the Simple PlexTM open cartridge was pre-loaded with 10 μg/mL of each DIG-conjugated RBD resuspended in SD13 in duplicate. Serum samples were resuspended in SD19 (part # 992518, ProteinSimple) at a 1:5 dilution and then serially diluted 1:3 seven times. SD19 diluent was included as a negative control, and 0.3–30 µg/mL of the monoclonal antibody CR3022 (WRAIR EG-03-13–20, kindly provided by Dr. M. Gordon Joyce15) was the positive control, which we found to be weakly neutralizing. The CR3022 antibody was used to determine the IC50 values from four independent replicates, which were found to be consistent, with a mean IC50 of 1.3 × 10⁻³ µM and a standard deviation of 1.6 × 10⁻⁴ µM. The coefficient of variation was 12.23%, indicating moderate precision of the assay. In the 96-well sample preparation plate, each sample or control was mixed 1:1 with ACE2-His. Capture antigen and detector antibody were pipetted into their respective cartridge inlets, and then the combined ACE2-His and sample (or control) mixture was transferred from the sample preparation plate to the cartridge. The cartridge was loaded into the Ella Automated Immunoassay System (600-100, ProteinSimple) following the manufacturer’s instructions. Triplicate glass nano reactors (GNRs) coated with anti-DIG antibody captured the RBDs, and in ~80 min, the instrument measured individual RFU values from each GNR and calculated mean RFU values for the triplicate GNRs. RFU means were converted to a percent (%) inhibition value for each sample at every dilution point by the following formula: Inhibition [%] = [1 – (RFU mean/negative control)] × 100. We used analyses of the 50 SARS-CoV-2 negative sera samples provided by the DODSR and collected before the emergence of the virus to determine a percent inhibition threshold for assay positivity. We used analyses of pre-vaccination, post-vaccination, and post-infection negative sera (from the PASS and EPICC protocols) to determine receiver operating characteristic (ROC) curves.
pVNT and mVNT assay
Neutralizing antibody titers were determined by pVNT assays as described previously16,17. Briefly, heat-inactivated sera was serially diluted, mixed with S-pseudovirus, and incubated at 37 °C for 1 h. The resulting mixture was transferred in duplicate to a flat-bottom culture plate seeded with 293T-ACE2/TMPRSS2 cells and incubated at 37 °C for 48 h. Following incubation, the cells were lysed and firefly luciferase activity was read in a luminometer. Neutralizing titers were calculated as described previously17.
Neutralizing antibody titers were determined by mVNT assays as described previously18. Briefly, heat-inactivated sera was serially diluted, mixed with WT SARS-CoV-2 virus stock, and incubated at 37 °C for 1 h. The resulting mixture was added in triplicate to Vero 81 cells in a 96 well microtiter plate and incubated at 37 °C for ~84 h. The plates included negative controls for cells only (no virus), and positive controls with cells plus virus (no sera). Following incubation, the cells were washed, fixed, and an ELISA to detect SARS-CoV-2 S protein was performed. Cutoffs were determined using the mean value of nine virus only controls and neutralizing titers were calculated as described previously18.
The pVNT and mVNT assays were run on the PASS post-vaccination and EPICC post-infection sera (Supplemental Tables 2 and 3). Correlations between sVNT, pVNT and mVNT assay read-outs were performed using Spearman’s correlation.
Calculations and statistics
Optimal cutoffs for sVNT assays were determined by generation of ROC curves (using data from the lowest dilution, 1:10) and calculation of the Youden index. Correlations between assays were determined by Spearman’s rank correlation. EC50 values between multiple assays were compared using Dunn’s test following normality testing. All statistical analyses were performed in GraphPad Prism 8.3.1 or SAS.
Ethical standards
The PASS study protocol (IDCRP-126) was approved by the Uniformed Services University Institutional Review Board. The study was conducted in accordance with the local legislation and institutional requirements, and all participants provided written informed consent to participate in this study. The EPICC study (IDCRP-085) was approved by the Uniformed Services University Institutional Review Board and all study participants provided written consent when enrolled in the study. This observational cohort study in a convenience sample of MHS beneficiaries was conducted following good clinical practice and according to the Declaration of Helsinki guidelines. All human serum samples were de-identified, and the protocol for this study was approved by the Naval Medical Research Command’s Institutional Review Board in compliance with all applicable federal regulations governing the protection of human subjects.
Results
The sVNT has high sensitivity and specificity to WT and Delta RBDs
We analyzed the WT RBD sVNT (WT-sVNT) and Delta RBD sVNT (Delta-sVNT) based on the percent inhibition calculated by the automated platform, and we produced ROC curves to determine assay performance, sensitivity, and specificity. We determined a cut-off of 27% inhibition would provide optimal sensitivity and specificity based on negative sample reactivities and the Youden index. As seen in Fig. 2a, b, this cut-off provides high sensitivity and specificity for both sVNT assays (WT-sVNT: AUC = 0.9928, sensitivity = 98%, specificity = 100%; Delta-sVNT: AUC = 0.9870, sensitivity = 97%, specificity = 96%). With an AUC of 0.9928 and 0.9870 for the WT-sVNT and Delta-sVNT, respectively, both assays demonstrate an excellent diagnostic accuracy, meaning it effectively discriminates between positive and negative samples. Both sVNT assays were positive (>27% inhibition) for all post-vaccination samples tested, and for >90% of post-infection samples tested (Fig. 2c). With regards to specificity, 100% of the negative serum samples were below the cut-off of 27% for WT-sVNT and 97.4% were below the cut-off for Delta-sVNT. All the serum samples from individuals with HCoVs and influenza virus infections were below our 27% cut-off, demonstrating that this sVNT can distinguish between neutralizing antibodies to SARS-CoV-2, other HCoVs, and influenza virus with little or no cross-reactivity.
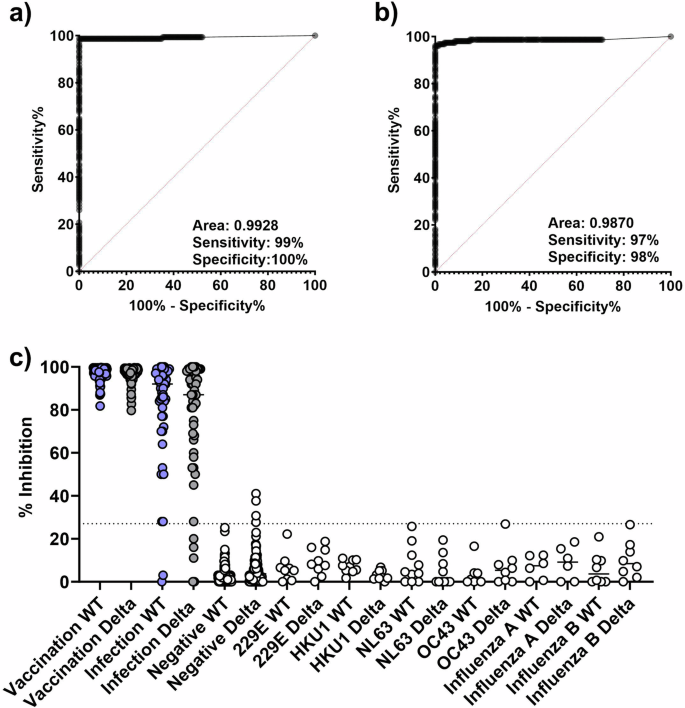
ROC plot showing specificity and sensitivity for (a) WT and (b) Delta RBD. c The percent inhibition for post-vaccination/infection samples vs. WT-RBD (blue circles) or Delta-RBD (gray circles) and a panel of negative controls (white circles) comprised of pre-vaccination sera collected prior to 2019 and from other respiratory infections. The dotted line represents the 27% cutoff. Vaccination samples (n = 103) from the PASS cohort received the two-dose BNT162b2 (Pfizer) series, whereas the infection samples (n = 51 serum samples from 17 individuals at 3 time points) represent individuals positive for SARS-CoV-2 with varied vaccination status from the EPICC cohort. The negative control sample panel (n = 203) comprised pre-vaccination confirmed negative samples (n = 103), sera collected prior to the outbreak of SARS-CoV-2 (n = 50), and samples from other respiratory viruses and human coronaviruses (n = 50): 229E (n = 9), HKU1 (n = 9), NL63 (n = 10), OC43 (n = 8), influenza A (n = 6) and influenza B (n = 8).
WT-sVNT is qualitatively comparable to the gold standard mVNT and cell-based neutralization assays, but correlations vary by post-infection timepoint
We compared our sVNT assays to the cell-based mVNT and pVNT (Table 1) with 36 of the post-vaccination serum samples from the PASS study and 14 post-infection serum samples per time-point (early, 6 months, and 12 months) from the EPICC study. Three post-infection serum samples per time-point from the EPICC study were not included because no EC50 could be calculated due to low or no antibodies detected in those samples. Spearman’s test showed strong correlations between neutralizing antibody titers for sVNT versus the cell-based mVNT and pVNT for post-vaccination (n = 36) sera (the sVNT vs the mVNT ρ = 0.75, P < 0.0001, 95% CI = 0.55 to 0.87; sVNT vs pVNT ρ = 0.86, P < 0.0001, 95% CI = 0.73 to 0.93) (Fig. 3a–c). However, there was variability in the strength of the correlation of the post-infection titers between the sVNT and traditional cell-based assays. Early post-infection, there was a weak correlation between the sVNT and the mVNT (ρ = 0.05, P = 0.85), whereas the correlation between the sVNT and the pVNT was moderate (ρ = 0.36, P = 0.20) (Fig. 3d–2f). At 6 months post-infection, there was poor correlation between the sVNT and the mVNT (ρ = − 0.17, P = 0.54) but a moderate correlation between the sVNT and the pVNT (ρ = 0.57, P = 0.03) (Fig. 3g–2I). Finally, at 12 months post-infection, there was a moderate correlation between the sVNT and the mVNT (ρ = 0.40, P = 0.15) and a strong correlation between the sVNT and the pVNT (ρ = 0.79, P = 0.0013) (Fig. 3J–2L).
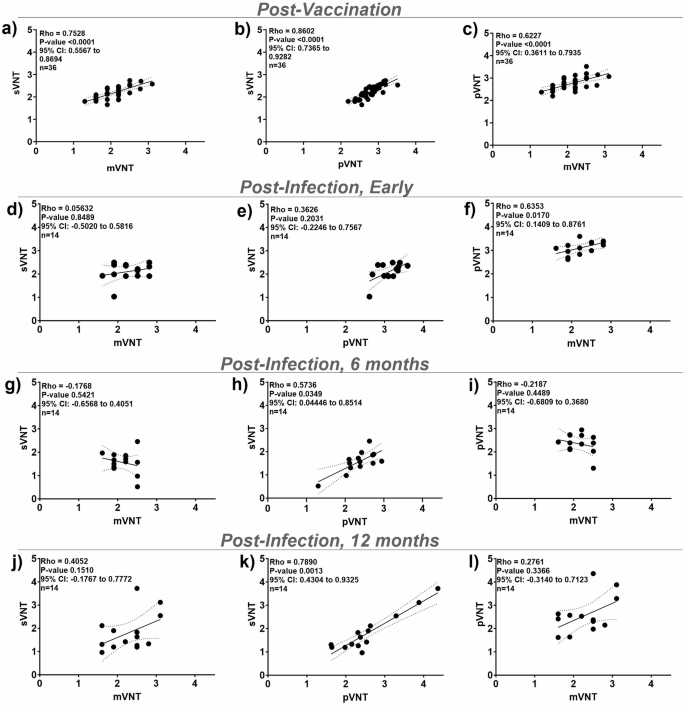
Correlations for sVNT, mVNT, and pVNT antibody titers (log EC50) against WT RBD. a–c Post-vaccination (n = 36), (d–f) early post-infection (n = 14), (g–i) 6 months post-infection (n = 14), and (j–l) 12 months post-infection (n = 14). The correlation was determined by Spearman’s rho. Linear regression line (solid line), Spearman’s 95% confidence interval (CI) (dashed line), Spearman’s P-value, and n are shown.
Consistency of titers across assays and cohorts
In order to provide context for interpreting the assay correlation results, we compared neutralizing antibody titers for serum samples from the post-vaccination and post-infection groups for the mVNT, the pVNT, and the sVNT (Fig. 4). We observed a range of titers and found no significant differences between the sVNT and the mVNT for the samples from the post-vaccination and early post-infection groups. The 6-month post-infection and 12 month post-infection samples showed weakly significant differences (P = 0.0138 and P = 0.0245, respectively) in titer between the sVNT and the mVNT. There were also differences between the antibody titers for the sVNT vs the pVNT for all groups of samples; however, these are unlikely to have clinical significance since all samples had a relatively high neutralizing antibody titer. These differences also likely reflect the variability in the dilution schemes for the different assays which were run in independent labs.
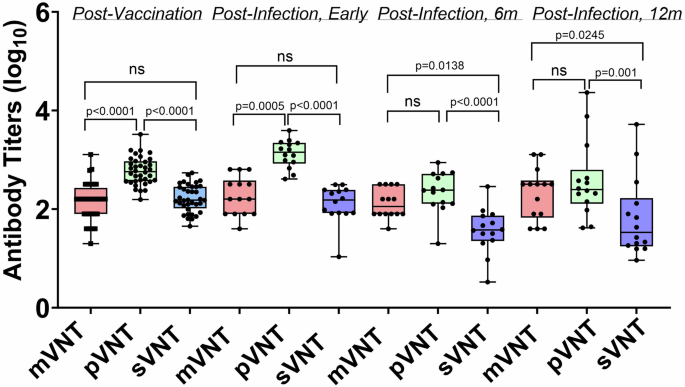
Differences between mean log EC50 titers post-vaccination (n = 36), early post-infection (n = 14), 6 months post-infection (n = 14), and 12 months post-infection (n = 14). The upper and lower bars represent the minimum/maximum, ns = not significant (p > 0.05). Dunn’s statistical significance following normality testing was calculated using GraphPad
sVNT titers for WT and delta RBD
To determine whether the sVNT can be used to detect different SARS-CoV-2 variants, we directly compared serological measurements by WT-sVNT vs. Delta-sVNT. The mean antibody titer was significantly lower for the Delta-sVNT compared to the WT-sVNT in the post-vaccination (P < 0.0001) and early post-infection serum samples (P = 0.0134) but not for the 6 month post-infection and 12 month post-infection samples (Fig. 5A–D).
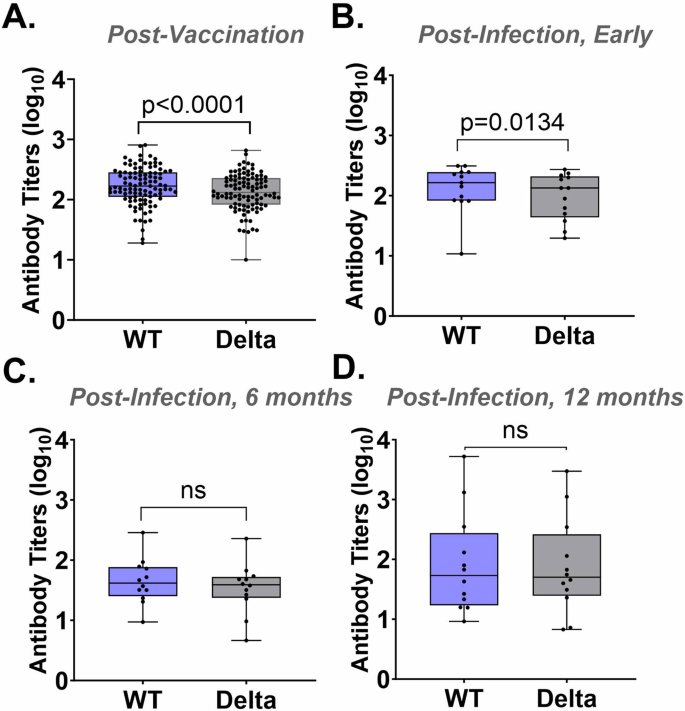
Log EC50 antibody titers for WT-sVNT and Delta-sVNT for samples (A) post-vaccination (n = 102), (B) early post-infection, (n = 13), (C) 6 months post-infection (n = 12), and (D) 12 months post-infection (n = 12). The upper and lower bars represent the minimum/maximum, ns = not significant (p > 0.05). Wilcoxon statistical significance was calculated using GraphPad.
Discussion
Testing for SARS-CoV-2 infection and immunity remains a high priority as new variants emerge. Neutralizing antibody titers that correlate with SARS-CoV-2 infection can provide information on thresholds for protective immunity19,20,21. However, traditional cell-based neutralization assays are slow and expensive. In this study, we developed a sensitive and specific sVNT that runs in under 80 min on an automated immunoassay platform designed by Simple PlexTM. We evaluated its performance compared to the gold standard cell-based mVNT and pVNT. This sVNT assay demonstrated high sensitivity and specificity for both WT-sVNT and Delta-sVNT and is easily customized for new variants. Similar to other sVNTs, our sVNT had an inhibition cut-off of 27%22,23,24,25,26,27,28. Both the pVNT and the mVNT showed moderate to strong correlation with the sVNT for post-vaccination serum samples and a strong correlation for early and 12 months post-infection samples, but not for samples collected 6 months after infection. Although the lower neutralizing antibody response to RBD after infection versus after vaccination resulted in better test performance for post-vaccination samples, overall, the data indicate that our sVNT qualitatively identified anti-RBD antibodies after vaccination and after infection.
While the sVNT has been shown to be suitable to detect neutralizing antibodies in our study and by others22,23,24,25,26,27,28, a known limitation is that the assay only detects RBD-targeting neutralizing antibodies and will more accurately quantify neutralizing antibodies in vaccinees compared to convalescent individuals. The sVNT likely performed better with the post-vaccination samples compared to the post-infection samples because the immune response to vaccination is specific for producing antibodies to the spike protein, which includes RBD-targeting neutralizing antibodies. The immune response after natural infection generates neutralizing antibodies that may target other epitopes on the SARS-CoV-2 virion that are not detected by the sVNT. However, the RBD-targeting neutralizing antibodies have been demonstrated to be immunodominant during SARS-CoV-2 infection29. Although our assay does not capture the spectrum of immune responses to SARS-CoV-2 infection, it measures reactivities to RBD comparable to canonical VNTs.
Given the high mutation rates in SARS-CoV-2 with the ongoing emergence of variants, it is important that assays can be adapted for variants of concern (VOC)30. With this automated sVNT, it is feasible to change the target variants rapidly as they emerge. Although this platform is adaptable for new variants, whether it will be necessary to create a new RBD-based bioreagent will likely depend on the specific variant31. Because all our samples were collected during the same phase of the pandemic, we will need to assess a wider range of samples to identify shifts in epitope recognition, including re-evaluation of PRNT and sVNT correlation across newer variants. Additionally, because the longitudinal post-infection cohort was small (n = 51 sera from 17 individuals), we need future studies that examine larger sample sizes.
Reproducible and scalable serology assays that can be adapted to evaluate the immune response to emerging pathogens are critical for timely responses and interventions against diseases32. In summary, our analysis findings here indicate good performance of the Simple PlexTM microfluidic immunoassay for post-vaccine immunity measurement, but varying performance of quantitative measurement from post-infection sera, when compared to reference assays. These findings prompt further assay target validations on prospective independent sera sets collected from those infected and/or vaccinated against historical and emerging variants.

Responses