BAIAP2L2 promotes the malignancy of hepatocellular carcinoma via GABPB1-mediated reactive oxygen species imbalance
Introduction
HCC is the predominant histological subtype of primary liver cancer, accounting for ~80% of cases globally [1]. In terms of global cancer statistics, liver cancer ranks sixth in new incidence and third in mortality rate [2, 3]. Surgical resection or transplantation is considered the most effective treatment for early-stage HCC. However, the majority of HCC patients are asymptomatic in the early stages and are often diagnosed at an advanced stage [4]. Despite advancements in the prevention, diagnosis, and intervention of HCC, outcomes remain unfavorable. Therefore, there is a pressing need to enhance the investigation of the molecular mechanisms underlying the pathogenesis of HCC.
BAIAP2L2, a member of the I-BAR protein family, has been implicated in various types of cancer, including lung cancer [5], osteosarcoma [6], gastric cancer [7], and prostate cancer [8]. Inhibition of BAIAP2L2 has been found to restrict the proliferation of osteosarcoma cells [6]. In gastric cancer, BAIAP2L2 has been shown to promote cancer progression through the activation of the AKT/mTOR and Wnt3a/beta-catenin signaling pathways [7]. Additionally, BAIAP2L2 has been identified as a potential therapeutic target for EGFR wild-type cancers with low PD-L1 expression [9]. In the study conducted by Wei et al. on HCC, it was found that BAIAP2L2 may impact the prognosis of HCC by regulating immunity, methylation, and cuproptosis through the use of bioinformatics technology [10]. However, the clinical and pathological significance of BAIAP2L2 in HCC remains unclear, and no studies have been conducted to elucidate the functional role of BAIAP2L2 in the development of HCC.
In this study, we discovered that the expression of BAIAP2L2 was increased in HCC and found that it was an independent prognostic factor for the overall survival of HCC patients. BAIAP2L2 was found to enhance HCC cell proliferation, metastasis, stemness, cell cycle progression, and inhibit apoptosis. NF-κB1 was identified as a crucial factor in the upregulation of BAIAP2L2 in HCC. Additionally, we demonstrated that BAIAP2L2 interacts with GA-binding protein transcription factor subunit beta 1 (GABPB1), inhibiting the protease degradation of GABPB1 by suppressing its ubiquitination and facilitating its translocation to the nucleus. Furthermore, BAIAP2L2 was found to inhibit the levels of ROS by regulating GABPB1, thereby promoting cancer development in HCC and reducing the sensitivity of HCC to lenvatinib. Based on these findings, it is suggested that BAIAP2L2 may serve as a potential diagnostic biomarker and therapeutic target for HCC.
Materials and methods
Cell lines and human tissue
HCC cells (Huh7, MHCC97L, HepG2, Hep3B, HCCLM3, Focus, and YY8103), immortalized human hepatocyte THLE-3 cells, and HEK293T cells were obtained from the Shanghai Institute of Cell Biology, Chinese Academy of Sciences (Shanghai, China).
HCC tissues and adjacent non-cancerous samples were obtained from patients who underwent hepatic resection at the Hepatobiliary Center of the First Affiliated Hospital of Nanjing Medical University. All participants in this study provided written informed consent, which was approved by the Ethics Committee of the First Affiliated Hospital of Nanjing Medical University. The human experiments were conducted in accordance with the ethical norms of the World Medical Association, as stated in the Declaration of Helsinki.
Cell culture and transfection
All cells were cultured in Dulbecco’s modified Eagle’s medium (DMEM) (Invitrogen, Carlsbad, USA) supplemented with 10% fetal bovine serum (Gibco, Carlsbad, USA) and 50 U/ml penicillin‒streptomycin (Invitrogen). The cells were cultured in a 5% CO2 incubator at 37 °C.
Plasmid and small interfering RNA (siRNA) transfections were performed using Lipofectamine 3000 (Invitrogen) according to the provided protocol. For lentiviral transfections, polybrene (Invitrogen) was used to enhance transfection efficiency. Puromycin (Invitrogen) was employed to select stable transfected cells. The efficiency of transfection was evaluated through quantitative real-time PCR (qRT-PCR) and western blot analysis. Lentiviruses overexpressing BAIAP2L2, lentiviruses containing BAIAP2L2 small hairpin RNA (shRNA), siRNA targeting NFκB1, an overexpression plasmid for NFκB1, siRNA targeting GABPB1, and an overexpression plasmid for GABPB1 were obtained from GenePharma (GenePharma, Shanghai, China). The shRNA and siRNA sequences are provided in Table S1.
Quantitative real-time PCR (qRT-PCR)
Total RNA from HCC tissues and HCC cell lines was isolated using an RNA extraction kit (Invitrogen). Then, the total RNA was transcribed to cDNA with a Prime Script RT kit (TaKaRa, Dalian, China). qRT-PCR was performed using SYBR Premix ExTaq II (TaKaRa) and the ABI 7900 PCR system (Applied Biosystems, CA, USA). The results were calculated using the 2−ΔΔCT method, and the primer sequences are listed in Table S2.
Tissue microarrays (TMAs)
The HCC tissues and adjacent non-cancerous tissues were obtained from the Hepatobiliary Center of the First Affiliated Hospital of Nanjing Medical University. Human HCC TMAs were created by Servicebio (Wuhan, China).
Immunohistochemical (IHC) staining
The specimen was fixed in formaldehyde, followed by embedding in paraffin and subsequent sectioning. Deparaffinization was performed using xylene and anhydrous ethanol, after which rehydration was carried out through a gradient of ethanol concentrations. Antigen retrieval was achieved by boiling the sample in a sodium citrate solution for 30 min. Blocking was accomplished with goat serum, and the primary antibody was added, with incubation occurring overnight at 4 °C. The sections were then washed with TBST, and after applying the secondary antibody, incubation was conducted at 37 °C for 30 min. Staining was performed using a DAB chromogen (Beyotime), followed by hematoxylin for nuclear visualization.
Cell counting kit-8 (CCK-8) analysis
Transfected cells were seeded in a 96-well plate. CCK-8 solution (RiboBio, Guangzhou, China) was added every 24 h according to the manufacturer’s protocol. The absorbance of each group was subsequently measured at a wavelength of 450 nm. Continuous testing was performed for 5 days.
Wound-healing assay
The wound-healing assay was performed to detect the cell migration capacities. In brief, the transfected cells were plated in 6-well plates, and the cell surface was scratched using a 200 μL plastic pipette tip. Wound closure was monitored at 0 and 48 h.
Transwell assay
In the cell migration experiment, 2 × 10⁴ cells were seeded in the upper chamber of a transwell chamber (Corning, NY, USA) with 200 μL of serum-free DMEM. Then, 600 μL of DMEM containing 10% FBS was added to the lower chamber. For the cell invasion experiment, Matrigel (diluted 1:8; BD Biosciences, Franklin Lakes, USA) was added to the upper chamber, and the remaining steps were identical to those in the migration experiment. Incubation occurred for 48 h. The upper cells were removed, and the remaining cells were fixed and stained for quantitative analysis.
5-Ethynyl-20-deoxyuridine (EdU) assay
Transfected cells were incubated with an EdU solution (RiboBio) in 24-well plates for 2 h. Then, the cells were fixed and the aldehyde groups were neutralized with 2 mg/mL of glycine. Cells were permeabilized with 0.5% Triton X-100 and then stained with Apollo and DAPI.
Sphere-forming assay
A total of 2000 cells were seeded in a 24-well suspension cell culture plate (Corning) containing 2 mL of stem cell culture medium. Stem cell culture medium: DMEM/F12 (Gibco) supplemented with 1X B27 (Sigma-Aldrich, Saint Louis, USA), 20 ng/mL EGF (PeproTech, NJ, USA), 20 ng/mL FGF (PeproTech), and 4 µg/mL heparin. The cells were cultured for 10 days. The formation of pellets by the cells was observed, and the size and number of pellets were calculated.
Construction of hepatocellular carcinoma organoid model
The organoid culture protocol followed a previously established methodology [11]. Patient-derived specimens were minced and subsequently incubated in a digestive solution for 4 h at 37 °C. Then, the cells were combined with Basement Membrane Extract (BME) (R&D Systems, MN, USA) on ice, achieving a concentration of 10,000 cells in 40 µl of BME. Approximately 10 µl droplets of BME were then deposited into each well of a 24-well suspension cell culture plate, after which 400 µl of organoid medium was added to each well. The organoids were maintained in a 37 °C incubator with an atmosphere of 5% CO2, and the culture medium was refreshed biweekly.
Western blot assay
Cells were lysed with prechilled radioimmunoprecipitation (RIPA) buffer, supplemented with 1 mM phenylmethylsulfonyl fluoride (PMSF). After adding a loading buffer and boiling for 10 min to denature the protein, the proteins were separated using sodium dodecyl sulfate–polyacrylamide gel electrophoresis (SDS–PAGE) and then transferred to polyvinylidene fluoride (PVDF) membranes (Bio-Rad, CA, USA). The proteins were incubated with primary antibodies overnight at 4 °C and with secondary antibodies for 2 h at room temperature. The visualization was performed using ECL (Yesen, Shanghai, China) detection. The antibodies are listed in Table S3.
Flow cytometry analysis
In the cell cycle analysis, after fixing the cells, 5 × 10⁵ cells were added to each tube and stained with propidium iodide (PI) (Vazyme, Nanjing, China). Cell cycle distribution was measured using a BD FACS Canto II. In the cell apoptosis analysis, transfected cells were stained with Annexin V-FITC solution (Vazyme) and PI solution, following the manufacturer’s instructions. Apoptosis was detected using the BD FACS Canto II.
Animal models
In the present study, ethical clearance for all animal experimentation was obtained from the Institutional Animal Care and Use Committee (IACUC) at the First Affiliated Hospital of Nanjing Medical University. All animal-related procedures were conducted in accordance with the operational protocols established by the IACUC. BALB/c nude mice (4 weeks old, male) were acquired from Vital River (Beijing, China).
For the subcutaneous tumor model, the BALB/c nude mice were randomly assigned to four groups, each consisting of five mice. The transfected cells were injected into the flanks of nude mice, and the tumor size was recorded every 3 days for 4 weeks. The volumes of the tumors were calculated using the formula: length × width2/2.
For the orthotopic tumor transplantation model, the necessary cells were prepared as a 5 × 10⁷/mL cell suspension. After successful isoflurane anesthesia, the nude mice were disinfected below the xiphoid process along the mid-abdominal line, and an ~0.5 cm incision was made to expose the left lobe of the liver. A total of 20 µl of cell suspension was injected beneath the liver capsule. At week 4, the fluorescence distribution and intensity of the liver in the abdominal region were observed. Subsequently, the nude mice were sacrificed for liver analysis.
The lung metastasis model was established through tail vein injection. There were 15 nude mice in each group, and each mouse was injected with ~1 × 10⁶ post-transfected cells through the tail vein. At week 4, five mice per group were sacrificed. Survival analysis was performed on the remaining mice using a 12-week cutoff.
Luciferase reporter assay
The BAIAP2L2 promoter sequence was obtained from the UCSC database (http://genome.ucsc.edu/) and the BAIAP2L2 promoter regions (−2000/0, −1500/0, −1000/0, −750/0, −500/0 and −250/0) were inserted into the pGL3-Basic vector (Promega, Madison, USA) to construct a luciferase reporter gene. Two single-site mutation (−522 ~ −532) mut and (−984 ~ −994 bp) mut and two-site mutation (−522 ~ −532 mut and −984 ~ −994 bp) sequences of BAIAP2L2 promoter were inserted into the pGL3-Basic vector. The relevant plasmids were transfected into 293T cells using Lipofectamine 3000 (Invitrogen). Dual-luciferase reporter gene assays were conducted using the Dual-Luciferase Reporter Assay System (Promega).
Chromatin immunoprecipitation assays
A chromatin immunoprecipitation (ChIP) Assay Kit (Beyotime, Shanghai, China) was used to perform ChIP assays. Briefly, following cell lysis, the chromatin was fragmented to sizes ranging from 200 to 2000 base pairs using an ultrasonic cytometer, and then immunoprecipitated with anti-NFkB1 and IgG antibodies. The enriched DNA templates were analyzed by PCR using primer pairs specific to the target gene promoter (Supplementary Table 2).
Coimmunoprecipitation (Co-IP) assay
In the conducted Co-IP experiments, Anti-Flag Magnetic Beads (MedChemExpress, NJ, USA) were utilized. Plasmids containing flag-tagged BAIAP2L2, flag-tagged GABPB1, and flag-tagged truncated BAIAP2L2 were transfected separately into HCC cells. The magnetic beads were incubated overnight with the transfected cell lysates. Following the elution of the magnetic beads, protein interactions were analyzed using western blotting.
Ubiquitination detection assay
Transfected cells were treated with 20 μM MG132 (Beyotime) for 6 h. After that, the total protein was collected. The supernatant was harvested and immunoprecipitated using anti-Flag Magnetic Beads. Western blotting was performed using an anti-HA-Ubiquitin antibody to detect the ubiquitination of GABPB1.
Immunofluorescence assay and confocal microscopy
Cells cultured on confocal dishes were fixed and permeabilized for 10 min. The rabbit antibody BAIAP2L2 and mouse antibody GABPB1 were added and incubated overnight. Then, cells were stained with Alexa Fluor 594 goat anti-rabbit IgG and Alexa Fluor 488 goat anti-mouse IgG. Nuclei were labeled with DAPI, and cells were visualized using a confocal laser scanning microscope (Olympus).
RNA sequencing
Three pairs of BAIAP2L2-overexpressing Hep3B cells and negative control cells were lysed with TRIzol reagent. Next, RNA sequencing (JI GUANG Gene, Nanjing, China) was performed.
Mitochondrial membrane potential and reactive oxygen species analysis
To assess the alterations in mitochondrial membrane potential, we employed the Mitochondrial Membrane Potential Assay Kit with JC-1 (Beyotime) following the instructions provided by the manufacturer. Intracellular levels of ROS were evaluated using a Reactive Oxygen Species Assay Kit (Beyotime) according to the manufacturer’s instructions. Images were obtained using a fluorescence microscope.
Establishment of lenvatinib-resistant cell line
Huh7 cells were cultured in a 96-well plate at a density of 2000 cells/well and treated with increasing concentrations of Lenvatinib (MedChemExpress). CCK-8 assay was used to determine the half-maximal inhibitory concentration (IC50) of lenvatinib on Huh7 cells after 48 h. Subsequently, the lenvatinib-resistant Huh7 cells (Huh7 LR) cells were cultured either in the absence of lenvatinib or with 10 μM of lenvatinib for a duration of 1 month. The IC50 of lenvatinib in Huh7 LR cells was measured again to confirm that Huh7 LR cells are long-term resistant to lenvatinib.
Statistical analysis
The statistical analysis was conducted using SPSS version 22.0 (Chicago, IL, USA) and GraphPad Prism version 7.0 software (La Jolla, CA, USA). The differences between the two groups were analyzed using Student’s t-test. The clinical characteristics were assessed using the Chi-square test, while correlation analysis was conducted with the Spearman correlation coefficient. Quantitative data were presented as the mean ± standard deviation. Survival rates were plotted using Kaplan–Meier estimates, and Cox proportional hazards regression analysis was performed to identify independent factors for prognosis. Statistical significance was defined as p<0.05 (*), p<0.01 (**), and p<0.001 (***).
Results
The expression of BAIAP2L2 is upregulated in HCC and is correlated with poor outcome
Pan-cancer analysis in the TCGA database revealed that the expression of BAIAP2L2 was upregulated in HCC tissues compared to normal tissues (Fig. 1A). The survival analysis in the TCGA database revealed that the overall survival and disease-free survival of HCC patients with high BAIAP2L2 expression were lower than those of patients with low BAIAP2L2 expression (Fig. 1B, C). To evaluate the clinical significance of BAIAP2L2 in HCC, we analyzed the expression level of BAIAP2L2 in 80 HCC cases. The results of qRT-PCR revealed that BAIAP2L2 mRNA was upregulated in HCC tissues (Fig. 1D). Western blot (Fig. 1E) and immunohistochemistry (IHC) (Fig. 1F, G and Fig. S1A) further confirmed the upregulation of the BAIAP2L2 protein in HCC tissues. Furthermore, the mRNA and protein levels of BAIAP2L2 were measured in HCC cell lines and the human hepatocyte cell line THLE-3 using qRT-PCR and western blot techniques. The results showed that both BAIAP2L2 mRNA and protein were upregulated in all seven HCC cell lines compared to THLE-3 (Fig. 1H, I). The clinicopathological analysis showed that BAIAP2L2 expression was closely related to tumor multiplicity, tumor size, and vascular invasion (Table 1). Patients with high BAIAP2L2 expression had a poorer overall survival. (Fig. 1J). Univariable and multivariable analyses demonstrated that BAIAP2L2 was an independent factor for the overall survival of individuals with HCC (Table 2). These results indicate that BAIAP2L2 may play an important role in the progression of HCC and potentially serve as a prognostic marker.

A Pan-cancer analysis of BAIAP2L2 expression in TCGA database. B, C Overall survival and disease-free survival of HCC patients with high or low expression levels of BAIAP2L2 (data from GAPIA). D qRT-PCR detection of BAIAP2L2 mRNA expression in 80 pairs of HCC specimens. E Western blot detection of BAIAP2L2 protein expression in eight pairs of HCC tissues (T) and corresponding adjacent tissues (P). F Immunohistochemical staining of BAIAP2L2 in 2 pairs of HCC tissues cut from 40 pairs of HCC tissue chips. The original magnifications were 50× (scale bar, 200 μm) and 400× (scale bar, 50 μm). G The quantification results of the BAIAP2L2 IHC score in 40 pairs of HCC tissues. H Western blot analysis of BAIAP2L2 protein abundance in HCC cell lines and normal hepatic THL1-3 cells. I The relative expression of BAIAP2L2 mRNA in HCC cell lines and immortalized human hepatocyte THLE1-3 cells was measured by qRT-PCR. J Overall survival analysis assessed the effect of BAIAP2L2 on overall survival in HCC. Bar graphs represent the mean ± SEM (n = 3). (*P < 0.05, **P < 0.01, ***P < 0.001).
BAIAP2L2 promotes HCC cell proliferation, stemness, and metastasis
According to the expression level of BAIAP2L2 in HCC cell lines, we used lentivirus to stably overexpress BAIAP2L2 in Hep3B and YY8103 cells, which had lower BAIAP2L2 expression compared to the other cell lines. BAIAP2L2 was knocked down using lentivirus carrying shRNA in HCCLM3 and Focus cells, both of which exhibited high BAIAP2L2 expression. The knockdown and overexpression efficiency of BAIAP2L2 was detected by western blot (Fig. 2A). To evaluate the influence of BAIAP2L2 on HCC cell proliferation, we performed CCK-8, colony formation, and EdU experiments. The above experiments all demonstrated that the downregulation of BAIAP2L2 significantly inhibited proliferation in HCCLM3 and Focus cells, whereas the overexpression of BAIAP2L2 promoted the proliferation of Hep3B and YY8103 cells (Fig. 2B–D and Figs. S2A–C, S3A–C).
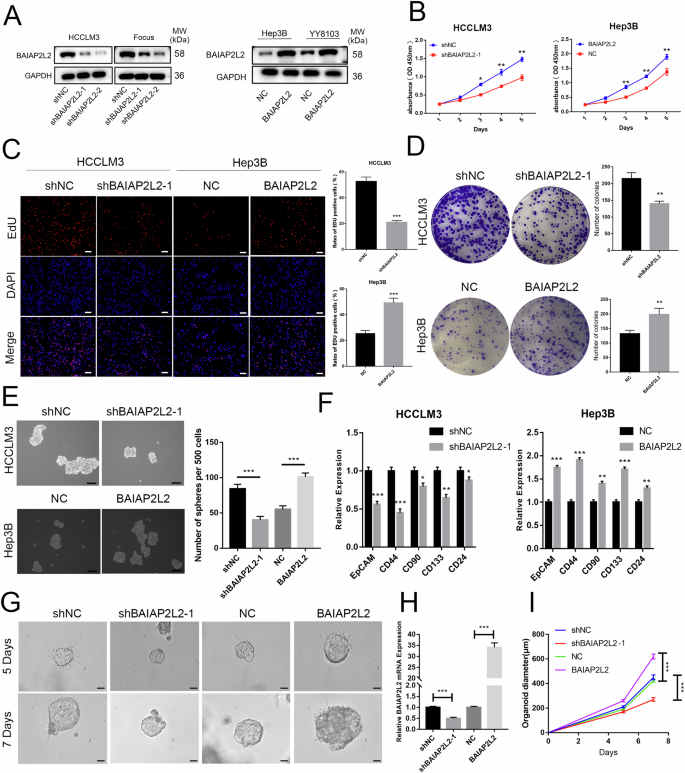
A Western blot analysis of BAIAP2L2 knockdown and overexpression efficiency following lentiviral transfection. B Growth curves based on the CCK-8 assay of BAIAP2L2-downregulated and BAIAP2L2-overexpressing HCC cells. C The EdU assay was performed to detect the proliferation of HCC cells transfected with different lentiviruses. Scale bar, 50 μm. D The effect of BAIAP2L2 knockdown and overexpression on cell proliferation was detected by a colony formation assay. E A Sphere-forming assay was conducted to detect the activity of HCC stem cells with BAIAP2L2 knockdown or overexpression, scale bar, 100 μm. F The expression of CSC-related genes in BAIAP2L2-knockdown and BAIAP2L2-overexpressing HCC hepatospheres was examined by qRT-PCR. G Images of HCC organoids infected with BAIAP2L2-knockdown or -overexpression lentivirus, scale bar, 50 μm. H BAIAP2L2 expression levels in organoids were measured by qRT-PCR. I Growth curves of HCC organoids after lentiviral infection. Bar graphs represent the mean ± SEM (n = 3). (*P < 0.05, **P < 0.01, ***P < 0.001).
HCC is heterogeneous and contains cells with stem-like properties [12, 13]. Cancer stem cells (CSCs) are believed to play a role in the initiation and progression of HCC [14, 15]. We utilized sphere-forming assays to isolate CSCs from HCC cell lines. The results showed that spherical structures were attenuated in BAIAP2L2-knockdown HCCLM3 and Focus cells and promoted in BAIAP2L2-overexpressing Hep3B and YY8103 cells (Fig. 2E and Figs. S2D, S3D). Meanwhile, the expression of CSC-associated markers (CD133, CD44, CD24, CD90, EpCAM) was measured using a qRT-PCR assay. The results suggest that the knockdown of BAIAP2L2 reduces the expression of stemness-related transcription factors and biomarkers associated with CSCs. Overexpression of BAIAP2L2 had the opposite effect (Fig. 2F). To further validate our findings, three-dimensional organoids derived from patients with HCC were created. We stably altered the expression of BAIAP2L2 by using lentivirus carrying shRNA or an overexpression plasmid. Then, we analyzed the expression of BAIAP2L2 in HCC tissue organoids using qRT-PCR (Fig. 2H). The results indicated that the knockdown of BAIAP2L2 resulted in smaller tumor organoids, while cells overexpressing BAIAP2L2 formed larger spheres (Fig. 2G, I).
We investigated the role of BAIAP2L2 in HCC cell migration and invasion using wound-healing and transwell assays. Both assays showed that downregulation of BAIAP2L2 suppressed cell migration and invasion in HCCLM3 and Focus cells, while overexpression of BAIAP2L2 enhanced the migration and invasion capacities of Hep3B and YY8103 cells (Fig. 3A, B and Figs. S2E, F, S3E, F).

A The role of BAIAP2L2 in the regulation of cell motility was assessed by wound-healing experiments, scale bar, 500 μm. B Transwell assays were performed to detect the effects of BAIAP2L2 downregulation and overexpression on cell migration and invasion, scale bar, 200 μm. C The role of BAIAP2L2 in the regulation of HCC cell apoptosis was verified by flow cytometry. D Western blotting was used to detect apoptosis-related proteins in HCC cells following knockdown or overexpression of BAIAP2L2. E The cell cycle results of HCC cells with either BAIAP2L2 overexpression or knockdown. F The expression of cell cycle-related proteins was examined by western blot. Bar graphs represent the mean ± SEM (n = 3). (*P < 0.05, **P < 0.01, ***P < 0.001).
BAIAP2L2 induces cell cycle progression and inhibits apoptosis
To investigate the potential role of BAIAP2L2 in HCC cell apoptosis, flow cytometry and western blot analyses were performed. As shown in Fig. 3C, upregulated BAIAP2L2 suppressed cell apoptosis, while downregulated BAIAP2L2 promoted cell apoptosis. We further detected apoptosis-related factors by western blotting. BAIAP2L2 overexpression inhibited the expression of cleaved Caspase 3 and cleaved Caspase 9 but increased Bcl2 expression. BAIAP2L2 knockdown had the opposite effect. (Fig. 3D).
By quantitatively analyzing the cell cycle distribution through flow cytometry, we found that overexpression of BAIAP2L2 increased the number of cells in the S and G2 phases of Hep3B cells, and downregulation of BAIAP2L2 decreased the number of HCCLM3 cells in the S and G2 phases (Fig. 3E). Furthermore, we detected the expression of cyclin-dependent kinase 6 (CDK6) and cyclin-dependent kinase 4 (CDK4) by western blotting. The results showed that overexpression of BAIAP2L2 promoted the expression of CDK4 and CDK6, and knockdown of BAIAP2L2 had the opposite result (Fig. 3F). The above experiments demonstrated that BAIAP2L2 suppressed cell apoptosis and enhanced cell cycle progression in HCC.
BAIAP2L2 facilitates tumor growth and metastasis in vivo
To further investigate the role of BAIAP2L2 in cell proliferation, we established a subcutaneous tumor model and an orthotopic xenograft model. For the subcutaneous tumor model, the results suggested that silencing BAIAP2L2 attenuated tumor growth, while overexpressing BAIAP2L2 promoted tumor growth, as indicated by the tumor volume and weight (Fig. 4A–C). IHC analysis of subcutaneous tumors indicated that the overexpression of BAIAP2L2 in YY8103 cells increased Ki67 staining while decreasing TUNEL staining. Conversely, the opposite effects were observed in HCCLM3 cells with BAIAP2L2 downregulation (Fig. 4D). The biological effect of BAIAP2L2 was further elucidated in vivo using an orthotopic xenograft model. The experiment also suggested that knockdown of BAIAP2L2 inhibited, while overexpression of BAIAP2L2 promoted, the growth of HCC cells in the liver of nude mice (Fig. 4E, F). These data illustrate that BAIAP2L2 stimulates HCC cell growth and inhibits apoptosis in vivo.
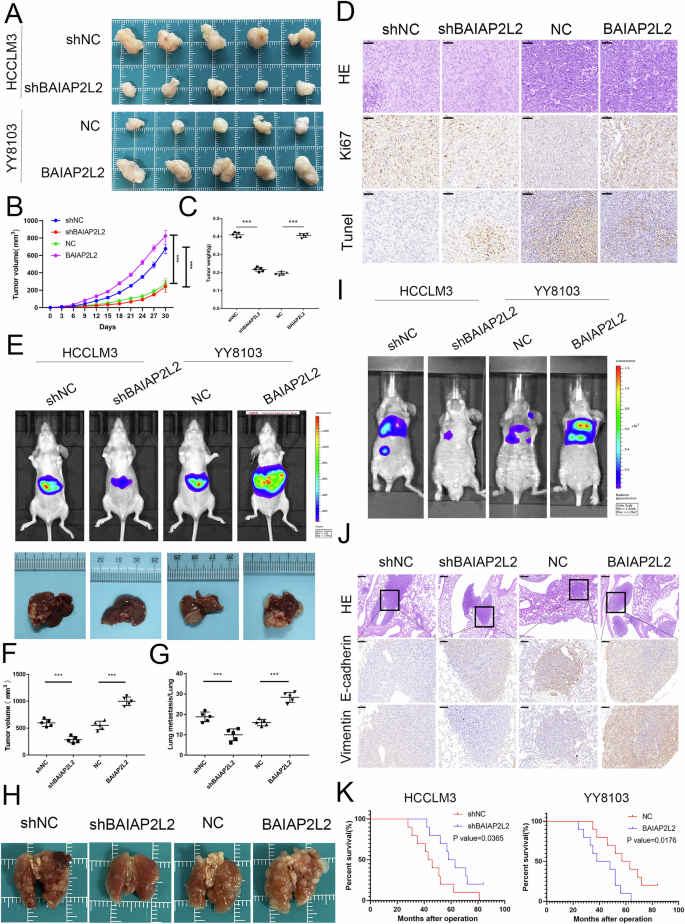
A Photograph of tumors obtained from nude mice. B, C Tumor weight and growth curves of the xenograft volumes. D Representative pictures of the protein levels of Ki67 and TUNEL were detected by immunohistochemistry in subcutaneous tumor tissues. Scale bar, 50 μm. E Fluorescence intensity and photograph of nude mouse livers orthotopically implanted with treated HCCLM3 and YY8103 cells. F Volumes of the xenograft-implanted tumors. G The number of lung metastatic foci was counted. H Representative images of lung tissues from the four indicated groups. I Bioluminescent photographs of the metastasis model in nude mice with tail vein injection of HCCLM3 cells with BAIAP2L2 knockdown and YY8108 cells with BAIAP2L2 overexpression. J HE staining (scale bar, 200 μm) and immunohistochemical detection (scale bar, 50 μm) of E-cadherin and vimentin in four groups of pulmonary metastases. K Overall survival curve of mice in the lung metastasis model with a 12-week cutoff. Bar graphs represent the mean ± SEM (n = 3). (***P < 0.001).
To investigate the impact of BAIAP2L2 on HCC cell metastasis in vivo, we established a nude mouse model of lung metastasis. Bioluminescence imaging and lung HE staining showed that knockdown of BAIAP2L2 significantly inhibited lung metastasis, while overexpression of BAIAP2L2 resulted in an increase in lung metastasis nodules (Fig. 4G–I). In addition, the staining of lung metastases for E-cadherin and vimentin demonstrated that knockdown of BAIAP2L2 inhibited the expression of vimentin and promoted the expression of E-cadherin (Fig. 4J). The mouse survival analysis of this model showed that the overall survival time of the mice in the overexpression group was significantly reduced, while the opposite results were observed in the knockdown group (Fig. 4K). Taken together, these results further demonstrate that BAIAP2L2 promotes HCC cell proliferation and metastasis.
NFκB1 activates transcription of BAIAP2L2 in HCC cells
We explored the potential regulators involved in the upregulation of BAIAP2L2 by analyzing its promoter. As shown in Fig. 5A, B, the promoter activity of BAIAP2L2 decreased significantly in the −1000 to −500 region. This suggests that the −1000/−500 region is necessary for the transcription of BAIAP2L2. To identify the transcription factors of BAIAP2L2 in HCC cells, we utilized the PROMO program, an online tool designed to predict transcription factors and their corresponding binding sites within the −1000/−500 region. Meanwhile, we retrieved information regarding the transcription factors associated with the BAIAP2L2 gene using the ENCODE database. NFκB1 and PAX-5 were predicted to be transcription factors of BAIAP2L2 by two databases (Fig. 5C). Then, NFκB1 and PAX-5 were overexpressed in 293T cells transfected with pGL3-1000, respectively. pGL3-1000 promoter activity was significantly enhanced in the NFκB1 overexpression group, but not in the PAX-5 overexpression group (Fig. 5D). Western blot results showed that the expression of BAIAP2L2 was downregulated in NFκB1-knockdown HCCLM3 cells and upregulated in NFκB1-overexpressing Hep3B cells (Fig. 5E). Spearman correlation analysis revealed a positive correlation between BAIAP2L2 expression and NFκB1 levels in 80 pairs of HCC tissues (Fig. 5F). Next, we determined whether NFκB1 could bind to the promoter of BAIAP2L2 using a ChIP assay. As shown in Fig. 5G, the BAIAP2L2 promoter was enriched by the anti-NFκB1 antibody in HCCLM3 and Hep3B cells. We obtained the NFκB1-binding motif from the JASPAR database (Fig. 5H) and identified two high-scoring NFκB1-binding sites in the promoter of BAIAP2L2 using PROMO. To investigate the impact of the two potential NFκB1-binding sites on the regulation of the BAIAP2L2 promoter, we created three mutations: mut (−522 to −532 bp), mut (−984 to −994 bp), and mut (−522 to −532 bp, −984 to −994 bp). The results of the luciferase report showed that the promoter activity of the single-site mutant plasmid (−522 to −532 bp) and (−984 to −994 bp) in HCCLM3 and Hep3B cells was reduced by 40% ~60% compared to the wild-type control, respectively. However, the promoter activity of the double-site mutant plasmid was reduced by 80%–90% (Fig. 5I). These data suggest that the two NFκB1-binding sites function independently. Taken together, NFκB1 stimulates the transcription of BAIAP2L2 in HCC by directly binding to its promoter region.

A Schematic diagram of the BAIAP2L2 promoter fragments of −2000~0 bp, −1500~0 bp, −1000~0 bp, −750~0 bp, −500~0 bp, and −250~0 bp cloned upstream of the firefly luciferase reporter gene in the pGL3-basic vector. B Detection of the transcriptional activity of the BAIAP2L2 promoter fragment by luciferase activity assays in 293T cells. C Venn diagram showing that NFκB1 and Pax-5 were predicted to bind to the BAIAP2L2 promoter by ENCODE and PROMO. D Luciferase activity assays demonstrated that NFκB1 observably increases the promoter activities of pGL3 − 1000/0. E Western blot assays showed that knockdown of NFκB1 inhibits the expression of BAIAP2L2 in HCCLM3 cells, while overexpression of NFκB1 enhances the expression of BAIAP2L2 in Hep3B cells. F Spearman’s correlation analysis was performed to analyze the association between NFκB1 and BAIAP2L2 in 80 HCC samples. G ChIP‒qPCR analysis showed that the BAIAP2L2 promoter fragment could be enriched by an anti-NFκB1 antibody in HCCLM3 and Hep3B cells. H The binding motif of NFκB1 was obtained from the JASPAR database. I Luciferase activity of the BAIAP2L2 promoter was reduced when (−522 to −532 bp), (−984 to −994 bp) and the two-site mutation (−522 to −532 bp, −984 to −994 bp) were mutated in HCCLM3 and Hep3B cells. Bar graphs represent the mean ± SEM (n = 3). (*P < 0.05, **P < 0.01, ***P < 0.001).
BAIAP2L2 inhibits the ubiquitin-mediated degradation of GABPB1 and facilitates the nuclear translocation of GABPB1
To investigate the mechanism of BAIAP2L2 in HCC, we utilized BioGRID, STRING, and HitPredict to predict the proteins that interact with BAIAP2L2. As shown in Fig. 6A, GAPBP1 and GRXCR1 were predicted to be putative BAIAP2L2-interacting proteins by all three databases. GABPB1 has been reported to be involved in a variety of tumor progressions. Therefore, we focused on the ability of BAIAP2L2 to interact with GAPBP1 in order to promote HCC progression. Co-IP assays showed that GABPB1 was immunoprecipitated with the anti-Flag BAIAP2L2 antibody, and BAIAP2L2 could also be enriched by the anti-Flag GABPB1 antibody (Fig. 6B). Co-IP analysis using full-length and truncated BAIAP2L2 (Fig. S4A) indicated that the Src homology 3 (SH3) domain (331–385 aa) of BAIAP2L2 was primarily responsible for its interaction with GABPB1 (Fig. 6C and Fig. S4B). In addition, immunofluorescence (IF) results also showed that GABPB1 and BAIAP2L2 colocalized in Hep3B and HCCLM3 cells (Fig. 6D and Fig. S4C).

A The interacting proteins of BAIAP2L2 were predicted using the BioGRID, STRING, and HitPredict databases. B Co-IP experiments showed that GABPB1 could be enriched by the anti-Flag-BAIAP2L2 antibody, and BAIAP2L2 was immunoprecipitated with the anti-Flag-GABPB1 antibody. C Western blot analysis of the relationship between GABPB1 and full-length BAIAP2L2 or truncated BAIAP2L2 in HCCLM3 cells. D Immunofluorescence images showing the co-localization of BAIAP2L2 and GABPB1 in HCCLM3 cells. Scale bar, 20 μm. E, F Western blot analysis detected changes in GABPB1 expression in HCC cells with BAIAP2L2 knockdown or overexpression after CHX (50 μg/mL) treatment. The relative GABPB1 protein level was graphed. G GABPB1 expression in HCC cells with BAIAP2L2 knockdown or overexpression was examined by western blot. H Western blot analysis showed that the expression level of GABPB1 was restored in HCCLM3-shBAIAP2L2 cells after treatment with MG132 (20 μM, 6 h). I Co-IP assay to detect the effect of BAIAP2L2 expression on GABPB1 ubiquitination. J Immunofluorescence staining of BAIAP2L2 and GABPB1 in BAIAP2L2-overexpressing Hep3B cells and NC-Hep3B cells, Scale bar, 20 μm. K Expression of GABPB1 in the cytoplasm and nucleus of BAIAP2L2-overexpressing Hep3B cells or BAIAP2L2-knockdown HCCLM3 cells was analyzed by western blot. Bar graphs represent the mean ± SEM (n = 3). (*P < 0.05, **P < 0.01, ***P < 0.001).
To evaluate the impact of BAIAP2L2 binding on GABPB1, we examined the protein stability of GABPB1 using cycloheximide (CHX), a protein synthesis inhibitor. The results demonstrated that the degradation rate of GABPB1 was significantly reduced when BAIAP2L2 was overexpressed, and conversely, increased when BAIAP2L2 was knocked down (Fig. 6E, F). GABPB1 protein expression was decreased in HCCLM3 cells with BAIAP2L2 knockdown and upregulated in Hep3B cells overexpressing BAIAP2L2 (Fig. 6G). In addition, the proteasome inhibitor MG132 restored the decrease in GABPB1 protein levels induced by BAIAP2L2 knockdown. (Fig. 6H). These results suggest that BAIAP2L2 can maintain the stability of GABPB1 by inhibiting its protease degradation. Given the presence of ubiquitination sites on GABPB1 (Fig. S4D), we further investigated whether BAIAP2L2 inhibits the protease degradation of GABPB1 by regulating its ubiquitination. The result of western blot and immunoprecipitation showed that ubiquitination of GABPB1 was enhanced in BAIAP2L2-knockdown HCCLM3 cells and decreased in BAIAP2L2-overexpressing Hep3B cells (Fig. 6I). These results indicated that BAIAP2L2 inhibited the proteasomal degradation of GABPB1 by inhibiting its ubiquitination.
Interestingly, IF results revealed a significant increase in the nuclear translocation of GABPB1 in BAIAP2L2-overexpressing Hep3B cells (Fig. 6J). We then detected the protein levels of GABPB1 in the nucleus and cytoplasm of HCC cells. The results indicated that the expression of GABPB1 was significantly increased in the nucleus of Hep3B cells overexpressing BAIAP2L2, while it was decreased in the nucleus of HCCLM3 cells with BAIAP2L2 knockdown (Fig. 6K). These results demonstrate that BAIAP2L2 promotes the nuclear translocation of GABPB1.
BAIAP2L2 promotes HCC cell progression by interacting with GABPB1
In order to investigate the impact of BAIAP2L2 on the regulation of GABPB1 and its effect on the progression of HCC, we knockdown the expression of GABPB1 in Hep3B-BAIAP2L2 cells and overexpressed GABPB1 in HCCLM3-shBAIAP2L2 cells. The findings of this study revealed that the enhanced proliferative capacity, stemness, metastatic potential, cell cycle progression, and resistance to apoptosis observed in Hep3B-BAIAP2L2 cells were reversed upon knockdown of GABPB1 (Fig. S5A–G), and vice versa (Fig. S6A–G). These results suggest that BAIAP2L2 plays a role in regulating the malignant phenotype of HCC through its interaction with GABPB1.
BAIAP2L2 decreases intracellular ROS levels via GABPB1
To explore the mechanism by which the BAIAP2L2/GABPB1 axis regulates HCC progression, we conducted RNA sequencing on three pairs of BAIAP2L2-overexpressing Hep3B cells and negative control cells (Fig. 7A, B). Meanwhile, ChIP-seq data of GABPB1 in the HCC cell line HepG2 (Input: ENCSR239QGH, GABPB1: ENCSR462KYU) were obtained from the ENCODE database (Fig. 7C, D). The overlapping genes of RNA-sequencing and chip-sequencing (Fig. 7E) were analyzed using KEGG pathway analysis (Fig. 7F) and GO enrichment analysis (Fig. 7G). The results revealed that the BAIAP2L2/GABPB1 axis is involved in regulating the cell cycle, maintaining stemness, apoptosis, and ubiquitination modification. These results further support the cellular functions and mechanisms of our aforementioned study. Notably, the KEGG pathway analysis revealed that the BAIAP2L2/GABPB1 axis is closely associated with ROS. GABPB1 is a key gene involved in mitochondrial biogenesis and function. GO enrichment analysis revealed that the BAIAP2L2/GABPB1 axis is involved in regulating mitochondrial gene expression, oxidative phosphorylation, and the electron transport chain. Gene set enrichment analysis (GSEA) further showed that the BAIAP2L2/GABPB1 axis negatively regulates ROS (Fig. 7H). Extensive research has demonstrated the significant role of ROS in the development of cancer. Consequently, it is hypothesized that the BAIAP2L2/GABPB1 axis regulates the mitochondrial oxidative phosphorylation process by controlling the expression of genes related to the mitochondrial inner membrane. This regulation inhibits mitochondrial ROS production and promotes the progression of HCC. To investigate this, JC-1 staining was used to determine the changes in mitochondrial membrane potential. The outcomes revealed a significant decrease in the red/green fluorescence ratio in HCCLM3 cells with suppressed expression of BAIAP2L2. However, this reduction was subsequently reversed upon the introduction of GABPB1 overexpression. Conversely, overexpression of BAIAP2L2 resulted in the opposite effect (Fig. 7I). These findings suggest that BAIAP2L2 inhibits the decline in mitochondrial potential and the occurrence of mitochondrial impairment by interacting with GABPB1. Then, we used DCF-DA to measure the levels of ROS in HCC cells. The findings revealed that levels of ROS increased following the knockdown of BAIAP2L2 but were subsequently restored upon overexpression of GABPB1, and vice versa (Fig. 7J). This suggests that BAIAP2L2 reduces intracellular levels of ROS through its interaction with GABPB1.

The RNA-seq heatmap (A) and volcano map (B) of three pairs of BAIAP2L2-overexpressing Hep3B cells and negative control cells. C, D Density plot showing the ChIP-sequencing result of high-confidence GABPB1 peaks, ranked by intensity. E Venn diagram of overlapping genes between RNA-sequencing and ChIP-sequencing. KEGG pathway analysis (F) and GO enrichment analysis (G) of the overlapping genes between RNA-sequencing and ChIP-sequencing. H GSEA analysis of subsets of genes related to the ROS. I Immunofluorescence analysis of JC-1 in HCCLM3 and Hep3B cells. Scale bar, 20 μm. J Immunofluorescence analysis of ROS in HCCLM3 and Hep3B cells. Scale bar, 20 μm. Bar graphs represent the mean ± SEM (n = 3). (***P < 0.001).
The impact of ROS on the function of HCC, which is regulated by BAIAP2L2, was further explored by pretreating HCC cells with the essential ROS scavenger N-acetyl-l-cysteine (NAC). Notably, pretreatment with NAC significantly restored the proliferation, metastasis, stemness, cell cycle, and apoptosis of BAIAP2L2 knockdown cells (Fig. 8A–G and Fig. S7A–F).

A–C The proliferation ability of HCCLM3 cells treated with 5 mM NAC was assessed using the EdU, colony formation, and CCK-8 assay. D A Sphere-forming assay was conducted to detect the stemness of HCCLM3 cells treated with NAC. E A Transwell assay was conducted to detect the migration and invasion of HCCLM3 cells treated with NAC. F, G Cell cycle progression and cell apoptosis of HCCLM3 cells treated with NAC were determined by flow cytometry. H Half-maximal inhibitory concentration curves of lenvatinib sensitive Huh7 cells (LS) and lenvatinib resistance Huh7 cells (LR) cells. I The expression of BAIAP2L2 in Huh7 LS cells and Huh7 LR cells was assessed by western blotting and qRT-PCR. J Western blot analysis was conducted to evaluate the knockdown efficiency of BAIAP2L2 in Huh7 LR cells and the overexpression efficiency of BAIAP2L2 in Huh7 LS cells. K, L Half-maximal inhibitory concentration curves of LR/LS Huh7 cells with knockdown or overexpression of BAIAP2L2. M CCK-8 assay measures the proliferative capacity of Huh7 LR cells. N Cell apoptosis of Huh7 LR cells treated with DMSO or lenvatinib was determined by flow cytometry. Bar graphs represent the mean ± SEM (n = 3). (*P < 0.05, **P < 0.01, ***P < 0.001).
BAIAP2L2 promotes HCC resistance to lenvatinib
Lenvatinib is emerging as the first-line therapeutic option for advanced HCC, but drug resistance remains a major obstacle to its long-term treatment efficacy. It has been reported that ROS play an important role in lenvatinib resistance. KEGG enrichment analysis showed that BAIAP2L2/GABPB1 axis was involved in tumor drug resistance. Therefore, we further investigated the role of BAIAP2L2 in lenvatinib resistance. It has been reported that the Huh7, a commonly used HCC cell line, is responsive to lenvatinib. We generated Huh7 LR cells by gradually subjected the cells to lenvatinib. The resistant cells showed higher IC50 values to lenvatinib (Fig. 8H). Next, the Huh7 LR cells were cultured either in the absence of lenvatinib or with 10 μM of lenvatinib for a duration of 4 weeks. The detection of IC50 values revealed no significant difference between the Huh7 LR cells cultured without lenvatinib and those continuously exposed to lenvatinib (Fig. S7G). This indicates that Huh7 LR cells were long-term resistant to lenvatinib. qRT-PCR and western blot analysis showed that the expression of BAIAP2L2 was upregulated in lenvatinib-resistant cells (Fig. 8I). To further elucidate the role of BAIAP2L2 in regulating lenvatinib resistance, we knocked down BAIAP2L2 in Huh7 LR cells and overexpressed BAIAP2L2 in Huh7 LS cells (Fig. 8J). The IC50 of LR-shBAIAP2L2 was lower than that of LR-NC (Fig. 8K), while the IC50 of LS-BAIAP2L2 was significantly higher than that of LS-NC (Fig. 8L). The CCK-8 and flow cytometry assays demonstrated that treatment with lenvatinib alone had no significant impact on the proliferation and apoptosis of Huh7 LR cells. However, the knockdown of BAIAP2L2 increased the sensitivity of Huh7 LR cells to Lenvatinib (Fig. 8M, N). This suggests that BAIAP2L2 decreased the sensitivity of HCC to lenvatinib. These findings may offer new insights into the treatment of patients with lenvatinib resistance.
Discussion
HCC is one of the most lethal malignancies in the world. Due to the lack of early diagnostic indicators of HCC, as well as its high proliferation and highly invasive characteristics, many patients have passed the time where surgery might be indicated by the time of diagnosis. With the emergence of targeted drugs such as sorafenib, lenvatinib and immunotherapy based on immune checkpoint inhibitors, the prognosis of HCC patients has been markedly transformed. However, many patients still cannot benefit from existing targeted drugs. Therefore, it is important to improve the mechanism of HCC development and to find sensitive therapeutic targets or prognostic biomarkers.
BAIAP2L2, also known as Pinkbar, is a member of the I-BAR protein family, located on chromosome 22q13.1 [16] and was originally discovered to play a role in the regulation of cell membrane formation [17]. The I-BAR family plays a key role in generating membrane filopodia during cell migration and morphogenesis [18]. Previous studies have shown that BAIAP2L2 maintains a regulatory role in tumorigenesis. In prostate cancer, BAIAP2L2 was demonstrated to promote prostate cancer progression through VEGF and apoptosis signaling pathways [19]. In HCC, Wei et al. conducted a bioinformatics analysis utilizing databases such as TCGA and GEO. They discovered that BAIAP2L2 is upregulated in HCC and is associated with poor prognosis. Additionally, they validated through in vitro experiments that BAIAP2L2 promotes the migration and invasion of HCC cells [10]. We further assessed the clinical significance of BAIAP2L2 by collecting clinical specimens from the Hepatobiliary Center of the First Affiliated Hospital of Nanjing Medical University and performing a clinical data analysis. Through both in vitro and in vivo experiments, we confirmed the role of BAIAP2L2 in promoting HCC cell metastasis. We also found that BAIAP2L2 enhances HCC cell proliferation, increases stemness, and inhibits apoptosis. Furthermore, we investigated the mechanism underlying the upregulation of BAIAP2L2 expression in HCC and discovered that NFκB1 activates BAIAP2L2 expression by binding to its promoter region.
GABPB1 was identified as the downstream target of BAIAP2L2. GABPB1 is a transcription factor that interacts with purine-rich repeats (GA repeats) [20]. GABPB1 is involved in the progression of various tumors [21, 22]. Our results indicated that BAIAP2L2 could bind to GABPB1 through the SH3 domain. BAIAP2L2 inhibits the proteasomal degradation of GABPB1 by preventing its ubiquitination and facilitates the nuclear translocation of GABPB1. A series of rescue experiments showed that GABPB1 mediates the effects of BAIAP2L2 in promoting HCC progression.
RNA-seq and ChIP-seq were used to explore the regulatory mechanism of the BAIAP2L2/GABPB1 axis on HCC progression. By performing KEGG pathway and GO enrichment analysis on the overlapping genes from RNA-sequencing of BAIAP2L2 and chip-sequencing of GABPB1, we discovered that the BAIAP2L2/GABPB1 axis is involved in regulating cellular oxidative stress and ROS. Research has demonstrated the significant role of ROS in the development of cancer [23, 24]. The response to ROS involves the regulation of epigenetic mechanisms that control gene expression, such as the alteration of DNA methyltransferase or histone deacetylase activity, as well as the oxidation of hypomethylated DNA resulting from DNA damage [25]. These responses promote the transformation of normal cells into cancer cells. Meanwhile, ROS originating from cellular membranes and mitochondria can oxidize cysteine residues in proteins, thereby modulating their activity. This reversible oxidation process has been observed in various proteins involved in signaling pathways that are critical for the survival, proliferation, metabolism, invasion, and metastasis of cancer cells [26,27,28]. Studies have shown that GABPB1 is a master regulator of nuclear-encoded mitochondrial genes [29]. Our previous study demonstrated that BAIAP2L2 inhibits GABPB1 degradation and facilitates its nuclear translocation. Hence, it is hypothesized that BAIAP2L2 promotes malignancy in HCC through GABPB1-mediated ROS imbalance. Our data showed that inhibition of BAIAP2L2 leads to the loss of mitochondrial potential and triggers ROS accumulation, and GABPB1-mediated ROS imbalance is essential for the biological functioning of BAIAP2L2 in HCC.
Sorafenib served as the only first-line targeted drug for nearly 10 years, and recently lenvatinib has emerged as the second targeted drug for first-line therapy in HCC. ROS plays an important role in resistance to lenvatinib. Lenvatinib can induce the production of ROS by inhibiting specific downstream pathways of tyrosine kinases. This, in turn, leads to therapeutic effects through ROS-mediated cell death [30]. Tan et al. found that lenvatinib could increase levels of ROS and induce cell apoptosis by inhibiting GPX2 expression in HCC cells [31]. Zhang et al. suggested that the hypoxia-responsive PPARGC1A/BAMBI/ACSL5 axis promotes resistance to lenvatinib in HCC by inducing ROS production and lipid peroxidation [32]. KEGG enrichment analysis revealed that the BAIAP2L2/GABPB1 axis is implicated in tumor drug resistance. Hence, we speculate that BAIAP2L2 may have an impact on the resistance of HCC to lenvatinib. Our data showed that BAIAP2L2 was upregulated in lenvatinib-resistant cells and decreased the sensitivity of HCC to lenvatinib. These findings may provide new insights into the underlying mechanisms of chemoresistance to lenvatinib in HCC.
In summary, our results showed that BAIAP2L2 was upregulated in HCC and was identified as an independent risk factor for the prognosis of HCC patients. NFκB1 activates the expression of BAIAP2L2 by binding to its promoter region. BAIAP2L2 inhibits the degradation of GABPB1 and enhances its nuclear translocation. This process promotes HCC progression and contributes to lenvatinib resistance by inhibiting mitochondrial ROS production. Our study identifies potential therapeutic targets and biomarkers for HCC.
Responses