Baicalein inhibits cell proliferation and induces apoptosis in brain glioma cells by downregulating the LGR4-EGFR pathway
Introduction
Brain glioma is the most common intracranial tumor with a high mortality rate [1]. Despite intensive efforts, the therapeutic options for brain glioma remain limited, and the mean survival time for patients is less than two years following diagnosis [2]. Similar to the majority of cancers, the high death rate of brain glioma results from cancer cells possessing the features of indefinite proliferation, dysregulated apoptosis, and infiltration into adjacent tissues frequently [3]. Despite the utilization of aggressive surgery, radiation therapy, and chemotherapy in brain glioma patients, brain glioma remains fatal [4]. Consequently, there is a pressing need for the development of novel therapeutic strategies for the effective treatment of brain glioma.
LGR4, also known as GPR48, has been found to be highly expressed in many cancer tissues, including glioma tissues [5]. A published study has revealed that LGR4 can promote the progression, invasion, and metastasis of cancer by activating the Wnt/β-catenin pathway [6]. EGFR expression level always contributes to cancer development and worse prognosis [7]. Many functions of cancer stem cells rely on EGFR, including stemness, metabolism, immunomodulatory activity, dormancy, and resistance to therapy [8]. LGR4 has been demonstrated to possess the capacity to regulate the level and activity of EGFR [9]. Mechanistically, LGR4 can interact with EGFR, preventing EGFR degradation and ubiquitination, thereby leading to the persistent activation of EGFR [9]. A published study has suggested that the LGR4/EGFR pathway facilitates tumor development and contributes to maintaining the features of stem cells in hepatocellular carcinoma [8]. In addition, previous research has suggested that the LGR4-EGFR pathway may serve as a potential therapeutic target for breast cancer (BC), and deactivating the LGR4-EGFR pathway can inhibit the metastasis of BC cells [9]. Nevertheless, there is currently no clear evidence to suggest that LGR4 plays a role in brain glioma via the regulation of EGFR.
Baicalein (BAI) is the principal flavonoid isolated from S.baicalensis, which possesses numerous beneficial properties and is always utilized for treating multiple ailments [10]. Recent research has revealed that BAI exerts its anticancer activity by facilitating apoptosis, blocking cell growth, activating autophagy, and regulating some molecular pathways, such as the EGFR/ERK/NF-κβ pathway [11] or the EGFR/ERK/Akt pathway [12]. Moreover, scholars have overlapped BAI targets with oral squamous cell carcinoma-associated genes and found that EGFR belongs to the top 10 genes with high centrality measures [13]. However, the specific roles and mechanisms of BAI in brain glioma are still unclear.
Therefore, in this research, we conducted in vitro and in vivo experiments to explore whether BAI could exert its protective effects against brain glioma by downregulating the LGR4-EGFR pathway. Thus, we provided a novel strategy and potential therapeutic targets to treat brain glioma.
Materials and methods
LGR4 expression analysis
Gene Expression Profiling Interactive Analysis (GEPIA) and the Human Protein Atlas (HPA) databases were employed for public data analysis (the website of GEPIA is http://gepia.cancer-pku.cn/ and the website of HPA is https://www.proteinatlas.org/). The expression of LGR4 in tumor tissues of brain lower-grade glioma (LGG) was analyzed by GEPIA using The Cancer Genome Atlas and Genotype-Tissue Expression samples. Additionally, GEPIA was also employed to calculate the overall survival of patients with LGG patients based on LGR4 expression. Furthermore, HPA exhibited the expression of LGR4 in the brain tissues of patients with or without brain glioma.
Cell culture and transfection
The human brain glioma cell lines, including U-251 MG (Delf-10605), A172 (Delf-10588), HS683 (Delf-10589), KNS89 (Delf-10606), U-87 MG (Delf-10592), U-118 MG (Delf-10591), were supplied by Sai Baikang Biotechnology (China), and the human astrocytes (SVGP12, CRL-8621) were obtained from American Type Culture Collection (USA). All cells were authenticated by short tandem repeat profiling and were free of mycoplasma contamination. Furthermore, the mouse astrocytes utilized in the study were extracted from the mouse as previously described [14]. All cells were cultured in Dulbecco’s modified eagle medium containing 10% fetal bovine serum at 37 °C in a CO2– and humidity-controlled incubator.
For cell transfection, small interfering RNA (siRNA) targeting human LGR4 and CBL (si-LGR4 and si-CBL), control siRNA (si-NC), LGR4 overexpression vector (pEX-3 (pGCMV/MCS/Neo)-LGR4, oe-LGR4), EGFR overexpression vector (pcDNA3.1-EGFR, oe-EGFR) and control vectors (pEX-3 (pGCMV/MCS/Neo) plasmid and pcDNA3.1 plasmid) were synthesized by Shanghai Jima Pharmaceutical Technology Company Limited (China). All cells were transfected with Lipofectamine 3000, and harvested 48 h after transfection. The concentrations of siRNA and vector used during transfection were 20 nM and 2 μg, respectively. The siRNA sequences used in cell transfection are presented in Table 1.
Cell counting kit-8 (CCK-8) assay
The viability of the cells was evaluated using the CCK-8 assay kits (C0039, Biyuntian, China). In short, the cells were seeded and cultured in 96-well plates (3 × 10³ cells/well) with or without BAI. Following incubation for a predetermined time, 10 μL of CCK-8 solution was added to each well, and the cells were incubated for a further 4 h. Thereafter, the absorbance at 450 nm was tested using a microplate reader (CMaxPlus, MD, USA).
Counting the number of cells
The cells (5 × 10⁴ cells/well) were cultured in 96-well plates with 0, 20, 40, and 80 μM of BAI at 37 °C in a CO2– and humidity-controlled incubator. After 48 h, the medium was removed, and the cells were photographed by a light microscope to count the number of cells.
In addition, clone formation assays were conducted to evaluate the proliferation ability of the cells. In brief, cells (1 × 10³ cells/well) were seeded in six-well plates containing with or without BAI. Every three days, the media was replaced. Following two weeks of culture, the cells were rinsed with phosphate buffer saline (PBS), fixed with 1 mL paraformaldehyde (4%) for 60 min, and stained by 1000 μL crystal violet for 2 min. Then, the images of the wells were scanned, and the number of colonies was calculated. Colonies containing 50 or more cells were considered a clone.
5-ethynyl-20-deoxyuridine (EdU) assay
The proliferation of cells was detected using the EdU cell proliferation kits (C0078s, Biyuntian, China). Briefly, cells (1 × 10⁴ cells/well) were seeded into a 12-well plate. Following treatment, 500 µL of EdU solution was applied to incubate the cells for 4 h. After washing with PBS, the cells were fixed by 95% ethanol for 5 min and infiltrated in 0.3% TritonX-100 for 3 min. Subsequently, the cells were reacted with 0.5 mL of Click reaction mixture and 1 mL of 4’,6-diamidino-2-phenylindole, both reactions were conducted under a light-shielding environment. Finally, the staining results were visualized with a fluorescence microscope at 200 magnification.
Apoptosis detection
Cells were seeded in six-well plates at a density of 1.2 × 10⁶ cells/well, and cultured with or without BAI for suitable times. Then, the cells were collected, rinsed twice with ice-cold PBS, and centrifuged to obtain a cell suspension. Thereafter, the cells were stained with 5 μL Annexin V-FITC and 10 μL PI at room temperature (RT) in darkness (556547, BD, Singapore). Finally, the apoptosis rate of the cells was determined with the aid of flow cytometry (NovoCyte, Agilent, China) within 1 h.
Transwell assay
Cell invasion and migration ability were assessed by Transwell assays. For the invasion assay, matrigel (100 μL, 1 mg/mL; 356234, BD, USA) was added to the Transwell upper chamber. After treatment, cells were seeded evenly in a 24-well plate (3 × 10⁴ cells/well) with serum-free media and added to the upper chamber pre-coated with matrigel. Medium containing 10% fetal bovine serum was loaded into the bottom chamber. After incubation for 24 h, the cells on the upper surface of the membrane were removed using a cotton swab. The cells that invaded the bottom chamber were fixed with 4% formaldehyde for 10 min, dyed with 0.1% crystal violet for 30 min, and counted under the microscope. For the migration assay, all the steps were the same as those conducted in the invasion assay, with the exception that matrigel was not used in the upper chamber.
RNA extraction and quantitative PCR (qPCR)
After treatment, the total RNA was extracted from the cell lines using the EZ-10 Total RNA miniprep kits (B618583-0100, Sangon Biotech, China), and transcribed to cDNA reversely by reverse transcription kits (CW2569, CWBio Co., Ltd., China). To quantify the expression of target genes, qPCR was carried out with SYBR Green qPCR kits (11201ES08, Yeasen, China) and specific primers. The β-actin gene was used as an internal control. All the primer sequences used in the research are presented in Table 2.
Western blotting analysis
The total proteins of the cells and tissues were isolated using a radioimmunoprecipitation assay buffer (P0013B, Biyuntian, China). The bicinchoninic acid protein assay kit (P0012, Beyotime, China) was employed to measure the protein concentration. Then, equal amounts of proteins were separated by 10% sodium dodecyl sulfate-polyacrylamide gel electrophoresis and transferred to polyvinylidene difluoride membranes (IPVH00010, Millipore, USA). After blocking with 5% non-fat milk for 1.5 h, the membranes were incubated with primary antibodies overnight at 4 °C. On the second day, the membranes were reacted with horseradish peroxidase secondary antibodies at RT. Thereafter, the protein blots were developed using chemiluminescence kits. In this experiment, β-actin was served as a control. The information on the primary antibodies applied in the study is exhibited in Table 3.
Ubiquitination assay
A ubiquitination assay was conducted with MG132. In short, after the completion of transfection, the cells were divided into four groups according to the transfected siRNA as followed: si-NC, si-LGR4, si-NC + MG132 and si-LGR4 + MG132. The cells in the si-NC + MG132 and si-LGR4 + MG132 groups were treated with MG132 (proteasome inhibitor), while the other groups were treated with the same volume of dimethyl sulfoxide. After incubation for 8 h, the cells were collected and analyzed by Western blotting analysis.
Protein turnover assay
Following transfection with specific plasmids, 100 μg/mL of cycloheximide (CHX, protein synthesis inhibitor) was added to the cells. After incubation for the indicated time, the cells were collected, and western blotting analyses were conducted.
Biophysical techniques
The binding affinity between LGR4 and BAI was quantified by microscale thermophoresis (MST), which was conducted using a Monolith NT.115 instrument (NanoTemper Technologies, Germany) in cell lysates. LGR4 was labeled by the Monolith protein labeling kit RED-NHS 2nd Generation (MO-L011, NanoTemper Technologies GmbH, Germany). Then, the affinity was measured under an MST buffer. In short, the samples were immersed in NT.115 standard-treated capillaries. Then, the measurements were performed at 40% IR power, with a fixed concentration of labeled LGR4 and a constantly increasing concentration of BAI. Finally, MO. Affinity Analysis software was applied for data analysis.
Cellular thermal shift assay (CETSA)
Cells were treated with BAI (80 μM) or dimethyl sulfoxide (0.1% v/v) for 1 h. Following this, the cells were harvested and distributed into seven tubes equally. Each tube was then heated for 3 min at the following temperatures: 41 °C, 43 °C, 47 °C, 50 °C, 53 °C, 56 °C, and 61 °C, then the tubes were cooled for 3 min at RT. Following this, the samples were subjected to freeze-thaw cycles three times with liquid nitrogen to lyse the cells. After the reaction, the lysates were centrifuged, and the supernatants were collected for Western blotting analysis.
In vivo experiments
All animal experiments were approved by the Animal Experimentation Ethics Committee of Zhejiang Eyong Pharmaceutical Research and Development Center (Certificate No. SYXK (Zhe) 2021-0033) and were conducted in accordance with the guidelines of the Institutional Animal Care and Use Committee.
Male BALB/c nude mice (5–6 weeks old, 17–20 g) in specific pathogen-free class were purchased from Beijing Vital River Laboratory Animal Technology Co., Ltd. All mice were kept in a controlled environment (12 h light/dark cycle, 20–24 °C, 50–60% humidity) with free access to food and water. The transfected HS683 cells in the logarithmic phase were harvested to prepare a cell suspension, and the density of the suspension was adjusted to 2.5×10⁷/mL with saline. In order to establish brain glioma animal models, 200 μL of cell suspension was injected into the right axilla of the mice subcutaneously [15]. Once the average tumor size reached 150 mm3, mice injected with HS683 cells transfected with vector were randomly allocated to the Vector and Vector+erlotinib (ERL, EGFR inhibitor) groups according to the number random table method, and mice injected with HS683 cells transfected with oe-LGR4 were also randomly allocated to the into oe-LGR4, oe-LGR4 + BAI and oe-LGR4 + ERL groups (n = 6) according to the number random table method. The mice in the Vector+ERL and oe-LGR4 + ERL groups were intraperitoneally injected with 10 mg/kg ERL once a day [16], and the mice in the oe-LGR4 + BAI group were intraperitoneally injected with 40 mg/kg BAI once a day [17]. In parallel, the mice in the Vector and oe-LGR4 groups received saline in the same way, all the treatments lasted for 30 days. During the experiment, the tumor volume of the mice was recorded every five days. After completing the final injection, the animals were euthanized by CO2 inhalation, the tumor tissues were removed and weighed immediately. After that, the tumor tissues were immersed in paraformaldehyde, embedded in paraffin, and cut into slices for immunohistochemistry, Terminal-deoxynucleotidyl transferase-mediated nick end labeling, and Western blotting analysis. All assays were performed by laboratory technicians blinded to the groups.
Statistical analysis
All of the experiments were designed to minimize animal suffering and to use the minimum number of animals required to achieve a valid statistical evaluation according to the principles of the 3 R principles (replacement, reduction, and refinement). The study was analyzed with SPSS 20.0, and the data was displayed as mean ± SD. Student’s t-test was used to compare the differences between two groups, and multiple group comparisons were made by one-way analysis of variance and Tukey tests. When the data was not consistent with the normal distribution, the Kruskal-Wallis H test was used. If the variance was not homogeneous, the data were analyzed using Dunnett’s T3 test. p < 0.05 was considered statistically significant.
Results
1LGR4 was highly expressed in LGG and brain glioma, and was related to a poor prognosis
Firstly, the expression of LGR4 in LGG was analyzed by the GEPIA database, and the results revealed that the expression of LGR4 in LGG tissues was higher than that in normal tissues (Fig. 1A). Furthermore, high LGR4 expression in LGG predicted a poor prognosis (Fig. 1B). In addition, HPA demonstrated that LGR4 was highly expressed in the brain tissues of patients with brain glioma (Fig. 1C). Subsequently, in order to further confirm LGR4 expression in brain glioma, qPCR and Western blotting analysis were conducted to measure LGR4 expression in human astrocytes (SVGP12) and brain glioma cells. The results showed that, at both the mRNA and protein levels, LGR4 expression was higher in brain glioma cells than in astrocytes, especially in HS683 and KNS89 cells (Fig. 1D, E). Therefore, HS683 and KNS89 cells were selected for subsequent experiments.

A Expression analysis for LGR4 in brain lower grade glioma tissues (n = 518) and normal tissues (n = 207) using the Gene Expression Profiling Interactive Analysis database. B Survival analysis for LGR4 in brain lower grade glioma patients using the Gene Expression Profiling Interactive Analysis database. The dotted line indicates the 95% confidence interval. C Representative immunohistochemistry staining of LGR4 expression level in brain tissues of a patient with or without brain glioma from the Human Protein Atlas database. The link to immunohistochemistry staining of LGR4 expression in a patient with brain glioma was https://www.proteinatlas.org/ENSG00000205213-LGR4/pathology/glioma#img and the link to immunohistochemistry staining of LGR4 expression in a patient without brain glioma was https://www.proteinatlas.org/ENSG00000205213-LGR4/brain/cerebral+cortex#img. D, E Quantitative PCR (qPCR) and western blotting analysis of LGR4 mRNA and protein expression in human astrocytes (SVGP12) and brain glioma cells (U-251 MG, A172, HS683, KNS89, U-87 MG, U-118 MG). @p < 0.05, @@p < 0.01 vs.SVGP12. Results were presented as mean ± SD. n = 3.
Knockdown of LGR4 suppressed the malignant behavior and EGFR phosphorylation of brain glioma cells
In order to investigate the roles of LGR4 in the malignant behavior of brain glioma cells, three siRNAs targeting human LGR4 were designed to knockdown LGR4 expression in HS683 and KNS89 cells. The knockdown efficiency of LGR4 was verified by qPCR and Western blotting analysis. si-LGR4-3 was selected for subsequent experiments for its higher knockdown efficiency (Fig. 2A, B).
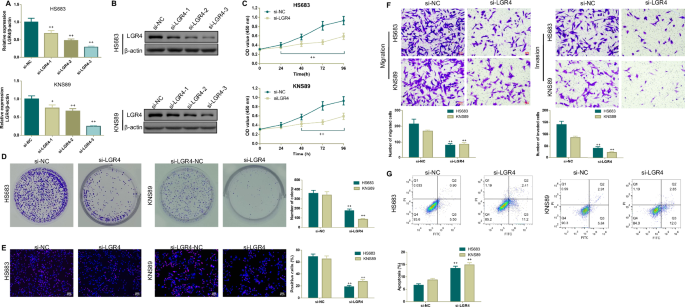
A, B qPCR and Western blotting analysis were used to verify the transfection efficiency of si-LGR4. C–E After transfection with si-LGR4, cell counting kit-8 (CCK-8), colony formation, and 5-ethynyl-20-deoxyuridine staining assays were conducted to assess the cell proliferation ability of brain glioma cells. F, G After transfection with si-LGR4, Transwell, and flow cytometry assays were applied to assess cellular migration, invasion, and apoptosis of brain glioma cells. *p < 0.05, **p < 0.01 vs.si-NC. Results were presented as mean ± SD. n = 3.
Based on results obtained from the GEPIA and HPA databases, we conjectured that LGR4 may facilitate the malignant behavior of brain glioma cells. Hence, a series of assays, including CCK-8, colony formation, EdU, apoptosis as well as Transwell assays, were employed to assess the impact of LGR4 knockdown on brain glioma cells. As expected, LGR4 knockdown significantly inhibited the viability, proliferation, migration, and invasion (Fig. 2C–F), but induced the apoptosis of brain glioma cells (Fig. 2G). Furthermore, Western blotting analysis was conducted to further demonstrate the roles of LGR4 knockdown on brain glioma cellular apoptosis, migration and invasion. As illustrated in Fig. 3, LGR4 knockdown significantly downregulated LGR4, Bcl-2, β-catenin, Vimentin protein expressions, and EGFR phosphorylation, but upregulated Bax, E-cadherin protein expressions and the ratio of Cleaved caspase 3/Caspase-3 in brain glioma cells.

Western blotting analysis of apoptosis-related biomarker (Bax, Bcl-2, Cleaved caspase 3 and Caspase-3), LGR4, epithelial-mesenchymal transition-associated biomarker (β-catenin, E-cadherin, and Vimentin) protein levels as well as EGFR phosphorylation in brain glioma cells transfected with si-NC or si-LGR4. *p < 0.05, **p < 0.01 vs.si-NC. Results were presented as mean ± SD. n = 3.
BAI inhibited cellular malignant behavior, blocked the LGR4-EGFR pathway, and interacted with LGR4 in brain glioma cells
Then, HS683 and KNS89 cells were treated with increasing doses of BAI for 24, 48, and 72 h, after which CCK-8 assays were employed to measure cellular viability. The results revealed that BAI effectively reduced the viability of brain glioma cells in a dose- and time-dependent fashion (Fig. 4A). When the concentration of BAI was above or equal to 20 μM, BAI significantly affected the viability of brain glioma cells, no matter the treatment time was 24 h, 48 h or 72 h. However, after treatment for 48 h, 0–160 μM of BAI did not affect the viability of astrocytes (Fig. 4B). Therefore, the concentrations of 20 μM, 40 μM, 80 μM and the treatment time of 48 h were selected for the following experiments.

A CCK-8 assay of cell viability in brain glioma cells was incubated with different concentrations of BAI for 24, 48, and 72 h. B CCK-8 assay of cell viability in mice’s normal astrocytes incubated with different concentrations of BAI for 48 h. (C–E) Microscopic observation as well as colony formation and 5-ethynyl-20-deoxyuridine staining assays of cell proliferation ability in brain glioma cells treated with BAI for 48 h. F Transwell migration and invasion assays in brain glioma cells cultured with BAI for 48 h. G Flow cytometry analysis of the apoptosis in brain glioma cells treated with BAI for 48 h. ▲p < 0.05, ▲▲p < 0.01 vs.0 μM. Results were presented as mean ± SD. n = 3. Note: BAI, Baicalein.
Additionally, it was observed that relative to the controls, BAI decreased the number, colony-formation ability, proliferation, migration, and invasion, but enhanced the apoptosis of brain glioma cells (Fig. 4C–G). qPCR also found that BAI could block the expressions of LGR4, Wnt/β-catenin pathway-related and stem cell markers-related mRNAs (AXIN2, CD44, SOX2, and OCT4) (Fig. 5A). Furthermore, Western blotting results further suggested that after treating with BAI, the expressions of stem cell markers (SOX2, OCT4, CD133), Bcl-2, Vimentin proteins as well as PI3K, AKT phosphorylation were decreased, but the expressions of Bax, E-cadherin as well as the ratio of Cleaved caspase 3/Caspase-3 in brain glioma cells were increased (Fig. 5B). Moreover, Western blotting analysis found that the expressions of LGR4, CBL (an E3 ubiquitin-protein ligase that drives EGFR proteasomal degradation) and the phosphorylation of EGFR were blocked in BAI treatment groups (Fig. 5C). All the effects were presented in a dose-dependent manner.

A qPCR analysis of LGR4 as well as Wnt/β-catenin pathway-related and stem cell markers-related mRNAs (AXIN2, CD44, SOX2, and OCT4) in brain glioma cells treated with BAI for 48 h. B, C Western blotting analysis of stem cell markers (SOX2, OCT4, CD133), apoptosis-related proteins, EMT-related proteins, PI3K/AKT pathway-related proteins (p-PI3K, PI3K, p-AKT, and AKT) as well as LGR4-EGFR pathway-related proteins (LGR4, CBL, EGFR and p-EGFR) in brain glioma cells treated with BAI for 48 h. D Microscale thermophoresis assay was conducted to demonstrate whether there was a relatively high affinity between BAI and LGR4 in brain glioma cell lysates. E Cellular thermal shift assay was performed at 41 °C, 43 °C, 47 °C, 50 °C, 53 °C, 56 °C to further verify the thermal stability of BAI to LGR4 in brain glioma cell supernatants.▲p < 0.05, ▲▲p < 0.01 vs. control. Results were presented as mean ± SD. n = 3.
Upon binding to different ligands, LGR4 can activate the EGFR, thereby contributing to the development of tumor progression, invasion, and metastasis [6]. Thus, we speculated that BAI may play a role in brain glioma development by regulating LGR4. The MST data demonstrated there was a relatively high affinity between BAI and LGR4 in brain glioma cell lysates, the Kd values between BAI and LGR4 in HS683 cells and KNS89 cells, were about 4.56 M and 4.68 M, respectively (Fig. 5D). Apart from that, the CETSA results showed that the thermal stability of LGR4 in the brain glioma cell supernatants was enhanced with elevated temperatures, indicating there was a direct interaction between BAI and LGR4 (Fig. 5E).
LGR4-induced malignant behavior in brain glioma cells was rescued by BAI and EGFR inhibitor
To explore the potential molecular mechanisms of BAI on brain glioma, cells transfected with oe-LGR4 were treated with 2 μM of EGFR inhibitor (ERL) or 80 μM of BAI. As illustrated in Fig. 6A, brain glioma cells transfected with oe-LGR4 exhibited raised cell viability, however, after treatment with BAI, the viability of brain glioma cells transfected with oe-LGR4 was significantly decreased, which was similar to that of the oe-LGR4 + ERL group. Furthermore, colony-formation analysis, as well as apoptosis detection, were carried out to investigate the mechanisms of BAI on brain glioma. As expected, oe-LGR4-induced proliferation but inhibited apoptosis of brain glioma cells, however, the situations were reversed by BAI, similar to ERL (Fig. 6B, C). Thus, we hypothesized that EGFR may be a key gene for the overexpression of LGR4 caused brain glioma. To test the relationship between LGR4 and EGFR, Western blotting analysis was performed. The results, shown in Fig. 6D, revealed that interference of LGR4 expression could also efficiently interfere with EGFR expression. Subsequently, brain glioma cells transfected with si-LRG4 and oe-LGR4 were treated with 20 μM of MG132 (proteasome inhibitor) for 8 h and 100 μg/mL of CHX (protein synthesis inhibitor) to measure the levels of LGR4 and EGFR. The results found that si-LGR4 accelerated EGFR protein degradation, while oe-LGR4 inhibited EGFR protein degradation (Fig. 6E, F).

A, B CCK-8 and colony-formation assays of cell proliferation ability in brain glioma cells transfected with Vector or oe-LGR4 and treated with or without BAI or erlotinib (EGFR inhibitor). C Flow cytometry assay of apoptosis in brain glioma cells transfected with Vector or oe-LGR4 and treated with or without BAI or erlotinib. D Western blotting analysis of LGR4 and EGFR protein expressions in brain glioma cells transfected with si-NC+Vector, si-LGR4, si-LGR4+Vector, or si-LGR4+oe-LGR4. E Ubiquitination assay was performed in brain glioma cells transfected with si-NC or si-LGR4, to detect the effects of MG132 (proteasome inhibitor) on LGR4 and EGFR expression. F Protein turnover assay was applied in brain glioma cells transfected with Vector or oe-LGR4 to determine whether LGR4 could stabilize EGFR using cycloheximide (protein synthesis inhibitor). +p < 0.05, ++p < 0.01 vs.Vector; *p < 0.05, **p < 0.01 vs.oe–LGR4. Results were presented as mean ± SD. n = 3.
The inhibition of brain glioma cell growth by LGR4 knockdown was reversed by EGFR overexpression and CBL knockdown
To reveal the underlying molecular mechanisms of LGR4 knockdown regulation of cell malignant behavior in brain glioma cells, si-LGR4 and oe-EGFR were co-transfected into HS683 and KNS89 cells. First, LGR4 knockdown resulted in a downregulation of EGFR protein expression, nevertheless, after transfection with oe-EGFR, this downregulation was reversed (Fig. 7A). Subsequently, the impact of oe-EGFR on si-LGR4-induced cell proliferation and hampered cell apoptosis were detected. The colony-formation assay showed that oe-EGFR could rescue the impaired cell proliferation ability induced by LGR4 knockdown (Fig. 7B). The apoptosis detection indicated that LGR4 knockdown accelerated the apoptosis of brain glioma cells, but the effect was abolished by oe-EGFR (Fig. 7C).

A Western blotting analysis of LGR4 and EGFR protein expressions in brain glioma cells transfected with si-NC+Vector, si-LGR4+Vector, si-NC+oe-EGFR or si-LGR4+oe-EGFR. B Clone formation assay of cell proliferation ability in brain glioma cells transfected with si-NC+Vector, si-LGR4+Vector, si-NC+oe-EGFR, or si-LGR4+oe-EGFR. C Flow cytometry assay of apoptosis in brain glioma cells transfected with si-NC+Vector, si-LGR4+Vector, si-NC+oe-EGFR, or si-LGR4+oe-EGFR. #p < 0.05, ##p < 0.01 vs.si-NC+Vector; &p < 0.05, &&p < 0.01 vs.si–LGR4+Vector. Results were presented as mean ± SD. n = 3.
It has been reported that EGFR can be ubiquitinated for degradation by several E3 ubiquitin ligases, including CBL, STUB1, and PARK2 [18]. Accordingly, we further verified the mechanisms of LGR4 knockdown on brain glioma. As displayed in Fig. 8A, si-LGR4 blocked LGR4 protein expression but significantly increased CBL protein expression. In addition, Fig. 8B–D found that LGR4 knockdown effectively decreased EGFR protein expression, inhibited cell proliferation, and facilitated cell apoptosis in HS683 and KNS89 cells. However, these situations were all rescued by si-CBL.
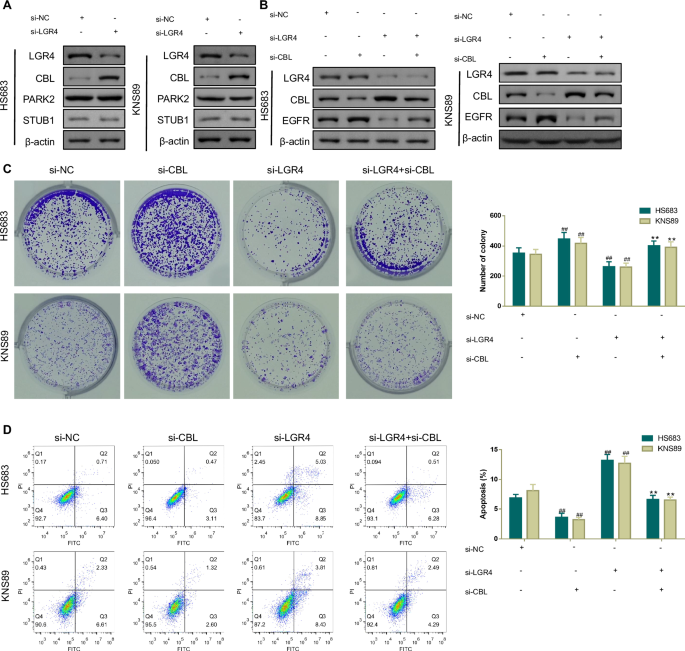
A Western blotting analysis of LGR4 and E3 ubiquitin ligase (CBL, PAPK2, and STUB1) protein expressions in brain glioma cells transfected with si-NC or si-LGR4. B Western blotting analysis was used to measure LGR4, CBL, and EGFR protein expressions in brain glioma cells transfected with si-NC, si-CBL, si-LGR4, or si-LGR4+si-CBL. C, D Clone formation and flow cytometry assays were carried out to examine cell proliferation ability and apoptosis in brain glioma cells transfected with si-NC, si-CBL, si-LGR4, or si-LGR4+si-CBL. #p < 0.05, ##p < 0.01 vs.si-NC;+p < 0.05, ++p < 0.01 vs.si–LGR4. Results were presented as mean ± SD. n = 3.
BAI inhibited LGR4-induced brain glioma development by suppressing EGFR in vivo
To confirm the roles and mechanisms of BAI in brain glioma, HS683 cells were used to generate in vivo xenograft models. Compared to the oe-LGR4 group, the tumor volume of the oe-LGR4 + BAI group was significantly decreased from day 10, and the weight of the tumor was also reduced obviously after the treatment was completed (Fig. 9A). Additionally, compared to the oe-LGR4 group, the expression of Ki67 was decreased while the apoptosis was increased in the tumor tissues of the oe-LGR4 + BAI group (Fig. 9B, C). Interestingly, those trends were also observed in the oe-LGR4 + ERL group. Moreover, oe-LGR4 increased the protein expressions of Bcl-2, LGR4 and EGFR, but decreased the protein expression of Bax, CBL and the ratio of Cleaved caspase 3/Caspase-3 in the tumor tissues of mice, those changes were reversed by treatment with BAI and ERL, with BAI exhibiting a more pronounced effect (Fig. 9D).

A Tumor volume and tumor weight of the mice injected with transfected brain glioma cells. B Immunohistochemical staining assay of Ki67 expression in the tumor tissues of mice injected with transfected brain glioma cells. C Terminal-deoxynucleotidyl transferase-mediated nick end labeling analysis of the apoptosis in the tumor tissues of mice injected with transfected brain glioma cells. D Western blotting analysis of Cleaved caspase 3, Caspase-3, Bax, Bcl-2, LGR4, CBL, as well as EGFR proteins in the tumor tissues of mice injected with transfected brain glioma cells. +p < 0.05, ++p < 0.01 vs.Vector; −p < 0.05, −−p < 0.01 vs.oe–LGR4. Results were presented as mean ± SD. n = 6.
Discussion
Brain glioma is the most lethal brain tumor in adults, with no cure and short median survival (~15 months) [19]. Despite some developments in brain glioma therapies, the prognosis of brain glioma patients remains poor [20]. At present, only a few drugs have been approved by the Food and Drug Administration for treating brain glioma in the clinic. However, due to the high malignancy and extensive invasion of brain glioma cells, these drugs are not generally effective [21]. Thus, further investigation into the mechanisms of brain glioma and the discovery of new therapeutic methods are urgent. In this study, we reported the therapeutic effects and revealed the potential action mechanisms of BAI on brain glioma in vitro and in vivo.
Cancer is characterized by uncontrolled cell proliferation and apoptosis, thus, repressing cell proliferation and inducing cell apoptosis have been regarded as an effective approach to treat the majority of cancers, including brain glioma [22]. Increasing studies have revealed that various plant-derived compounds can be used for treating cancers, due to their function in the regulation of cell growth and death [23]. Flavonoids are widely distributed in plants, and have been proposed as a valuable source of new chemotherapeutic drugs for cancer treatment due to their various cellular mechanisms of action and low adverse effects [24]. For example, luteolin, one of the most common flavonoids, has been demonstrated to influence the immune microenvironment and inhibit tumor growth in brain glioma [25]. In addition, Fisetin, a yellow-coloring flavonoid, has been found to be cytotoxic on glioma cells [26]. Consequently, flavonoids may be a promising compound for the development of new anti-brain glioma drugs. BAI is a kind of flavonoid isolated from the dry roots of S.baicalensis, has been reported to induce autophagy and apoptosis in BC cells by inhibiting the PI3K/AKT pathway in vivo and in vitro [27]. In addition, BAI also has been found to repress the proliferation and block the cell cycle of colorectal cancer cells through decreasing Ezrin and activating P53 pathway-associated proteins [28]. In this study, our data showed that after treatment with BAI, the malignant behavior of brain glioma cells was repressed, indicating that BAI may alleviate brain glioma by inhibiting proliferation and inducing apoptosis of brain glioma cells.
LGR4 is expressed in a wide range of tissues, and the importance of LGR4 in cancer development has been gradually acknowledged by scholars [29]. On the one hand, LGR4 itself is a key gene that controls oncogenesis, metastasis and cancer stem cells in BC, high LGR4 expression implies a poor prognosis in patients with BC [30]. On the other hand, LGR4 promotes cancer occurrence and development by activating multiple pathways, such as EGFR transactivation. For example, LGR4 has been demonstrated to promote the migration and proliferation of keratinocyte cells, and the effect is related to the activation of the EGFR/ERK/STAT3 pathway [31]. Zhang et al. also have provided evidence that by targeting LGR4, miR-137 can inhibit the migration and epithelial-mesenchymal transition of prostate cancer cells via the EGFR/ERK pathway [32]. In agreement with the findings of previous research, the present study revealed that LGR4 was highly expressed in brain glioma patients and cells, patients with higher LGR4 expression had poorer survival outcomes, thus, we speculated that LGR4 repression may serve as an efficacious strategy to improve brain glioma by inactivating EGFR.
In order to verify our hypothesis, RNA interference technology was applied to control LGR4 expression and found that reducing LGR4 expression inhibited cellular malignant behavior and downregulated EGFR phosphorylation in brain glioma cells. This was consistent with published research that EGFR is lowly expressed in the tissues of LGR4 knockout animals [33]. Further investigation revealed that LGR4 overexpression facilitated cell proliferation and blocked apoptosis for brain glioma cells, but the trends were reserved by an EGFR inhibitor. These results provided compelling evidence that EGFR was essential for LGR4 to facilitate the progression of brain glioma. BAI has been reported to have the potential to treat hepatocellular carcinoma or BC by negatively regulating the EGFR/ERK/NF-κβ pathway [11] or the EGFR/ERK/Akt pathway [12]. Consistently, in vitro experiments revealed that after treatment with BAI, the expressions of LGR4 and EGFR were decreased and BAI interacted with LGR4 directly. Those data collectively implied that BAI may inhibit proliferation and induce apoptosis of brain glioma cells by downregulating the LGR4-EGFR pathway. However, the specific mechanisms of LGR4 on EGFR remain unclear.
CBL is a member of the CBL family and is closely associated with tumor occurrence and progression [34]. As a ubiquitin ligase, CBL can directly or indirectly bind to activated EGFR and promote its ubiquitination, thereby regulating the targeted degradation of the receptor in the lysosome [35]. More simply put, EGFR signaling is negatively regulated by CBL ubiquitylation [36]. In triple-negative BC, CBL phosphorylation and inactivation mediated by UBASH3B leads to the upregulation of EGFR, which in turn promotes the proliferation, invasion, and metastasis of triple-negative BC cells [37]. In addition, miR-675 and its precursor H19 enhance the stability and activity of EGFR and c-Met through direct binding of CBL mRNA, thereby promoting the growth and metastasis of BC [38]. In the study, we examined the impact of LGR4 loss on the EGFR-CBL interaction, and found that LGR4 loss elevated CBL expression but decreased EGFR expression. In addition, si-LGR4-mediated repression of cell growth and induction of apoptosis were reversed by CBL knockdown, which indicated that LGR4 loss augmented CBL binding to EGFR, and confirmed the mechanisms of BAI in brain glioma.
However, it should be noted that this study had a limitation. Although CCK-8 assays showed that BAI did not affect the viability of astrocytes at the cellular level, we did not further explore the safety of BAI in vivo. In the future, we will further use animals and clinical trials to focus on the safety of BAI for brain glioma, thereby enhancing the completeness of the study.
In conclusion, our data demonstrated that BAI exerted anti-cancerous functions in brain glioma by inhibiting cell proliferation and inducing apoptosis via downregulation of the LGR4-EGFR pathway. These findings strengthened the experimental results and the clinical application of BAI in brain glioma and suggested that the LGR4-EGFR pathway is a novel therapeutic target in brain glioma treatment.
Responses