Bio-primed machine learning to enhance discovery of relevant biomarkers

Introduction
In precision medicine, identifying reliable biomarkers for gene dependencies—the extent to which a cell relies on a particular gene for survival or proliferation—is paramount for tailoring individualized therapeutic strategies1,2. Gene dependencies are typically measured using functional genomic screens, such as CRISPR-Cas9 or RNA interference, which systematically knock out or suppress genes and assess the resulting impact on cell viability3,4. Increased dependency is quantified as a reduction in cell fitness when a gene is perturbed, often represented by negative dependency scores. These scores reflect the loss of cells harboring the perturbation in the population, indicating that the gene is essential for survival or proliferation. Such measurements provide critical insights into potential vulnerabilities in cancer cells, enabling the prioritization of therapeutic targets.
The advent of high-throughput technologies has ushered in an era of ‘big data’ in bioinformatics, offering unprecedented opportunities to explore the molecular underpinnings of disease at a granular level5. However, this wealth of data also presents significant challenges, particularly due to its high dimensionality and the collinearity among molecular features6. Traditional statistical methods often fall short in effectively analyzing such complex datasets7, necessitating the development of novel computational approaches that can harness the full potential of this information while mitigating inherent limitations8,9.
Among these methods, Least Absolute Shrinkage and Selection Operator (LASSO) regression has emerged as a powerful tool for feature selection and regularization in high-dimensional data analysis10,11. By imposing a penalty on the absolute size of the regression coefficients, LASSO facilitates the identification of a subset of predictive features thereby enhancing model interpretability and reducing the risk of overfitting. However, while LASSO can effectively handle datasets with numerous collinear variables, it does not inherently account for the underlying biological context of the features it selects. This limitation underscores the need for methodological advancements that can integrate domain-specific knowledge into the feature selection process, ensuring that the identified biomarkers are both statistically robust and biologically relevant.
Weighted LASSO extends this framework by incorporating feature-specific penalties, which can improve consistency in variable selection12. Building on this foundation, methodologies such as the weighted graphical Lasso (wgGlasso)13, network-based gene set analysis (Netgsa)14 and augmented high-dimensional graphical Lasso (AhGlasso)15 have incorporated prior biological information, such as protein-protein interaction (PPI) networks, into the feature selection process. These advancements highlight the potential of weighted graphical models to integrate biological networks into statistical analyses effectively, offering significant advantages in scalability and performance. While these methods provide critical insights into network structures, their application is primarily limited to network learning and does not directly address feature selection for predictive modeling. This distinction underscores the need for novel approaches that bridge network-based inference with feature selection frameworks, particularly in high-dimensional data settings.
The Cancer Dependency Map (DepMap) is a comprehensive resource that aims to identify and catalog genetic dependencies and vulnerabilities across a wide range of cancer cell lines. The DepMap web portal’s Predictability tab provides insights into how a given gene dependency or compound sensitivity profile relates to the baseline genomic and molecular (‘omic’) features of cell lines16. This portal offers two distinct omics models: the first ‘core’ model utilizes the most comprehensive and unbiased sets of available omic features, the second ‘related’ model employs a refined set of features associated with genes related to the target gene. Both of these models have drawbacks: the ‘related’ model cannot discover novel biology, and the ‘core’ model may select features that have slightly stronger statistical evidence yet no relation to the gene of interest.
In this manuscript, we introduce a novel machine learning approach that extends the LASSO regression framework to incorporate biological knowledge, such as PPI databases, into the regularization process. While the method is demonstrated here in the context of gene dependency biomarker discovery and PPI networks, its design is inherently generalizable, allowing it to be applied to other domains where integrating structured prior knowledge with high-dimensional data can enhance predictive performance. Potential applications include drug response prediction, functional genomics, and systems biology, among others. By leveraging existing biological information to guide feature selection, our method prioritizes variables that are not only statistically significant but also contextually meaningful, bridging the gap between statistical rigor and domain-specific insight.
By addressing the challenges of high-dimensional and collinear datasets through the integration of biological networks, our method offers a transformative approach for predictive modeling across diverse datasets. It holds promise for advancing personalized medicine and beyond, where understanding the interplay between genetic and molecular factors is critical for developing effective, individualized strategies. This work represents a significant step toward realizing the full potential of ‘big data’ in bioinformatics and translational research.
Results
Method overview
To enhance discovery of relevant biomarkers, we extended the commonly used machine learning approach LASSO to incorporate biological information about the features by applying specialized regularization. In a typical dependency biomarker analysis, the dependent variable is the dependency score of the target gene and the independent variable is a genome-wide molecular profile, such as copy number (CN) variation (Fig. 1A). Sparsity promoting regularization techniques, such as LASSO, are a popular choice for biomarker discovery because these methods aim to identify a small set of highly informative features in high dimensional data such as molecular profiles9. Therefore, we adapted the following two-step procedure to the LASSO regularization.

A Biomarker discovery analysis associates the dependency of the target gene with a genome-wide omic profile. Information from biological networks, such as PPI networks, is integrated into the LASSO regularization, bio-primed model. As a consequence, features that are linked to the target dependency are prioritized during the feature selection resulting in the discovery of relevant biomarkers. B Stepwise parameterization procedure first optimizes (lambda) then second optimizes the Φ parameter. Using the optimized (lambda) and Φ parameters a final LASSO model is fit, and the resulting coefficients can be inspected to prioritize biologically relevant biomarkers.
In the standard LASSO model, the regularization parameter (lambda) is optimized using cross-validation (Fig. 1B). The (lambda) parameter defines the amount of shrinkage each input feature receives. Optimization of this parameter concludes the regularization of the traditional LASSO, and we term the resulting model the baseline LASSO model. Upon optimization of (lambda), we introduce a novel parameter Φ which represents the magnitude of prior evidence linking each feature to the target gene. This evidence may be derived from PPI databases such as STRING DB but is not limited to this data. The Φ parameter is optimized following analogous cross-validation procedure. We term the resulting model using the optimized (lambda) and Φ parameters the bio-primed LASSO model. For selecting informative biomarkers, the feature coefficients of each model were assessed and interpreted.
Predict MYC dependency using RNA expression biomarkers
We first applied our method to the Chronos dependency data set derived from genome-wide CRISPR knockout experiments for 17,386 genes across 1,048 cancer cell lines17. We set out to find RNA expression biomarkers to predict the dependency of oncogene c-Myc (MYC). RNA expression data was filtered to 12,182 genes expressed across all cell lines and subsequently z-score normalized. This set of genes was used as input features to discover relevant biomarkers to predict MYC dependency.
Using 10-fold cross validation, a value of 0.65 was inferred for the Φ parameter (Supplementary Fig. 1A). A total of 188 features were assigned non-zero coefficients in the bio-primed model and deemed as relevant biomarkers (Fig. 2A). The largest coefficient, which represents the most informative feature, was assigned to RNA expression of the MYC gene itself. Both the baseline and bio-primed models identified MYC RNA expression as the major predictor, consistent with the paradigm of oncogene addiction18. Additionally, significant correlation was observed between the coefficients derived from the two models for the remaining predictors (Fig. 2B). We next calculated the correlation between each input feature and the target dependency. Overlaying this information on top of the coefficients derived from the two models revealed that predictors with positive and negative LASSO coefficients also showed positive or negative correlation, respectively (Fig. 2C). As expected for an oncogene, MYC RNA expression levels were negatively correlated with MYC dependency. Cell lines with elevated RNA expression of MYC were more dependent on MYC (Fig. 2D).
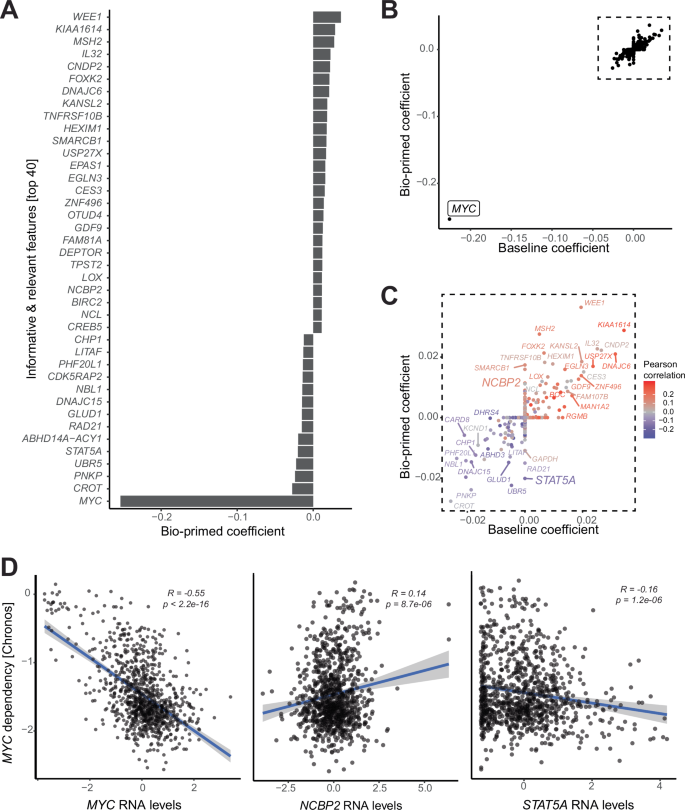
A Barplot shows the bio-primed model’s coefficients for all non-zero RNA biomarkers. B Scatter plot shows the baseline (x-axis) and bio-primed (y-axis) models’ coefficients. C Zoomed in view of the scatter plot, excluding MYC, displaying the baseline (x-axis) and bio-primed (y-axis) models’ coefficients colored by Pearson correlation coefficient. D Scatter plots with associated Pearson correlation coefficients and p-values show RNA expression (x-axis) and MYC dependency (y-axis) for MYC, NCBP2, and STAT5A.
Of note, a fraction of RNA biomarkers received non-zero coefficients exclusively in the bio-primed and not the baseline model. Gene set enrichment analysis revealed a strong enrichment of pathways related to regulation of transcription and apoptosis for biomarkers exclusively identified in the bio-primed model (Supplementary Fig. 1B). On the other hand, gene set enrichment analysis of biomarkers with non-zero coefficients exclusively in the baseline model showed weaker enrichment signal. These results suggest that the feature prioritization scheme employed by the bio-primed model helps to identify coherent biological processes which influence dependency prediction.
For example, STAT5A and NCBP2 received non-zero coefficients exclusively in the bio-primed model (Fig. 2C). STAT5A, a member of the Signal Transducer and Activator of Transcription (STAT) family, has previously been identified as a potent inducer of MYC19,20,21. As an inducer of MYC, the oncogene addiction model suggests that elevated STAT5 should be a biomarker in MYC-driven cancers. Correspondingly, we observed increased MYC dependency in cell lines with high expression of STAT5 RNA (Fig. 2D).
NCBP2 (also known as Nuclear Cap-Binding Protein Subunit 2) is a component of the cap binding complex and is required for the recruitment of splicing machinery to nascent mRNA22,23. We, and others, have previously shown that MYC driven cancers are vulnerable to perturbation of the spliceosome24,25. We observed that cell lines with low levels of NCBP2 RNA were more dependent on MYC (Fig. 2D). The observed correlation between the RNA levels of STAT5A and NCBP2 with MYC dependency implies these genes as relevant biomarkers of MYC dependency.
To extensively benchmark our method we performed the following analyses. To assess repeatability, we performed a second independent run using the same input features and MYC dependency as the outcome variable. The bio-primed model’s coefficients derived from these two independent runs showed strong correlation, demonstrating high reproducibility across runs (Supplementary Fig. 1C).
Since MYC RNA expression emerged as the dominant predictor of MYC dependency, we sought to test how our model would perform in its absence. The analysis was repeated after removing MYC RNA from the feature space. The bio-primed coefficients for all remaining genes showed significant correlation between the original model and the one without MYC RNA, highlighting the model’s robustness (Supplementary Fig. 1D).
To further evaluate the robustness of our method to noise in the biological network annotations, we manually set the evidence score for MYC to 0, the minimum possible value. This ensured that the model was not biased toward favoring MYC RNA expression as a biomarker. Nevertheless, the model assigned a large coefficient to MYC RNA expression, demonstrating its capacity to identify novel associations even in the absence of prior supporting data and its resilience to incomplete network annotations (Supplementary Fig. 1E).
To assess the generalizability of our method and provide a use case of application to different network annotations, we downloaded the STRING subnetwork restricted to experimentally validated physical interactions. The bio-primed coefficients derived from models using the full STRING network and the physical interaction subnetwork were strongly correlated (Supplementary Fig. 1F). Of note, biomarkers STAT5A and NCBP2 remained predictive in this model. Additionally, gene set enrichment analysis of the bio-primed coefficients from the physical interaction subnetwork showed high concordance with results obtained using the full network (Supplementary Fig. 1B).
Finally, we evaluated runtime performance by repeating the MYC dependency prediction analysis while down-sampling the number of cell lines for each run (Supplementary Fig. 1G). For this dataset, consisting of 12,182 input features and 1048 cell lines, the runtime increased approximately linearly, ranging from 50 s for 50% of the cell lines to just over 120 s for the full set of cell lines.
In summary, our benchmarking results demonstrate that our proposed method is fast, repeatable, robust to noise in annotations, and easily adaptable to different network annotations.
Predict EGFR dependency using copy number biomarkers
We next applied our method to the Demeter2 (D2) dependency data set. This gene dependency data was derived from genome-wide short hairpin RNA screen experiments for 17,309 genes across 707 cancer cell lines26. As a second use case, we set out to discover CN biomarkers predicting EGFR dependency as measured using the D2 score. Linkage disequilibrium (LD) in CN profiles makes it particularly difficult to extract relevant biomarkers since many genes will carry comparable statistical evidence of association.
We first calculated the correlation coefficient between EGFR dependency and the CN estimate of each gene. Visualization of this genome-wide correlation profile revealed a strong negative correlation between EGFR CN and EGFR dependency (Fig. 3A). As expected from an oncogene, cell lines with amplification of EGFR CN showed increased dependence on EGFR (Supplementary Fig. 2).
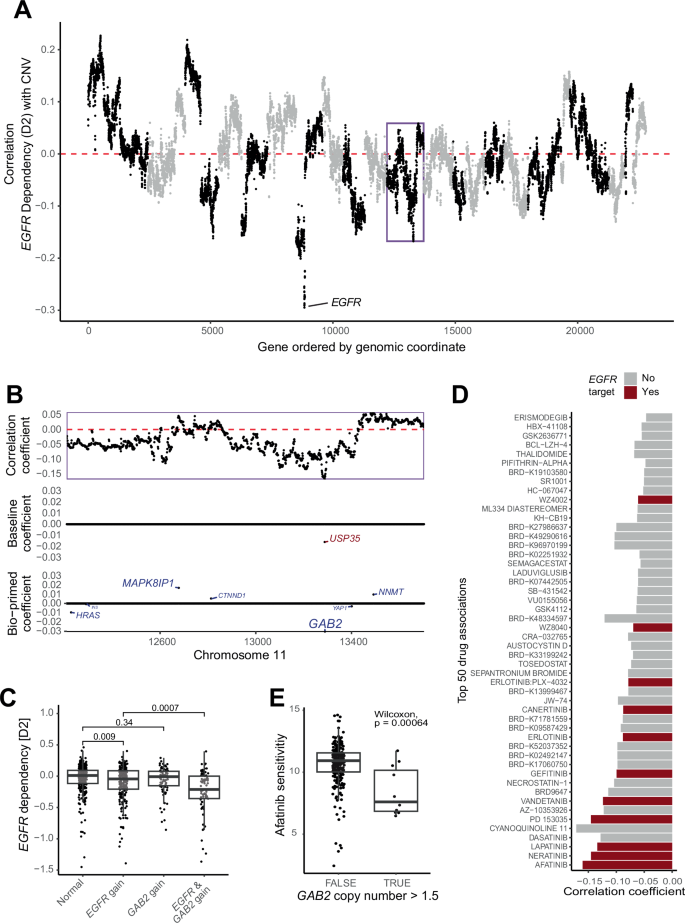
A Scatter plot shows the correlation coefficient between gene-level CN variation and EGFR dependency (y-axis) across genes sorted by genomic location (x-axis). Points are colored to distinguish adjacent chromosomes. B Scatter plot shows correlation (top), baseline (middle) and bio-primed (bottom) models’ coefficients restricted to chromosome 11. GAB2 is assigned non-zero coefficient in the bio-primed but not in the baseline model. C Boxplots show EGFR dependency (y-axis) across cell lines stratified by combinations of CN gains of EGFR and GAB2. D Barplot shows correlation coefficient between drug sensitivity and GAB2 CN variation (x-axis) for the top 50 negative associations (y-axis). Colors indicate if the drug targets EGFR. E Boxplots shows Afatinib sensitivity (y-axis) across GAB2 amplification status (x-axis) restricted to cell lines with CN neutral EGFR.
Interestingly, we observed a second peak with moderate negative correlation on chromosome 11 (highlighted in a purple box). Focusing on this locus revealed many genes with strong negative correlation between CN and EGFR dependency (Fig. 3B). The strong LD structure makes it difficult to select a specific biomarker from this region based on correlation coefficients alone. The baseline model assigned a single non-zero coefficient to the USP35 gene in this region. To the best of our knowledge, there exists no reported connection between USP35 and EGFR. STRING also did not assign an association score for these two genes. We believe that the reason the baseline model picked the USP35 gene is due to a spurious association with the underlying driver gene. The bio-primed model, on the other hand, identified GAB2 CN as the most informative biomarker in this region based on the magnitude of the LASSO coefficient (Fig. 3B). GAB2 (GRB2-associated binding protein 2) is an adaptor protein that plays a critical role in transmitting signals from receptor tyrosine kinases, such as EGFR, to downstream pathways involved in cell proliferation, survival, and migration27. Amplification of GAB2 can lead to increased activation of the PI3K/AKT and MAPK pathways, both of which are downstream effectors of EGFR signaling (Gu et al. 1998), supporting the idea that GAB2 amplification may potentiate oncogenic processes driven by EGFR and increase the dependency of cancer cells on EGFR activity. Indeed, stratifying the cell lines by EGFR and GAB2 CN gain revealed that simultaneous gain of EGFR and GAB2 CN significantly increased dependency on EGFR, linking the GAB2 CN to EGFR dependency (Fig. 3C).
These data suggest that patients with GAB2 amplification may be more sensitive to drugs targeting EGFR. To explore this hypothesis, we analyzed existing drug sensitivity data provided by the DepMap resource. We correlated drug sensitivity profiles for 545 drugs from the Cancer Target Discovery and Development Network with GAB2 CN profiles. Several of the most strongly associated drug sensitivities were indeed EGFR inhibitors (Fig. 3D). For example, cell lines with GAB2 amplification but CN neutral EGFR showed increased sensitivity to EGFR inhibitor Afatinib (Fig. 3E).
Biologically informed biomarkers show stronger co-dependency
To systematically evaluate our method, we used the D2 dependency data. We first identified a total of 453 selectively dependent genes, meaning they show strong dependency in only a subset of cell lines (see Methods section). Given their selective dependency profile these genes represent promising cancer drug targets. We hypothesized that the selective dependency profile may be driven by CN aberrations of the gene itself or biologically relevant genes. Therefore, each of these gene dependencies was subjected to CN biomarker analysis using the baseline and bio-primed model approaches, with the goal of identifying the underlying genomic aberrations driving the dependencies. Out of 453 target genes, 432 identified at least one predictive CN biomarker in either approach (Supplementary Table 1).
Next, we set out to compare the biomarkers derived from the baseline and bio-primed models. For each gene and to ensure discriminative power, two sets of mutually exclusive biomarkers were defined: 1) The top 20 biomarkers with a positive coefficient derived from the bio-primed model and not identified using the baseline model. 2) The top 20 biomarkers with a positive coefficient derived from the baseline model and not identified using the bio-primed model. For each of these gene sets, we calculated the co-dependency between each target and the corresponding biomarkers using Pearson correlation.
For example, UTP4, a key component of the processome, a large ribonucleoprotein complex involved in the early steps of ribosome biogenesis28, showed multiple peaks of correlations between CN and dependency (Fig. 4A). The bio-primed model identified UTP4 in the peak with the strongest genome-wide association on chromosome 16. This result was consistent with the so-called CYCLOPS model, which posits that partial loss of CN yields cancer-specific liabilities29. The baseline approach failed to identify UTP4 and instead selected unrelated biomarkers near the UTP4 locus. To the best of our knowledge, none of these markers have previously been linked to UTP4 biology.
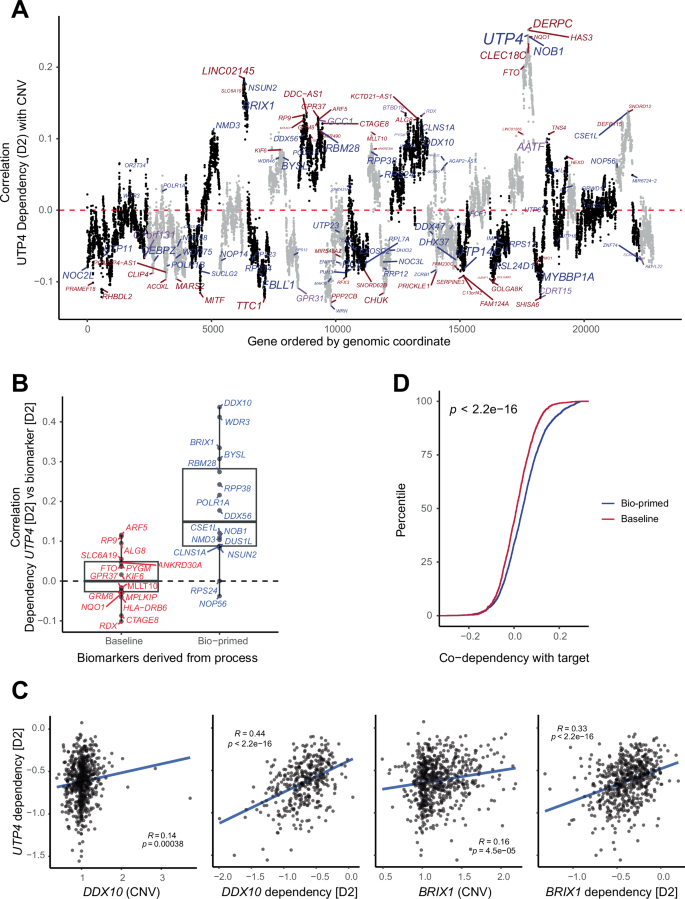
A Scatter plot shows the correlation coefficient between gene-level CN variation and UTP4 dependency (y-axis) across genes sorted by genomic location (x-axis). CN biomarkers identified by the baseline and bio-primed models are colored in blue and red, respectively. The size of the gene symbol is proportional to the absolute coefficient derived from either model. Points are colored by chromosomes. Genes identified by baseline, bio-primed, and both are colored in red, blue, and purple respectively. B Boxplot shows UTP4 co-dependency, Pearson correlation, (y-axis) for top mutually exclusive biomarkers derived from the bio-primed (red) and baseline (blue) models (x-axis). Biomarkers derived from the bio-primed model show significantly greater co-dependency. C Scatter plots with associated Pearson correlation coefficients and p-values show the association between UTP4 dependency (y-axis) and CN variation as well as co-dependency (x-axis) for DDX10 and BRIX1. Pearson correlation coefficient and p-value for each trendline in blue. D Empirical cumulative density plot shows increased co-dependency between target gene and biomarkers derived from the bio-primed (blue) compared to the baseline (red) models.
To assess co-dependency, we next calculated the correlation between UTP4 dependency and dependency of CN biomarkers with a positive coefficient derived from the baseline or bio-primed models. Biomarkers from the bio-primed approach showed significantly greater co-dependency compared to biomarkers derived from the baseline approach (Wilcoxon test, p < 0.01, Fig. 4B). None of the baseline biomarkers showed significant co-dependency with UTP4. The bio-primed model identified DDX10 and BRIX1 as relevant CN biomarkers within genome-wide correlation peaks. These two biomarkers were exclusively identified using the bio-primed approach and showed significant correlation between UTP4 dependency and CN as well as co-dependency with UTP4 (Fig. 4C). Of note, DDX10 is a DEAD-box RNA helicase that also plays a role in ribosome biogenesis by participating in the processing of pre-rRNA30 and BRIX1 is also known to be involved in ribosome biogenesis31, demonstrating that the bio-primed model selected biomarkers that are directly relevant to the biological function of the target dependency.
We generalized this approach across the remaining 431 genes. This comprehensive analysis demonstrated that biomarkers derived from the bio-primed model showed significantly stronger co-dependency with the target compared to biomarkers derived from the baseline model (Fig. 4D). This observation remained consistent across a larger range of top k values (Supplementary Fig. 3). Thus, the biomarkers identified by the bio-primed approach are more relevant to the target biology compared to the baseline approach. A full list of results may be found in Supplementary Table 1.
Discussion
The primary aim of this study was to develop and validate a novel machine learning approach that integrates biological knowledge into the LASSO regression framework, enhancing the identification of biomarkers for gene dependencies in high-dimensional molecular data. By incorporating PPI data into the regularization process, our bio-primed LASSO model addresses the limitations of traditional statistical methods, which often struggle with the high dimensionality and collinearity inherent in ‘omics’ datasets. Through this biologically informed approach, we sought to prioritize features that are not only statistically significant but also biologically relevant, ultimately facilitating the discovery of novel therapeutic targets and advancing the field of precision medicine.
One key limitation of traditional LASSO is its susceptibility to performance degradation when predictor variables are highly correlated, as is common in biological data. This limitation motivated our development of the bio-primed LASSO, which incorporates external biological knowledge to guide feature selection. By leveraging PPI data, the bio-primed LASSO prioritizes the selection of biologically relevant features from among correlated predictors, addressing the inherent challenges of collinearity while maintaining the sparsity and interpretability of the model. Future work could extend the bio-priming concept to other machine learning frameworks, such as elastic net or tree-based models, to explore its applicability in handling collinearity across a broader range of problems.
In our analysis aimed at predicting MYC dependency, RNA levels of STAT5A and NCBP2 emerged as significant predictors. Both STAT5A and NCBP2 had previously been linked to MYC biology and our bio-primed model identified these two genes as relevant biomarkers of MYC dependency while the baseline model failed to do so.
In our second analysis, we found that CN gains of GAB2 significantly enhance EGFR dependency, suggesting a potential synergistic relationship between GAB2 amplification and EGFR signaling in cancer. Of note, we checked the “Predictability” tab on the DepMap website for EGFR dependency. GAB2 CN or any other GAB2 molecular profile was not included in the top predictive features, indicating that our approach discovered a biomarker that was missed by other approaches. Our findings underscore the importance of GAB2 as a modulator of EGFR dependency. Importantly, we observed increased sensitivity to EGFR inhibitors in cell lines with GAB2 amplification even in an EGFR neutral background, suggesting that patients with GAB2 amplification may benefit from EGFR inhibitors.
Our comprehensive analysis demonstrated that the bio-primed model selected biomarkers that are directly relevant to the biological function of the target dependency. Importantly, the comparison was designed to minimize reliance on prior literature, instead leveraging a systematic, data-driven approach to assess the relevance of identified biomarkers. We exemplified this by studying CN biomarkers for UTP4. Biologically relevant genes not only represent robust biomarkers but could also be leveraged to find synthetic lethal interactions32. Synthetic lethality refers to a situation where the simultaneous occurrence of aberrations in two or more genes leads to cell death, whereas an aberration in just one of these genes does not affect cell viability. This concept is particularly important in cancer research, as it offers a strategy to selectively kill cancer cells by targeting a gene that is synthetically lethal with a genomic aberration specific to the cancer. In our study, the biologically relevant genes identified by our bio-primed LASSO model could serve as candidates for synthetic lethal partners, opening avenues for novel cancer treatments.
One limitation of our method is its reliance on pre-existing biological databases, such as the STRING PPI network, for bio-primed regularization. While the incorporation of biological knowledge is a strength, it is dependent on the completeness and accuracy of these external data sources. Any gaps, biases, or errors in these databases may influence feature selection. Further, our method focuses on interaction partners, which might limit the discovery of novel dependencies that arise from more complex, multi-layered biological pathways not captured by current interaction databases. Moreover, the use of STRING confidence scores may oversimplify complex biological relationships, potentially missing subtle yet important interactions.
Another important aspect to consider is the computational efficiency and tuning parameter optimization of our implementation. The native glmnet package uses C++ for the highly efficient optimization of the (lambda) parameter. In contrast, our R-based implementation optimizes the Φ parameter directly in R, which may impact scalability and execution speed for very large datasets. While our current approach fixes one parameter and optimizes the other sequentially, we acknowledge the potential benefits of jointly optimizing both parameters for more robust model selection. Future work could explore integrating joint optimization methods into this framework, ideally in a more efficient language, to enhance scalability and accommodate larger, more complex datasets.
Our proposed method represents a generalizable approach that can be applied to various settings beyond the specific examples demonstrated in this study. While we have highlighted the use of two PPI networks to inform the regularization process, the framework is flexible and can incorporate different types of biological associations depending on the context and available data. For instance, regulatory networks, gene co-expression networks, or epigenetic modification maps could be integrated to guide feature selection in a manner that reflects the underlying biological processes relevant to the research question. This adaptability allows our method to be tailored to diverse applications, whether it be identifying biomarkers for drug sensitivity, predicting gene dependencies, or understanding complex disease mechanisms. By leveraging relevant biological knowledge, our approach enhances the interpretability and relevance of the selected features, thereby improving the robustness and applicability of the findings in various domains of biomedical research.
Methods
LASSO implementation
In cases of high-dimensional data, where the observational counts are greatly outnumbered by the number of predictors, traditional regression techniques often produce poor predictive results due to overfitting, collinearity, and sparsity6. The LASSO framework is a regularization technique which employs a penalization process to remove uninformative parameters by shrinking their coefficients towards zero33. The baseline LASSO model has its hyperparameter lambda ((lambda)) optimized, using ten-fold cross-validation. For the analyses described in this paper, we fixed alpha, the ridge penalty parameter, equal to zero. Methods described for baseline and bio-primed LASSO processes were developed and implemented in R34 with the aid of the glmnet35 package.
Bio-primed regularization
Expanding upon previous work13,36, we extend the baseline LASSO model by incorporating prior knowledge into the feature selection procedure. The process is tailored to refine for biologically relevant, not just statistically associated, features. Towards this end, we define a feature-specific regularization factor (µ) that represents the importance of the feature to the outcome variable. Features with strong prior evidence will have a µ value close to 1, while those with no evidence will have a µ value of zero. Features with small values for µ will incur a greater penalty to their coefficients. For the analysis presented here, µ values are derived from the PPI score provided by the STRING database.
We also introduce a second tuning parameter called phi (Φ) which accounts for the overall importance of the prior knowledge. The regularization penalty for the jth feature is:
Therefore, the overall bio-primed lasso penalty is defined as:
For the analyses presented here, ({mu }_{j}) values are defined by the jth PPI score provided by the STRING database. STRING scores are scaled as a proportion of the maximum score:
Following the standard (lambda) optimization procedure, root mean square error (RMSE) was calculated using a ten-fold cross-validation to derive the optimal Φ. The optimal Φ is identified by the inflection point of the Φ versus RMSE function. The final bio-primed model is fitted using the inferred hyperparameters (lambda) and Φ.
Protein-protein interaction annotations
PPI network data was downloaded from the STRING database37 website (www.string-db.org) in February 2024. The data for the Homo Sapiens organism were incorporated into the LASSO regularization process. STRING collects and scores evidence for interactions from multiple sources: (i) automated text mining of scientific literature, (ii) databases of interaction experiments and annotated complexes or pathways, (iii) computational interaction predictions from co-expression and conserved genomic context and (iv) systematic transfers of interaction evidence across organisms. For the full network (9606.protein.links.v12.0.txt), all interaction evidence contributing to the network is integrated into a final ‘combined score’, which provides an estimate of STRING’s confidence on whether a proposed association is biologically meaningful. The physical interaction subnetwork (9606.protein.physical.links.v12.0.txt) specifically focuses on direct physical interactions, where proteins are known or predicted to bind each other. The corresponding scores were scaled between 0 and 1 and integrated into the bio-priming process. Protein identifiers were mapped to human gene symbols using the biomaRt R package38.
Dependency data
Chronos17 and Demeter239(D2) dependency data as well as molecular data including copy number (CN) variation and RNA expression profiles were downloaded from the DepMap portal (www.depmap.org) in July 2022 (version 22Q2). Drug sensitivity data from the The Cancer Target Discovery and Development (CTD²) Network was downloaded from the DepMap portal in July 2024 (version 24Q2). Genomic information including chromosome name and location were derived using the biomaRt R package38.
Gene set enrichment analysis
Gene set enrichment analysis was performed using the enrichR R package40. The analysis was restricted to the “GO_Biological_Process_2023” annotation. In total six analyses were run using genes with zero baseline coefficient and 1) positive and 2) negative bio-prime coefficient in the original model, genes with zero bio-prime coefficient and 3) positive and 4) negative baseline coefficient in the original model and genes with zero baseline coefficient and 5) positive and 6) negative coefficient in the model restricted to the physical subnetwork.
Definition of selective gene dependencies
Target genes for the comprehensive CN biomarker analysis were defined using the following criteria: 1) D2 dependency values for a given target gene had less than 10% of missing values, 2) D2 dependency values were lower than −0.5 in at least 5% of cells and 3) absolute skewness value was greater than 0.5. These selection criteria resulted in 453 target dependencies. Co-dependency was statistically evaluated by calculating the Pearson correlation between two dependency scores.
Responses