Bioengineered articular cartilage biomimetic organ-on-a-chip using microfluidics
Introduction
Cartilage tissue engineering using microfluidics recapitulates the complex, spatially organized structure and biochemical cues of the native cartilage microenvironment. This includes the ability to control the composition and organization of the extracellular matrix (ECM), with the distribution of cells, growth factors, and ECM components across the gradient zones of the articular cartilage1. Microfluidic systems allow for the continuous perfusion of culture media, enabling better transport of oxygen, nutrients, and waste products compared to three-dimensional (3D) cultures. This dynamic flow helps to overcome the limitations of diffusion-limited nutrient transport in traditional 3D tissue engineering approaches. Microfluidic platforms can be designed to apply controlled mechanical stimuli such as fluid shear stress and cyclic compression to cartilage constructs. This mimics the native mechanical environment of articular cartilage and can enhance the maturation and functional properties of the engineered tissue. The dynamic culture conditions and biomimetic microenvironment provided by microfluidic systems have shown to enhance chondrogenic differentiation of cells and the deposition of cartilage-specific ECM2. This can lead to engineered cartilage constructs with improved biochemical and biomechanical properties compared to those of 3D cultures3. Microfluidic organ-on-a-chip (OOAC) systems can serve as valuable in vitro models for studying cartilage physiology and pathology, potentially reducing the need for animal studies. Microfluidic technologies enable the miniaturization and parallelization of cartilage tissue engineering experiments, facilitating high-throughput screening of biomaterial formulations, cell sources, and culture conditions4.
The choice of microfluidic system depends on the specific requirements of tissue engineering applications such as the need for perfusion, gradient generation, co-culture, and high-throughput capabilities5. Perfusion-based systems are the most widely adopted systems for cartilage tissue engineering applications because of their ability to closely mimic the native cartilage microenvironment and provide the necessary cues for chondrogenesis and cartilage maturation6. In perfusion-based microfluidic systems for cartilage tissue engineering, the types of perfusion pumps utilized include syringe, peristaltic, and pneumatic pumps. The choice of perfusion pump for microfluidic cartilage tissue engineering depends on factors such as the desired flow rate, need for dynamic mechanical simulation, overall system complexity, and ease of integration with the microfluidic device. Pressure-controlled pumps, considered a specific type of pneumatic pump, use compressed air or gas to drive the flow of culture media. Media flow is regulated through microfluidic channels by controlling the applied pressure rather than the volumetric flow rate. The pressure-based controller allows the application of dynamic mechanical stimuli, such as compression and shear stress, to the developing cartilage construct within the microfluidic device. Pressure control can provide a more precise and structurally relevant mechanical simulation than flow rate-controlled pumps, as the cells and tissues experience the desired pressure profile7.
To address the challenge of developing biomimetic articular cartilage in OOAC systems due to its dense ECM and limited chondrocyte proliferation. Our published work proposed novel bioink from decellularized ECM, as a protein-rich niche to support native and mesenchymal stem cells (MSCs)-derived chondrocytes in two-dimensional (2D) and three-dimensional (3D) tissue constructs. Decellularised ECM (dECM) derived from cartilage tissue contains native cartilage-specific proteins, glycosaminoglycans (GAGs), and growth factors that can support the maintenance of the chondrocyte phenotype and enhance the deposition of cartilage-like ECM. It can also enhance the cell-matrix interactions, providing cell-binding motifs crucial for chondrogenesis and cartilage tissue formation8. The rationale behind using sodium alginate and chitosan as a composite biopolymer was to create a hydrogel with improved mechanical compression property and the ability to support chondrocyte adhesion and proliferation compared to single biopolymer9.
The current study is aimed to create a biomimicking native cartilage using decellularized ECM as bioink to support chondrogenesis, with biopolymer composite hydrogels offering mechanical and load-bearing properties. The integration of OOAC microfluidic technology with a pressure controller system and the use of composite hydrogels with dECM bioink additives offers a promising novel approach to overcome the limitations of traditional cartilage tissue engineering methods, enabling the development of more biomimetic, functional, and clinically relevant engineered cartilage constructs.
Results
Composite hydrogel formulations optimisation
The compression testing provided insights into optimising the composite hydrogel formulations. Increasing the sodium alginate (1% to 2%) and glutaraldehyde cross linker (0.5% to 1%) concentration led to higher compressive strength among the formulated sodium alginate/chitosan ratios. The 2% sodium alginate and 2% chitosan in 2:1 and 2:3 ratio with 1% glutaraldehyde displayed maximum force of 25.5 N and 26.6 N respectively, withstanding higher stresses before failure compared to other formulations. The composite hydrogel with maximum force of 26.6 N displayed young’s modulus (E) of 0.18 MPa (Fig. 1A), that was optimised for characterisation with compression stress of 0.1 MPa. The compression modulus was found to be within the wide reference range (E = 0.08–2.5 MPa) of the superficial and middle zones of native articular cartilage (Supplementary Table 1). The tensile strength upon maximum force (MPa) resulted in an equilibrium shear stress of 0.40 ± 0.105 (mean ± standard deviation), found to be within the wide reference range of 0.3–25 MPa (Fig. 1B).
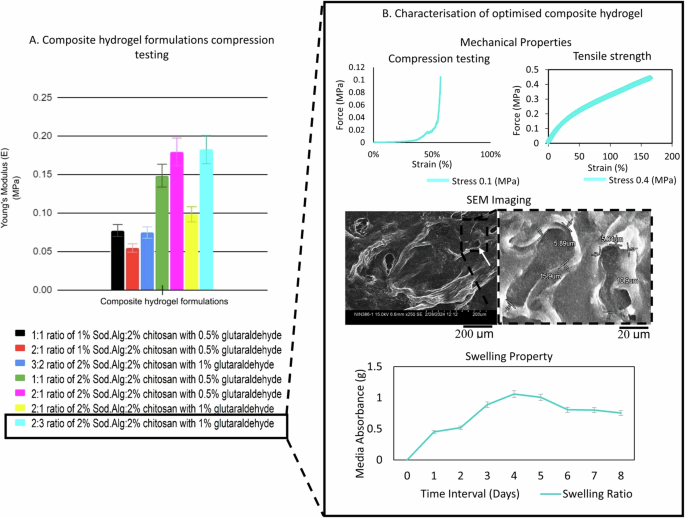
A The composite hydrogel formulations with varying ratios and concentrations of sodium alginate (Sod.Alg), chitosan, and glutaraldehyde showed compressive Young’s modulus (MPa). Standard deviations from mean were calculated using unpaired two-tailed Student’s t-test method for comparison and optimisation. B Top left: The 2:3 ratio optimised hydrogel with maximum Young’s modulus (MPa), was characterised for compression testing displaying force (MPa)-strain (%) curve. Top right: Tensile strength with force (MPa)- plotted against strain (%). Middle: SEM imaging showing the void micropore structures at scale 200 μm (left) with dimensions (length x width) at scale 20 μm (right). Bottom: Swelling property characterized for media perfusion through the microfluidic device using media absorbance ratio for over 8 days. Hydrogel codes: (black) 1:1, 1% Sod.Alg:chitosan, 0.5% glutaraldehyde; (green) 1:1, 2% Sod.Alg:chitosan, 0.5% glutaraldehyde; (red) 2:1, 1% Sod.Alg:chitosan, 0.5% glutaraldehyde; (magenta) 2:1, 2% Sod.Alg:chitosan, 0.5% glutaraldehyde; (yellow) 2:1, 2% Sod.Alg:chitosan, 1% glutaraldehyde; (cyan) 2:3, 2% Sod.Alg:chitosan, 1% glutaraldehyde; (blue) 3:2, 2% Sod.Alg:chitosan, 1% glutaraldehyde. [SEM:Scanning electron microscopy].
Optimised composite hydrogel characterisation
The scanning electron microscopy (SEM) imaging measured the length and width of the micropores as 13.4 ± 2.5 μm and 5.46 ± 0.42 μm (mean ± standard deviation) respectively. The average native chondrocyte diameter measures from 10–30 μm. The ultrastructure of the optimised composite hydrogel revealed void micropores formed from freeze-drying and cross-linking with increased glutaraldehyde concentration (1%). These micropores formed are desirable to facilitate cellular attachment, aggregation, and proliferation of chondrocytes and MSCs-induced chondrocytes.
The swelling ratio of the optimised composite hydrogel showed a gradual increase in the media absorbance up to day 3, with a percentage increase from 45% to 88%. Thereafter, the maximum media absorption and swelling ratio increases to 100.8% by day 4. The media absorption and composite hydrogel swelling ratio began to decline from day 5 onward. The swelling ratio plateaued (saturation phase) on day 6. On day 7, no further absorbance was observed, and the swelling ratio decreased to 42%. Thus, the swelling ratio provides insight for layering of the optimised composite hydrogel in the microfluidic channels with maximum swelling allowed during perfusion, followed by shrinkage, retaining sufficient head space in the channel for laminar flow of media (Fig. 1B). Thus, the optimised and characterised composite hydrogel was micro-scaled in a microfluidic device for the development of OOAC articular cartilage tissue.
Microfluidic system
The microfluidic device assembly enabled the development of composite hydrogel-based tissue constructs with upper and lower channels supporting independent yet simultaneous media perfusion at differential pressures. The upper and lower channels represented superficial and middle zones for structurally mimicking the native articular cartilage. The flat morphology in the upper channel mimics the superficial zone in response to bear the external high shear pressure. The oval-shaped morphology mimics the middle zone in response to the shear force from the lower channel (Fig. 2).
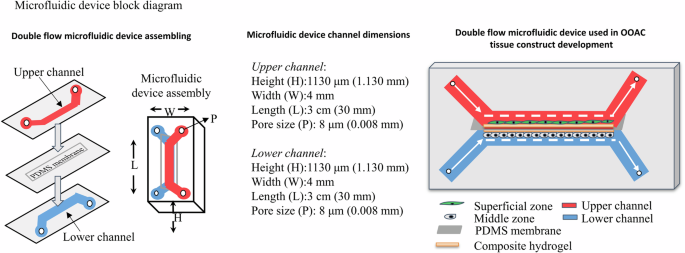
The microfluidic device assembly illustrates an upper and a lower channel separated by a PDMS membrane. The dimensions of the microfluidic device channels are: height (H) 1130 μm, width (W) 4 mm, length (L) 3 cm, and inlet/outlet pore size (P) 8 μm. The 3D schematic of the device shows different components representing the upper channel (red), lower channel (blue), superficial zone (green), middle zone (grey), PDMS membrane (light grey), and composite hydrogel (brown).
The dynamic perfusion flow through the channels was controlled using two-way switches 1 and 2, alternatively switching ON with a hold time of 60 s. Priming the microfluidic system with media before seeding cells ensured that the system was free from air bubbles and media leakage (Fig. 3). Dynamic continuous perfusion was precisely controlled and automated using OxyGen software (Supplementary Fig. 1). The microfluidic setup and process flow are included for reference (Supplementary Movie).
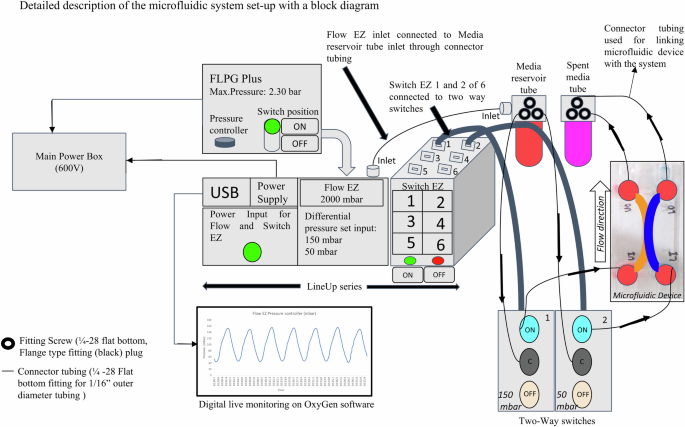
Schematic of the experimental setup showing the main power box, pressure source (FLPG Plus), LineUp series (consisting of power supply, Flow EZ and Switch EZ components), and digital live monitoring (controlled by OxyGen software). The culture media and cells are perfused through the inlets and spent media is collected from the outlets of the upper and lower channels.
In vivo characterisation of OOAC articular tissue constructs
Phase-contrast microscopy, proliferation assay and SEM
The tissue constructs showed an interconnecting network of cellular growth extending from the centre towards the periphery of the channel. The intersection point of the upper and lower channels revealed flat and oval cellular morphology of the superficial and middle zones, respectively, with the bioink additive (Fig. 4A). The live cell tracker dye produced a sigmoid growth pattern based on quantitative mean fluorescence intensity (MFI) analysis using a statistical two-tailed t-test method with a significance level of p < 0.001. This provides an insight into the temporal dynamics of enhanced cellular proliferation. In addition, their zonal distribution within the developed hyaline cartilage construct indicated cellular density and proliferation on the OOAC platform (Fig. 4B).
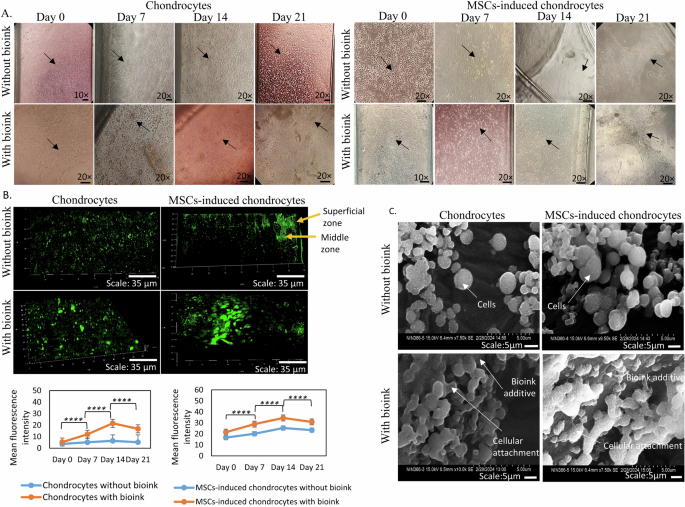
A Representative bright-field micrographs showing the morphology of chondrocytes (left panel) and MSCs-induced chondrocytes (right panel) at days 0, 7, 14, and 21 of culture, with and without bioink. Scale bars: 20x magnification. B Fluorescence micrographs using CLSM depicting cell proliferation gradients for chondrocyte and MSCs-induced chondrocyte tissue constructs stained with a live-cell tracker dye. The green-colour represents fluorescence intensity, with yellow arrow indicating the superficial and middle proliferation zones (top). Scale bar: 35 μm. Quantification of MFI as a measure of viable cells in chondrocyte and MSCs-induced chondrocyte cultures, with and without bioink, at days 0, 7, 14, and 21. Data are presented as mean ± Standard deviation. ****p < 0.0001 compared to respective controls without bioink (bottom). C SEM images illustrating the OOAC sheet aggregate formation and attachment of chondrocyte and MSCs-induced chondrocyte to bioink additive. Scale bars: 10 μm.
SEM ultrastructure characterisation provided detailed insights into the cellular organization and ultrastructure of OOAC tissue. The images revealed the attachment and aggregation of chondrocytes and MSCs-induced chondrocytes to the bioink substrate. The cellular morphology and sheet-like organization corroborate the proliferative behaviour identified in the proliferation assays, confirming the robustness of the OOAC tissue constructs (Fig. 4C).
Cellular viability and histology
The cell viability with 90% live cell population showed biocompatibility with the optimised composite hydrogel and bioink as assessed on day 21 of OOAC cultures (Supplementary Fig. 2A). Haematoxylin and eosin (H&E) staining revealed aggregates of oval-shaped scalloped morphology of chondrocytes and MSCs-induced chondrocytes with bioink. Alcian blue staining demonstrated the differentiation potential of the chondrogenic lineage with accumulated sulfated GAGs. The GAGs are crucial indicators of chondrogenic differentiation, suggesting that OOAC constructs mimic the cartilage structure. Masson’s trichrome staining revealed intense collagen deposition around the proliferating cells in MSCs-induced chondrocytes treated with bioink (Supplementary Fig. 2B).
Confocal microscopy characterisation
The multi-colour-labelled antibodies were used against collagen type I (fibrous type cartilage-specific marker), aggrecan (proteoglycan-specific marker), collagen type II (hyaline type cartilage-specific marker), and laminin (cell-ECM adhesion marker). MFI quantification showed the chondrogenic expression and distribution of the ECM component markers across superficial and middle zones. The superficial zone showed increased collagen type II expression with bioink, displaying fibrous cellular morphology. The collagen type I expression was reduced in the cultures with bioink. The middle zone predominantly showed increased collagen type II expression with bioink cultures and oval morphology. Expression of the fibrous cartilage marker collagen type I was also observed in both chondrocytes and MSCs-induced chondrocytes with bioink cultures, but was reduced in comparison to collagen type II. Aggrecan expression was relatively low in the superficial zone and high in the middle zone. Laminin expression was relatively higher in the middle zone than in the superficial zone with bioink cultures. This indicates the potential of the optimised composite hydrogel with bioink to engineer the ECM niche to promote the growth of hyaline-type cartilage (Fig. 5).
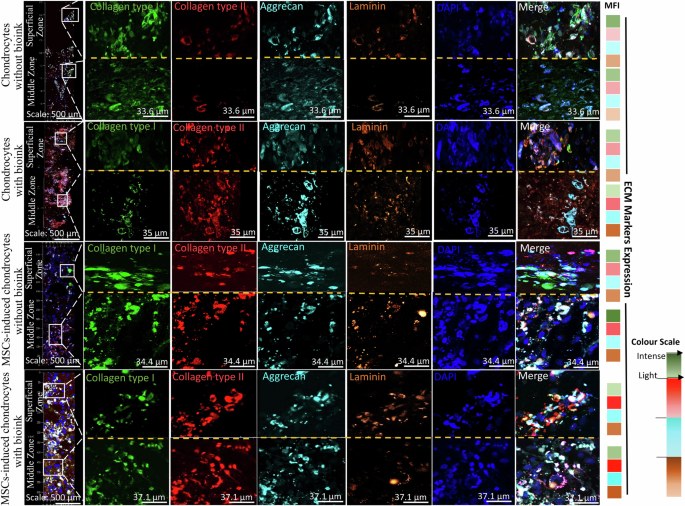
Representative tiled fluorescence micrographs of ECM-specific components in tissue constructs showing distribution and expression of collagen type I (green), collagen type II (red), aggrecan (cyan), laminin (orange), and DAPI nuclear counterstain (blue) for chondrocyte and MSCs-induced chondrocytes cultures. Insets provide higher magnification views of the superficial and middle zone with expression of aforementioned markers. The merged panels display the co-localization of the different ECM components. Scale bars: 500 μm (tiled images), 33.6 μm (chondrocytes without bioink), 35 μm (chondrocytes with bioink), 34.4 (MSCs-induced chondrocytes without bioink) and 37.1 μm (MSCs-induced chondrocytes with bioink). The MFI heat map showed differential expression of the ECM markers for without and with bioink constructs across the superficial and middle zones. The intense colour scale represents as high MFI and light colour scale as low MFI. Green (Collagen type I), Red (collagen type II), Cyan (aggrecan) and Orange (laminin). [MFI-Mean Fluorescence Intensity]
Gene expression
The fold change in the gene expression profile for fibrous and hyaline specific cartilage markers collagen type I and collagen type II respectively demonstrated the impact of bioink culture conditions on chondrocytes and MSCs-induced chondrocytes. In chondrocytes without the bioink, chondrocytes exhibited reduced fold changes in collagen type II (0.11) and laminin (0.05). However, the presence of bioink enhanced the gene expression of collagen type II (0.21) and laminin (0.13), suggesting a positive influence on the production of ECM components by chondrocytes. MSCs-induced chondrocytes without bioink showed an increased fold change of 1.41 in collagen type I, and 1.17 in collagen type II, respectively, compared to chondrocytes, indicating a shift towards a chondrogenic lineage. With bioink, MSCs-induced chondrocytes further enhanced the collagen type II (1.78) fold change, reinforcing the favorable impact of bioink on MSCs for chondrogenesis. Collagen type I gene expression without bioink resulted in the formation of fibrous cartilage that mimicked native cartilage phenotypically, but failed to support mechanical properties. When integrated with bioink with MSCs-induced chondrocytes, a continuous chondrogenic environment led to a shift towards a more functional cartilaginous hyaline matrix, with an increase in the amount of type II collagen, as demonstrated during 21 days of culture (Fig. 6A).
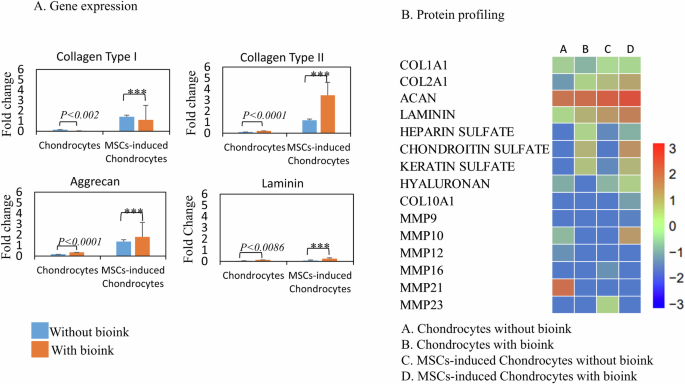
A Quantitative real-time PCR analysis of mRNA expression levels for collagen type I, collagen type II, Aggrecan, and laminin. Fold change in gene expression was presented as 2-ΔΔCT for constructs without and with bioink as control and test respectively. Blue bars represent samples without bioink, and orange bars represent samples with bioink. Data are shown as mean ± standard deviation. Statistical significance is indicated as ***p < 0.001, with exact p-values stated where applicable. B LC-MS protein profiling heat map displayed differential expression of proteins based on PLGS score for without and with bioink as control and test respectively. The scale indicated the intensity of the PLGS score from lowest (blue) to highest (red).
The quantitative polymerase chain reaction (qPCR) products loaded on a 3% agarose gel revealed bands for the aforementioned hyaline cartilage markers, cell-ECM adhesion markers, and the housekeeping gene GAPDH (496 bp) as internal control. The 50 bp DNA ladder loaded as control resolved with a run time of 3.5 h at 70 voltage. The intense bands visualized for collagen type II (149 bp) in MSCs-induced chondrocytes, showing their differentiation towards hyaline cartilage. Collagen type I (107 bp) bands were comparatively faint for both chondrocytes and MSCs-induced chondrocytes with bioink, indicating that the cartilage tissue construct was more hyaline than fibrous cartilage. The intense laminin band (327 bp) observed in MSCs-induced chondrocytes with bioink, indicating cellular attachment to the ECM. Aggrecan showed bands (80 bp) in all the samples, indicating the presence of proteoglycan content (Supplementary Fig. 3A).
Protein profiling
The extracted proteins run on SDS-PAGE showed bands (65 kDa) with bovine serum albumin (BSA) and protein ladder (20 kDa) as reference for confirming the protein qualitatively (Supplementary Fig. 3B). The liquid chromatography-mass spectrometry (LC-MS) analysis generated heat maps showing differential protein expression of COL1A1, COL2A1, aggrecan proteoglycan core protein, laminin, heparan sulfate, chondroitin sulfate, keratin sulfate glycosaminoglycans, hyaluronan, and matrix metalloproteinases (MMPs), as ProteinLynx Global Server (PLGS) score for without and with bioink cultures. The COL2A1 (8.54, 12.8), aggrecan (0.844, 0.951), and laminin (0.07, 2.85) fold changes were upregulated in the bioink culture conditions for chondrocytes and MSCs-induced chondrocytes, respectively. The fold change for COL1A1 was downregulated in chondrocytes (5.53) and MSCs-induced chondrocytes (1.733) with bioink compared to control samples without bioink. Chondroitin sulfate fold change showed upregulation in protein expression for chondrocytes (0.61) and MSCs-induced chondrocytes (1.062) with bioink. Hyaluronan protein expression was also observed with PLGS scores of 33, 59.6 for chondrocytes and MSCs-induced chondrocytes respectively. COL10A1 expression was specific to MSCs-induced chondrocytes with bioink by PLGS score of 22.34. MMP10 and MMP21 protein expression was specific to chondrocytes without bioink, with PLGS score of 35.04 and 141.29, respectively (Fig. 6B) (For PLGS scores refer Supplementary Table 2).
Tensile strength measurements
The tensile strength measured for the native articular cartilage exerted a maximum force (MPa) with a breaking point of 2.39 ± 3.36 (mean ± standard deviation). The OOAC tissue constructs of chondrocytes without and with bioink showed a breaking point at 0.482 ± 0.22 (MPa) and 0.579 ± 0.199 (MPa) respectively. The MSCs-induced chondrocytes OOAC tissue constructs without and with bioink demonstrated a breaking point at 0.844 ± 0.699 (MPa) and 1.01 ± 3.118 (MPa) respectively (Fig. 7).
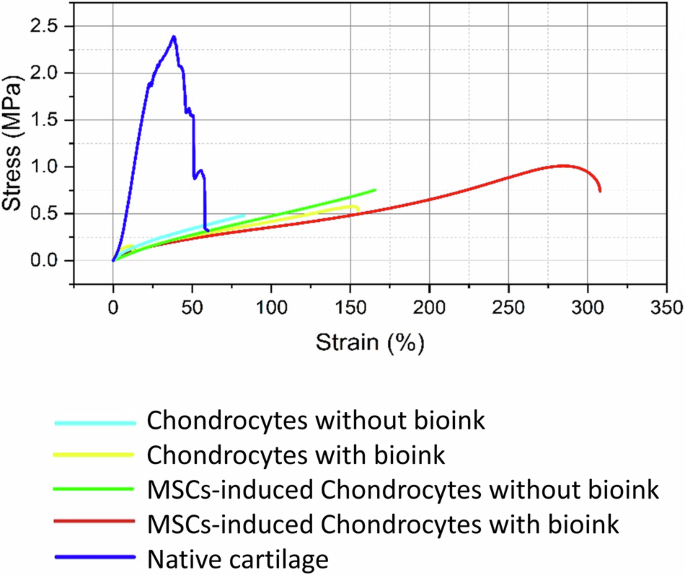
Tensile stress-strain curve for native articular cartilage tissue, showing the non-linear behaviour with stress of 2.39 MPa (blue). Tensile testing of chondrocyte-laden hydrogel constructs without and with bioink. Constructs with bioink exhibited higher tensile strength (0.579 MPa) (yellow), compared to constructs without bioink (0.482 MPa) (light blue) MSCs-induced chondrocytes without bioink (green), constructs showed further enhanced tensile strength of 0.844 MPa and with bioink (red) reached 1.01 MPa.
Discussion
Developing substitutes for articular cartilage requires a combination of high compressive strength, excellent biocompatibility, and maximum shear stress load-bearing capacity. The native articular cartilage compression modulus has a wide range of 0.08–2.5 MPa across the gradient zones. Achieving mechanical strength similar to that of articular cartilage using natural composite biopolymers with enhanced stiffness and strength has proven to be challenging. The various ratios of composite hydrogels and concentration of glutaraldehyde cross-linking agent was tested for their optimisation to achieve aforementioned selection criteria10. The force-displacement curves exhibited a non-linear response characterised by a continuous upward deflection. The upward deflection indicates the force (stress) required increases at a greater rate to compress the hydrogel compared to the displacement (strain). This non-linear behaviour is characteristic of polymers and elastic materials undergoing large deformations beyond the initial linear region11. Thus, the non-linear curve of the 2:3 ratio hydrogel suggests the most promising formulation with complex stress-strain response under compressive loading conditions.
The sterilisation and layering of microfluidic channels with the chitosan component was a challenge owing to its dense and viscous nature. The challenge was addressed by autoclaving at standard pressure (15 psi) and temperature (121 °C), with a reduced hold time of 10 min. The reduced autoclaving time did not compromise sterility, achieved through degassing the chitosan solution. Degassing also reduced the viscosity, resulting in a homogeneous, easy-flowing, solution without affecting its density and cross-linking reaction with glutaraldehyde. Optimising the polymerisation temperature, cross-linking time, concentration and ratio were crucial factors influencing composite hydrogel preparation and micropore structure12. The freeze-drying process and cross-linker concentration were the primary factors contributing to the generation of microporosity within the sodium alginate/chitosan composite hydrogel.
The microfluidic process optimisation depends on the parameters of pressure, flow rate, and length of the tubing connectors. The dynamic conditions applied in the application note (Fluigent) to create complex mechanical simulation patterns on 3D cell culture in a microfluidic platform, with 1.5 h of perfusion of the cell-laden hydrogel per day, using uniform compression of 800 mbar focuses on creating a cartilage-on-a-chip model13. Based on this, the pressure optimisation was initiated with a high-pressure input of 800 mbar for the upper channel and 450 mbar for the lower channel perfusing 80 μL volumes of media per minute. The inlet and outlet tubing lengths of 39 cm and 32 cm, respectively, also impacted the media consumption by more than 80 μL per min. In addition, the transfer time required for the media flow along the tube increased beyond one minute. To limit these effects without impacting the shear stress on the developing OOAC tissue construct, the pressure rates were gradually reduced and optimised to 150 mbar and 50 mbar for the upper and lower channels, respectively, with media flow rate of 5 μL min−1. The average inlet and outlet tubing lengths of 24 cm and 18 cm, respectively, reduced the transfer time to less than one minute along the microfluidic tubing.
The use of a pressure controller microfluidic system can precisely control the differential pressure gradients and dynamic simulation within the microfluidic channels, biomimicking the structure and mechanical compressions of native cartilage under various external shear stress conditions14. The double-flow microfluidic device enables the microenvironment for the development of superficial and middle zones of cartilage on an optimised composite hydrogel using a pressure controller microfluidic system because of its ability to maintain precise and stable pressure gradients. Dynamic simulation promotes tissue remodelling, matrix deposition, and maintenance of tissue homeostasis in both the superficial and middle zones of engineered cartilage constructs, mimicking the complex mechanical environment of cartilage tissue in-vitro15.
Temporal understanding of cell proliferation dynamics provides crucial insights into the development and maturation of engineered hyaline cartilage tissue constructs over time. The observed sigmoid growth pattern of cell proliferation suggests successful integration and proliferation of chondrocytes and MSCs within the engineered tissue constructs. This enhanced proliferation coupled with the structural organization observed via SEM underscores the potential of the composite hydrogel with bioink as a promising platform for the development of hyaline cartilage tissue constructs. The combination of phase-contrast microscopy, proliferation assays, and SEM offers comprehensive insights into the temporal dynamics and structural characteristics of engineered hyaline cartilage tissue constructs. The proliferation patterns and cellular organization highlight the potential of the optimised composite hydrogel with bioink in accelerating the growth rate and supporting the differentiation.
The distinct differential expression and distribution of ECM components across the superficial and middle zones contributes to the unique biomechanical properties and structural organization of the articular cartilage. Collagen type II expression provides the tissue construct with compressive strength and resistance to shear forces in both the superficial and middle zones. Additionally, collagen type I expression in the middle zone plays a significant role in anchoring the tissue construct to the underlying subchondral bone. The aggrecan component that forms large proteoglycan aggregates attracts water molecules, contributing to the ability of OOAC tissue constructs to resist compression. This contributes to the high tensile strength and resistance to shear forces in the superficial zone and allows it to withstand high compressive loads in the middle zone16. The higher expression of laminin in the middle zone contributes to the structural integrity, organization, and anchoring of cells with the bioink additive and the surrounding ECM.
The differential protein expression patterns observed in this study highlight the influence of the bioink additive on the behaviour and maturation of chondrocytes and MSCs-induced chondrocytes. The bioink construct appeared to promote hyaline-type chondrogenesis, as indicated by the expression of COL2A1, aggrecan, and laminin. The absence of bioink in the construct favours fibrous cartilage, characterized by increased expression of COL1A1. MMPs protein expression profiles provide insights into chondrocyte hypertrophy and cartilage remodelling processes. COL10A1 facilitates chondrocyte hypertrophy and regulates matrix mineralization, which are essential processes in endochondral ossification and bone formation. MMP10 involved in the degradation of collagen, their elevated expression indicates the initiation of hypertrophic differentiation and matrix remodeling on long term culturing17. The MMP21 involved in the degradation of proteoglycans with their increased expression in chondrocytes without the bioink suggests an active catabolic state, which may lead to cartilage matrix breakdown and remodelling18. Hence, the inclusion of bioink plays a crucial role in preventing ECM breakdown, thus aiding in the engineering of OOAC tissue constructs.
Tensile strength measurements of native articular cartilage and OOAC tissue constructs provide crucial insights into the mechanical properties of the engineered cartilage. The native articular cartilage exhibited non-linear behaviour, with the initial steep linear region representing elastic deformation, followed by a gradual decrease in stress, which could be due to damage or rearrangement of the cartilage structure under high tensile loads. The OOAC tissue constructs of chondrocytes and MSCs-induced chondrocytes without bioink exhibited predominantly linear stress-strain curves, indicating that they deformed elastically under tensile loading. The linear stress-strain curve of the material deforms elastically, following Hooke’s law: In this region, the strain is proportional to the applied stress, and the material can recover its original shape upon the removal of the stress. The slope of the linear portion represents the elastic modulus or stiffness of a material19. The chondrocytes and MSCs-induced chondrocytes with bioink OOAC constructs presented an initial linear region, followed by a non-linear region, suggesting that these materials undergo inelastic deformation or damage at higher strain levels. The non-linear behaviour observed in the native cartilage and the bioink-containing OOAC constructs could be attributed to their viscoelastic nature, complex structure, and composition of the cartilage tissue, where the deformation depends on both the applied stress and the rate of loading. Non-linearity arises from interactions between the collagen fibril network, proteoglycans, and interstitial fluid within the cartilage matrix. These findings highlight the potential of MSCs-induced chondrocytes with bioink in composite hydrogel based cultures for cellular proliferation and production of hyaline-specific ECM components. The engineered tissue constructs exhibited high compressive strength mimicking the mechanical behaviour of native cartilage, facilitating the development of superficial and middle zones in a dynamic double-flow microfluidic system. Thus, OOAC tissue constructs attract significant attention for drug testing and as a promising model for disease modelling.
Methods
Ethical statement
Human articular cartilage explants and omentum adipose tissue samples were obtained from patients (N = 10) aged 23–70 years with prior informed and written consent in accordance with the Declaration of Helsinki and approval from the Ethics Committee of Biomedical Health Research, Gleneagles Global Hospitals (File No: SPF/2021/000126).
Materials
Dulbecco’s Modified Eagle Medium (High Glucose-DMEM, 1 g L−1 D-glucose, 500 mL-11885084), fetal bovine serum One ShotTM Format, US origin (FBS, 50 mL-A3160401), collagenase type I powder (1 g-17100017), and collagenase type II powder (1 g-17101015) were obtained from Gibco (Life Technologies Corp). L-ascorbic acid (100 mg-A4403), dexamethasone (25 mg-D1756), transforming growth factor beta-2 (TGFβ-2, 10 µg-T2815), basic fibroblast growth factor (bFGF, 25 µg-F3685), sodium alginate powder (1 kg-W201502), high-molecular-weight (310–375 KDa) chitosan (50 G-419419), glacial acetic acid (100 mL-A6283), calcium chloride powder (1 G-10043524), and glutaraldehyde solution (50 mL-G5882) were obtained from Sigma Aldrich. All antibodies were purchased from Novus Biologicals (USA) and used at recommended dilutions. Cell Tracker™ Green CMFDA Dye (Cat. C2925; Invitrogen) and antibiotics (gentamycin, 50 mg mL−1–15750060; amphotericin B, 20 mL-15290018; penicillin-streptomycin, 10000 U mL−1–100 mL-15140122) were purchased from Thermo Fisher Scientific. Cell strainers (40 µm, 70 µm-431751) were obtained from Corning®. Forward and reverse primers were obtained from Eurofins. Other chemicals were purchased from Sigma–Aldrich Chemical Co. (USA). The microfluidic device and system components were procured from BEOnChip and Fluigent, France.
Methodology
Composite hydrogel optimisation and characterisation
Sodium alginate-chitosan composite hydrogel preparation
The 1% (w/v) and 2% (w/v) sodium alginate solutions were prepared by dissolving sodium alginate powder in distilled water using a magnetic stirrer to obtain a homogenous solution. A chitosan solution (2% w/v) was prepared by dissolving chitosan powder in 30 mL of aqueous glacial acetic acid (GAA, 1% v/v). Both the solutions were then autoclaved at 121°C for 10 min at 15 psi pressure. A calcium chloride (100 mM w/v) solution required for polymerizing sodium alginate was prepared by dissolving it in distilled water. Glutaraldehyde solutions (0.5% and 1% v/v) required for polymerizing the chitosan solution were prepared in distilled water. The prepared cross-linking solutions were 0.2 µm filter sterilized. The Polymerization reaction was performed with constant agitation in an orbital shaker incubator with temperature maintained at 37 °C for 16 h to achieve uniform and efficient cross-linking9.
Composite hydrogel formulations
Sodium alginate (1% w/v) and chitosan solutions (2% w/v) were mixed at ratios of 1:1, 2:1 respectively and cross-linked with calcium chloride (100 mM w/v) and glutaraldehyde (0.5% v/v) cross-linking solutions for concentration optimisation. Another set of composite hydrogels was prepared with formulations in 1:1 and 2:1 ratios of sodium alginate (2% w/v) and chitosan (2% w/v) solutions, respectively, with calcium chloride (100 mM w/v) and glutaraldehyde (0.5% v/v) cross-linking solutions for ratio optimisation. Furthermore, formulations were prepared in 2:1, 2:3, and 3:2 ratios of sodium alginate (2% w/v) and chitosan solutions (2% w/v), respectively, with calcium chloride (100 mM w/v) and glutaraldehyde (1% v/v) cross-linking solutions for both concentration and ratio optimisation. Sodium alginate-chitosan composite hydrogel formulations prepared at various ratios and concentrations were characterized to achieve mechanical compression properties similar to those of human native articular cartilage.
Mechanical testing
Compression measurement
The formulated composite hydrogels were characterized for compression measurements using a universal testing machine (UTM, 500 N load cell, IMADA FSA-0.5K2). The formulated composite hydrogels were prepared with dimensions of 18 mm × 8 mm (diameter × height), calculated for area measurement, and mounted onto the load cell. The samples were subjected to a maximum uniaxial force (N) to measure the amount of deformation in height (displacement in mm) at a constant speed rate (10 mm min−1). The point at which the load cell plate touched the sample with maximum deformation and created a break in the formulated composite hydrogels was recorded for force (N) versus displacement (mm) data20. The deformation fracture point recorded as force vs. displacement data was converted to a stress (MPa)–strain (%) curve for Young’s modulus (E) analysis.
Tensile Strength measurement
The formulated composite hydrogel displaying compression measurement relative to native articular cartilage was optimised, micro-scaled as per microfluidic device channel dimensions, and tested for tensile strength (UTM, 5 kN load cell, Zwick-Z100). The samples displayed uniaxial displacement (mm) in the length of the optimised composite hydrogel. Testing was initiated by clamping the sample between the screw and wedge grips with an initial force (N) reduced to zero and applying a gradual force at a speed of 1 mm min−1. The point where the sample broke was recorded as force (N) vs. displacement (mm) data, and the stress (MPa) vs. strain (%) curve plotted was analysed. The sample area was calculated using the average thickness of three different data points (the upper, central, and lower regions)21. Statistical analysis was performed considering the mean and standard deviation from the mean to quantify the variability in the compression and tensile strength properties of the formulated and optimised composite hydrogels.
Topological characterisation using SEM
The optimised composite hydrogel was frozen at −20 °C for 24 h and subsequently lyophilized using a freeze-dryer to ensure complete removal of moisture while preserving the structural integrity of the composite hydrogel. The freeze-dried composite hydrogel and OOAC tissue construct were fixed in 4% paraformaldehyde at room temperature for 30 min to stabilize them, followed by three times rinse in 1× phosphate buffered saline (PBS) to eliminate residual fixative. To prevent shrinkage and damage to the samples during imaging, the samples underwent a dehydration process using increasing concentrations of ethanol, with each step consisting of 30 min incubations at room temperature and centrifugation at 1200 rpm for 10 min at 4 °C. Once fully dehydrated, the samples were dried under high vacuum for two hours before being mounted on metal stubs. A thin conductive layer was applied through sputter coating to reduce charging effects during SEM imaging. The SEM imaging was carried out at magnifications ranging from ×8.0 to ×10.0k with an accelerating voltage of 15 kilovolts (kV) under high vacuum (10−7 torr)22. The methodology used was crucial in preserving architecture and revealing a microporous structure for supporting the potential cellular attachment and proliferation.
Swelling behaviour
The swelling behaviour of the optimised composite hydrogel was investigated through fluid uptake to measure the swelling ratio and swelling capacity percentage. The DMEM media (200 µL, pH 7.2) added to the hydrogel was incubated at 37 °C for 16 h. After every 16 h, the media was carefully removed, and the absorbance weight was recorded. The swelling ratio (S) every 16 h was calculated S=(Wt-Wd)/Wd and the swelling capacity percentage was determined using the swelling capacity (%) = (Wt-Wd)/Wd × 100, where Wt represents the absorbance weight after 16 h, and Wd the initial dry weight23.
Microfluidic system
Microfluidic device assembly
The microfluidic device was a double-flow device composed of two upper and lower channels separated by a thin polydimethylsiloxane (PDMS) membrane. The upper channel connects the upper inlet and outlet (UI and UO), while the lower channel connects the lower inlet and outlet (LI and LO). The dimensions of the channel were 1.130 mm × 4 mm × 30 mm (height × width × length), with a pore size of 8 µm. Based on computational flow dynamics (CFD) from the manufacturer (Fluigent, France), the laminar flow parameters were optimised. The laminar flow of media required an optimum pressure input of 2.3 bar (range 0–3 bar), with a flow rate of 5 µL min−1 (maximum flow rate of 2.8 ×10⁴ µL min−1). The resistance was 1.069 ×10⁻⁴ mbar. The Reynolds number was 375.070, with a wall shear stress of 11.906 dyne cm-2 and a media velocity of 236.265 mm s−1. The aforementioned parameters ensured that media perfusion through the microfluidic device was laminar24.
The experimental design included separate microfluidic devices layered with an optimised composite hydrogel on the surface and underside of the PDMS membrane of the upper and lower channels for chondrocytes and MSCs-induced chondrocyte cultures with and without the bioink additive. The upper channel represents the superficial layer of the articular cartilage construct, which receives a high shear pressure of 150 mbar. The lower channel represents the middle layers that received a comparatively low shear pressure of 50 mbar. The difference in shear pressure aids in achieving and mimicking the cellular morphology of the native articular cartilage.
OxyGen software protocol
The microfluidic process flow was programmed and executed by creating a protocol editor template using the OxyGen software (version 2.3.2). A protocol editor is used to map the sequential steps of the process flow, dividing it into sequences based on the process stages. Fluid routing, including inlet/outlet connections and valve configurations, was specified for each step, along with the desired flow rates, pressures, and volumes. Process parameters such as flow rates, pressures, temperatures, and timing for perfusion, incubations, and residence hold time were configured according to the requirements. Real-time sensor feedback, such as flow rates and pressures, has been incorporated for process monitoring and control with decision points and conditional statements based on sensor data. The protocol was integrated with instrumentation for live monitoring systems25. Protocol simulations with 1x PBS and DMEM media through a composite hydrogel bed were performed to verify the steps, fluid routing, and parameter settings before OOAC execution. During execution, relevant data streams, including pressure and flow rate data, imaging graphical outputs, and analytical run data, were recorded for post-processing analysis and process optimisation.
Microfluidic device disassembly
Device disassembly was performed by gently peeling out the edges using a scalpel blade and separating each channel. The upper channel was separated from the lower channel, and the PDMS membrane with the OOAC tissue construct prototype, generated in vitro using a microfluidic system, was subjected to downstream analysis of cellular viability, SEM, histology, gene expression, and protein profiling characterisation.
Articular cartilage OOAC characterisation
Isolation and culture of native chondrocytes
The chondrocytes were isolated from human articular cartilage explants (1-2 mm) and collected in H-DMEM under aseptic conditions, as part of trauma and from knee replacement surgical procedures. The explants were thoroughly rinsed with 1× PBS containing antibiotics to remove any undesirable contaminants. Tissue explants were minced using a sterile surgical blade (No. 21), subjected to mechanical and enzymatic digestion with collagenase type II (1 mg mL−1) supplemented with FBS (2.5%), antibiotics in H-DMEM, and incubated for 16 h at 37 °C on an orbital shaker. After incubation, the enzymatic reaction was stopped with FBS (10%) and the cells were strained through a 70 µm cell strainer to separate the chondrocytes from the ECM. The cell suspension was centrifuged at 1800 rpm for 5 min to obtain a cell pellet. The supernatant was discarded and the cell pellet was rinsed with 1× PBS by spinning at 1800 rpm for 5 min. The chondrocytes obtained as cell pellets were suspended in H-DMEM containing FBS (10%), L-ascorbic acid (50 µg mL−1), dexamethasone (1 mM), TGFβ-2 (50 µg mL−1), and an antibiotic solution containing gentamicin (50 IU mL−1), amphotericin B (2.5 µg mL−1), and penicillin-streptomycin (100 IU mL−1)26,27 (hereafter referred to as chondrogenic differentiation media).
Adipose-derived stem cells (ADSCs) isolation and differentiation
The omentum adipose tissue was the sample source for the isolation of MSCs. Fat tissue was obtained from patients undergoing liposuction procedures for morbid obesity and pooled to minimize age variability and impact on proliferation and differentiation potential. Discarded fat tissue was collected under aseptic conditions in H-DMEM supplemented with antibiotics. The tissue was rinsed in 1× PBS containing antibiotics to remove undesirable contaminants and minced using a scalpel. The minced tissue was subjected to enzymatic and mechanical digestion with type I collagenase (1 mg mL−1) for 45 min in a humidified atmosphere of 95% air and 5% CO2 at 37 °C with intermittent agitation using a vortex mixer. The digested tissue was then filtered through a 40 μm cell strainer, and the cells obtained were centrifuged at 1500 rpm for 5 min. The resulting cell pellet of ADSCs was resuspended in H-DMEM supplemented with FBS (10%), antibiotics, and bFGF (10 ng mL−1)28 (hereafter referred to as MSCs culture media).
Culture conditions
The 2:3 ratio optimised composite hydrogel with 2% sodium alginate (20 µL), 2% chitosan (30 µL), 100 mM calcium chloride (20 µL), 1% glutaraldehyde (30 µL) and with/without bioink additive (100 µL) in ice-cold H-DMEM (100 µL) conditions was added from the upper and lower inlets of the channel. The hydrogel was allowed to polymerize at 37 °C for 1 h on an orbital shaker. The polymerized hydrogel bed was primed with 1x PBS followed by H-DMEM to maintain physiological pH for acclimatizing chondrocytes and MSCs-induced chondrocytes. The isolated chondrocytes and ADSCs (1 × 10⁶ cells per 100 µL) were perfused for 8 h on separate microfluidic devices. The chondrocyte cultures were perfused with chondrogenic differentiation media, and ADSCs were initially perfused with MSCs culture media for cellular attachment. At 80% confluency, they were subjected to chondrogenic differentiation media. The spent media were collected for every 8 h culture replenishment for performing the downstream assay, followed by incubation of the cultures at 5% CO2 at 37 °C for 16 h.
Proliferation assay
OOAC tissue constructs cultured with microfluidic perfusion for three weeks were monitored for cellular growth and proliferation on days 0, 7, 14, and 21 using a phase contrast microscope and live cell tracker dye, respectively. The proliferation assay was performed using 5 μM green cell tracker dye in H-DMEM without FBS, and incubated at 37 °C for 30 min23. After incubation, the tissue construct was rinsed with 1× PBS and imaged using confocal laser scanning microscopy (CLSM) software LAS X Office v1.4.5 (Leica). The proliferation pattern with and without bioink cultures on the optimised composite hydrogel was represented using the quantitative MFI.
Cellular viability assay
Spent media collected over 21 days with and without bioink cultures of chondrocytes and MSCs-induced chondrocytes (1 × 10⁶ cells mL−1) were stained with 10 µL of 7-AAD cell viability dye, with unstained cells serving as a control. The cells were incubated for 20 min at 4 °C in the dark, and the percentage of live to dead cells for unstained and stained cells was analysed using a flow cytometer (Becton Dickinson FACS CaliburTM)29.
Histological characterisation
The microfluidic device was disassembled, and the OOAC tissue construct samples were embedded and frozen in an OCT medium at −20 °C temperature in a cryostat chamber for cryo-sectioning. Sections of 3 μm thickness were placed on charged compatible glass slides for histological staining with haematoxylin and eosin (H&E)30, Alcian blue31, and Masson’s trichrome32 for morphological identification, sulfated GAGs accumulation, and collagen content deposition, respectively.
CLSM characterisation
The immunocytochemistry (ICC) staining was performed directly on the assembled microfluidic device by adding 4% paraformaldehyde solution and fixing the tissue construct for 5 min. The cells were washed 2× with 1× PBS for 5 min each, and permeabilization was performed using 0.5% Triton X-100 and 5% FBS in 1× PBS buffer and incubated for 20 min at room temperature. The permeabilization buffer was removed and multi-colour stained antibodies were added and incubated in a humidifying chamber for 16 h at 4 °C. The labelled antibodies were collagen type I-fluorescein isothiocyanate (FITC), collagen type II-phycoerythrin (PE), aggrecan-allophycocyanin (APC), and laminin-peridinin chlorophyll protein (PerCp) conjugates. The antibodies were removed by rinsing thrice with 1× PBS for 5 min each on an orbital shaker. The sections were counterstained for 5 min with nuclear stain 4′, 6-diamidino-2-phenylindole (DAPI, 1 mg mL−1), rinsed with distilled water, and mounted with glycerol for imaging using CLSM (Leica TCS SPE)9,33.
qPCR gene expression
The OOAC tissue constructs disassembled from the device were subjected to RNA isolation using a Qiagen Miniprep Kit (cat. no. 74104), and its quality and purity were evaluated using a spectrophotometer (NanoDrop2000, Thermo Scientific). The isolated RNA template (2 µg) was subjected to cDNA conversion using a 2× reverse transcriptase (RT) master mix consisting of 10× RT buffer, 25× dNTP mixture (100 mM), 10× RT hexamer random primers, MultiscribeTM RT enzyme, and nuclease-free water in a final reaction volume of 10 µL. The thermocycling conditions were optimised for the initial hold (25 °C, 10 min), RT enzyme activation step (48 °C, 30 min), and the final enzyme inactivation step (95 °C, 5 min). The converted cDNA was subjected to qPCR gene expression profiling using ECM-specific forward and reverse primers for collagen type I, collagen type II, aggrecan, and laminin, with normalisation against the housekeeping gene GAPDH as internal control (Table 1).
The qPCR was performed using 5 µg cDNA added to 2× SYBR® select master mix supplemented with the aforementioned forward and reverse primers (10 pmol µL−1) in nuclease-free water for a final reaction volume of 20 µL. The PCR cycling and melting curve conditions were set to the initial activation step (95 °C, 5 min), followed by 45 cycles of two-step denaturation (95 °C, 15 s) and annealing/extension (60 °C, 60 s). The final run data was analysed with a threshold value of 0.05, and gene expression levels and fold changes were calculated using cycle threshold (Ct) values and the 2-∆∆Ct method respectively9. The fold changes were calculated using culture conditions of without and with bioink as control and test respectively.
Protein profiling
Sample preparation
The OOAC tissue constructs separated from the microfluidic device were subjected to protein profiling using the label-free quantification (LFQ) method of LC-MS. The tissue construct was subjected to a protein extraction step with the addition of an extraction buffer, vortexed for 5 min, and stored at 4 °C for an hour. The sample was centrifuged for 20 min at 4 °C at 7000 rpm, and the supernatant was collected. To the supernatant, 1:1 ratio of acetonitrile and water was added and after an hour the sample was centrifuged for 20 min at 4 °C at 7000 rpm. To the supernatant, four volumes of chilled acetone were added and to the hour centrifuged at 4 °C, 7000 rpm for 20 min. The pellet was dissolved in 50 mM ammonium bicarbonate and subjected to sodium dodecyl sulfate polyacrylamide gel electrophoresis (SDS-PAGE) and silver nitrate stained for qualitative estimation.
Protein digestion and LC-MS analysis
100 μg of protein sample was digested. The samples were diluted with 100 mM NH4HCO3 and treated with 100 mM dithiothreitol (DTT) at 95 °C for 1 h, followed by 250 mM lithium di-isopropyl amide (LDA) at room temperature in the dark for 45 min. The sample was then digested with trypsin (0.1 μg μL−1) at a 1:20 (sample: enzyme) ratio and incubated overnight at 37 °C. The resulting sample was vacuum-dried and dissolved in 50 μL 0.1% formic acid in water. After centrifugation at 10000 g, the supernatant was collected into a separate tube and 10 μL injection volume was used on the BEH C18 UPLC column for separation of peptides. The peptides separated on the column were directed to a Waters Synapt G2 Q-TOF instrument for mass spectrometry (MS) analysis. UniProt Knowledgebase (UniProtKB) was used as a comprehensive resource database to identify the protein PLGS score and fold-change8.
Statistical analysis
All measurements were made in triplicate (N = 10), and data are presented as mean values ± standard deviation using GraphPad Prism software. The data were analysed statistically using the Student’s t-test with an unpaired two-tailed method performed on the sample means. A value of p < 0.05 was considered to be statistically significant and is represented on the graphs with an asterisk letter.
Responses