Blood pressure waveform morphology assessed using a transmission line model and harmonic distortion analysis

Introduction
Aortic stiffening, as a consequence of adverse remodeling and breakdown of elastic fibers, is associated with higher risk for cardiovascular disease and other chronic diseases of ageing1,2,3. Therefore, there is growing interest in techniques that can be used to assess arterial stiffness in the clinic. One approach is to assess changes in morphology of the blood pressure waveform (BPW), a recording of blood pressure as a function of time. The features of a BPW manifest from the blood flow interacting with various sources of mechanical impedance such as wall stiffness throughout the vasculature4,5,6. Certain features of BPW, such as wave reflection present in the aggregate waveform, increase with age through midlife and may be associated with cardiovascular risk7. However, previous studies have yielded mixed relations of wave reflection measures with cardiovascular risk, which has limited further investigation4,8,9,10. Although previous attempts have focused on pressure differentials between waveform features7,8,10,11, this method proved inconsistent due to the different BPW morphologies corresponding to aging and cardiovascular conditions13.
The BPW is made up of two dominant waves: a forward wave generated from the heart and an aggregate or global reflected wave produced by differences in characteristic impedances between contiguous vessels4,9,14,15. The reflected wave augments the forward wave to produce a characteristic shoulder in BPW, which is used to quantify wave reflections via the augmentation index (AI), which measures changes in BPW morphology solely from peak pressure differences between the two waves11,15. Wave reflection in general is known to play a role in cardiovascular risk, though how wave reflection relates to arterial heath is still not fully understood4,8,9,15. Past studies have attempted to connect AI to pulse wave velocity (PWV), a gold-standard index of arterial stiffness, calculated using the difference in arrival times of pressure waveforms over a measured length of artery16,17. These studies have shown that AI increases linearly with PWV, except for individuals 60 and older where AI was shown to decrease7. The resulting nonlinear relations of AI with aortic stiffness suggest that wave reflections may be affected by more complex interactions between hemodynamics and vessel biomechanics, which are known to change with age7,18. The limitations of AI as an index have impeded its relevance in recent years, favoring the more reliable PWV, which does not require waveform shape information9. Nevertheless, published measurements of PWV commonly require specialized equipment and training, which may not be available in all clinics. Recently, we introduced an index, harmonic distortion (HD)19, a frequency-domain assessment of BPW morphology. Using a mouse model, we showed that HD is correlated with stiffness of carotid artery, from both in vivo and in vitro measurements, and with age, suggesting that HD is sensitive to arterial stiffening.
Transmission line models have been used to study effects of wall properties on BPWs when the vasculature is modeled as a network of mechanical impedances20,21,22,23,24,25,26. These models utilize electrical components to approximate impedance to blood flow, an approach that was first conceptualized in the late 1950s27. Some of the first transmission line models were then developed and validated, with the application of the model in the human arterial tree published in 196926. The model was then implemented to study arerial stenosis20,25and showed that narrowed vessels correspond to higher PWV. Stergiopulos et al. studied Winkessel values and the effect of different terminating complex impedances on blood flow25, varying the number and configuration of elements which importantly defines the 3-element standard. Davies et al. further showed that wave reflections originate from multiple smaller reflection sites rather than one large discrete site21, which is important for understanding the nature of wave propagation within the complex arterial system. Westerhof et al. has recently published results from a 121-segment model in combination with a detailed aging model to recreate increasing aortic PWV with age6.
The primary goal of this study was to establish the biomechanical contributors to our recently introduced index, HD. To this end, we implemented a transmission line model and compared HD to other existing arterial function measures, AI and PWV, under a variety of simulated physiological and pathological conditions. Specifically, the model was used to simulate a physiological BPW, from which HD, AI, and PWV were calculated. Using sensitivity analysis, the effects of various biomechanical parameters of the arterial wall and blood flow on BPW and associated indexes were studied. Furthermore, the model was also used to simulate a clinical scenario by generating arterial trees with biomechanical and geometrical parameters systematically varied to represent a population of subjects to help better understand the relative contribution of these variables to HD, AI and PWV.
Methods
Transmission line model
A transmission line model was implemented that consists of the aorta and its subtended tree-segments as detailed by Westerhof et al.6 (Table S1) and shown in Fig. 1. The ends of the transmission line are terminated with a complex impedance described by the three-element Windkessel model28 (Fig. 2a) using values reported by Stergiopulos et al.25(Table S2), which accounts for the impedance generated by further distal branches. The model consists of 36 segments6, representing the arterial tree of an adult male, with vessel name and data listed in Table S2. In our model, there are 25 distal terminations that need to be defined. According to Westerhof et al.6, these distal segments were terminated with three-element Windkessel models that consist of a downstream parallel peripheral resistance and capacitance, and an upstream resistance. The aggregated properties of these Windkessel models represent the effects of smaller branch vessels not included in the main arterial tree. We implemented the transmission line model in MATLAB (Natick, Massachusetts, USA), with each simulation completed within seconds, and calculated the average geometric and Young’s modulus values. These averages were derived from the 121-segment Westerhof model. Specifically, we summed the lengths of the artery segments covered by our 36-segment model. Additionally, we determined the average values for the remaining parameters, which include radius and structural stiffness.

(a) Transmission Line schematic illustrating each vessel segment’s location and connection to other segments, representing an adult male. Numbers correspond to vessel names and data compiled in Table S1. Segments not labeled are reflected duplicates from the opposite side of the system. Ends of the transmission line are terminated by the Windkessel model, see Table S2. (b) The aorta is broken up into sub-segments. The schematic also illustrates the locations at which the system branches into further subtrees.
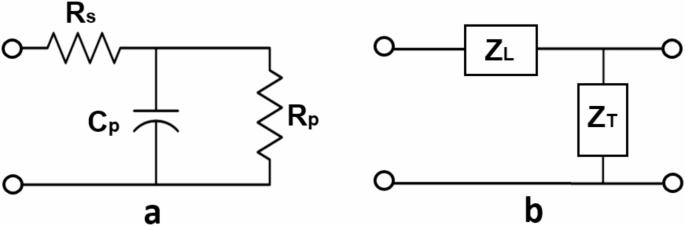
(a) Three-element Windkessel impedance model which terminates each of the ends of the arterial tree. Resistors and capacitor represent series resistance (Rs), parallel resistance (Rp), and parallel compliance (Cp). (b) Representation of a single vessel segment modeled as a circuit containing both longitudinal (ZL) and transverse impedance (ZT). Circles are drawn to represent the points of connection to the next segment in the transmission line.
Each segment of the tree, representing the blood-arterial wall interactions, is represented by a linear circuit of complex impedances composed of a series or longitudinal impedance, axial pressure gradient over flow, and a parallel or transverse impedance, pressure over axial flow gradient20,25. Figure 2b shows a single unit of the transmission line representation of a vessel.
The longitudinal impendence ((:{Z}_{L})), defined by blood properties, and the transverse impedance ((:{Z}_{T})) from the arterial wall properties per unit length of the vessel are defined as29:
where R and L are the series resistance and inductance, respectively, C is the parallel capacitance, and (:omega:) is the angular frequency (Fig. 2b). The R corresponds to the resistance to blood flow in the vessel related to blood viscosity ((:mu:)) and governed by Poiseuille’s law20,29:
where r is the inner radius of the vessel. A discrete approximation of flow in a cylindrical tube provides a relationship between L, blood density ((:rho:)) and r, while C is related to the modulus of the arterial wall (:E)20,29:
where h is the thickness of the vessel wall and Eis the Young’s modulus of the arterial wall. The transverse impedance of the arterial wall includes both elastic and viscous components as30,31,32:
Here, (:{mu:}_{w}) is the wall viscosity. The viscoelastic properties of the arterial wall are determined by angle (:varphi:), the phase between pressure and wall displacement20:
Angle (:varphi:) is usually frequency dependent and can be defied as
where (:{varphi:}_{0})is a viscoelastic phase constant20,32. In order to account for the differences in viscoelasticity between elastic and muscular arteries, we have chosen to represent the aorta with one third the viscoelastic phase constant (:{varphi:}_{0})as compared to the elastic branch vessels32.
The characteristic impedance ((:{Z}_{0})), propagation coefficient ((:gamma:)), and reflection coefficient ((:{Gamma:})) of a vessel segment are determined by the vessel’s transverse and longitudinal impedances, (:{Z}_{T}) and (:{Z}_{L}), as well as its load impedance ((:{Z}_{Load}))33,34, respectively, as the following:
where (:{Z}_{Load}:)is the termination impedance at the end of the transmission line of a given segment, or simply the impedance to the distal end in Fig. 2b. Finally, the input impedance of the vessel of length l, can be calculated using Eqs. 9–1134.
To calculate the total input impedance of the tree, starting from the end, the input impedance of a segment becomes the load impedance as the transmission line iterates from the end of the line towards the heart34. When two segments meet at a bifurcation, the impedances of the segments are added in parallel35. Hence, the total input impedance of the system (:({Z}_{iT})) can be calculated. The time domain representation of BPW can then be computed as:
where (:Q) is the Fourier transform of the flow waveform arriving from the heart and (:{mathcal{F}}^{-1})denote the inverse Fourier transform. A physiological aortic flow waveform36 was used here to generate BPWs from the model.
Harmonic distortion (HD)
The computed BPW is used to derive HD and AI. The properties of the arterial model are used to compute aortic PWV. HD is determined using BPW analysis in the frequency domain19, as:
where (:{{|A}_{k}|}^{2})are the spectral coefficients of a single BPW in the frequency domain multiplied by their complex conjugates. Thus, HD is essentially the ratio of energy above the fundamental frequency to that at the fundamental frequency of the waveform19. (:{A}_{1}) represents the spectral coefficient at the fundamental frequency. Fourier coefficients higher than the 20th were found to be negligible since they did not significantly contribute to the HD value. Therefore, k is limited to the range between 2 and 20. For an ideal sinusoidal wave, the HD value is 0. Changes to our model which manifest as changes in BPW shape should be reflected in HD.
Augmentation index (AI)
As previously discussed, AI is another index that measures relative wave reflections11. It is defined by (Fig. 3):
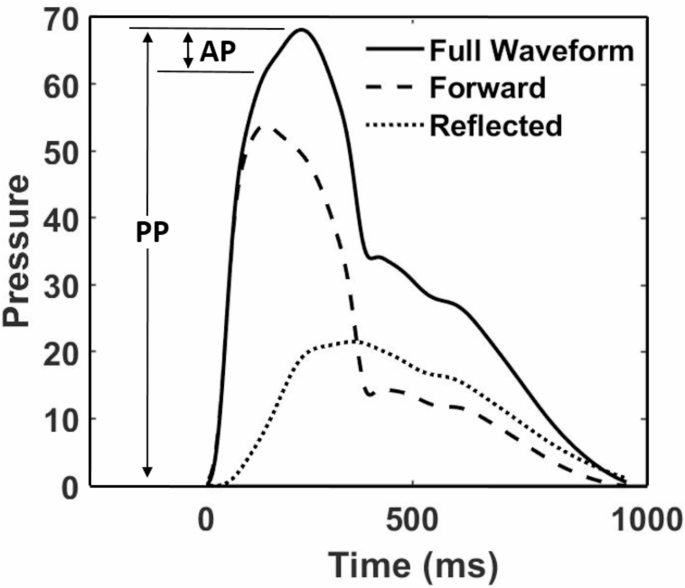
A generated BPW illustrating the separation for forward and reflected waves.
where PP is the pulse pressure, evaluated as the difference between systolic peak and diastolic trough, and AP is augmentation pressure, which is the difference in pressure between the peak of the aggregate waveform and the systolic inflection point that represents return of the reflected wave to the central aorta (Fig. 3). To locate this inflection point, the time point was determined at which the second derivative of the waveform equals zero.
Pulse wave velocity
Our model also allows the calculation of PWV using the arterial path from carotid to femoral arteries, which is commonly used in clinical setting for the calculation of PWV16,17,37. First, phase velocity in a single segment is calculated as:
Then the time that BPW spends in each segment along the carotid-femoral path is calculated as:
Next, PWV across the carotid-femoral path is calculated as the ratio of the sum of the segment lengths and the sum of the corresponding times. The carotid time and distance were subtracted from the parallel aortic time and distance38.
Sensitivity analysis
From Eqs. 3–5 and 12, we have identified six parameters and determined their influence on BPW: 4 vessel parameters (Eh, ϕ0, l, r) and 2 blood parameters (ρ and µ) (Table 1). Eh represents Young’s modulus x wall thickness, which is referred to as structural stiffness39. In order to assess the effects of these parameters on BPW morphology and indexes, using the parameter values reported by Westerhof et al. and Stergiopulos et al. as baseline values6,25,26, we varied each individual parameter between 25% and 175% of the baseline value, while all other parameters were held constant. The BPWs produced were plotted in order to assess qualitative changes in key waveform features. The corresponding HD, AI, and PWV were also recorded, and the percent change from the baseline index was plotted.
Randomly generated arterial trees
In an effort to mimic cardiovascular variabilities within a clinical group, arterial trees (N = 1000) were uniformly distributed using parameters of artery dimensions, and the wall and blood properties in the physiological range, see Table 1 for ascending aorta (Table 1). HD, AI and PWV were determined for every generated BPW. To eliminate BPWs with combinations of parameter values that may not be physiologically possible, we incorporated minimum and maximum bounds based on the published data from Mitchell et al. 201045. The foregoing study examined adults between 19 and 90 years of age, with AI and carotid-femoral PWV recorded for each 10- year age group45. By plotting AI and PWV data points for male participants, we created a permissible range of AI values given a measured PWV value within a 95% confidence interval45. This filter allowed us to filter BPWs representing an arterial tree which would produce index values beyond the physiologically observed range. The random generation of trees was run until N = 1000 permissible trees were achieved.
Statistical analysis
For the 1000 randomly generated arterial trees, partial correlation tests were performed that assessed the three indexes (HD, AI and PWV) against Eh while controlling for all other confounding factors. p < 0.05 is considered to be statistically significant.
Results
An aortic flow waveform was randomly selected from a normotensive group of adults used in a previous study of hypertensive versus normotensive groups36. This waveform (Fig. 4a) was used in combination with the parameters of the Westerhof transmission line model6 to produce BPWs (Fig. 4b). The corresponding input impedances are also plotted to illustrate that the modeled arterial tree produced impendence spectra that are comparable to those of a real human vascular tree in both magnitude and phase (Fig. 4c and d). The first important characteristic feature to note is the large impedance magnitude at zero frequency representing the total fluid flow resistance of the transmission line. The impedance magnitude then decreases rapidly with increasing frequency due to the decreasing magnitude of (:{Z}_{T}). The key feature of the impedance phase is an initial sharp dip followed by a rise and oscillations around zero.
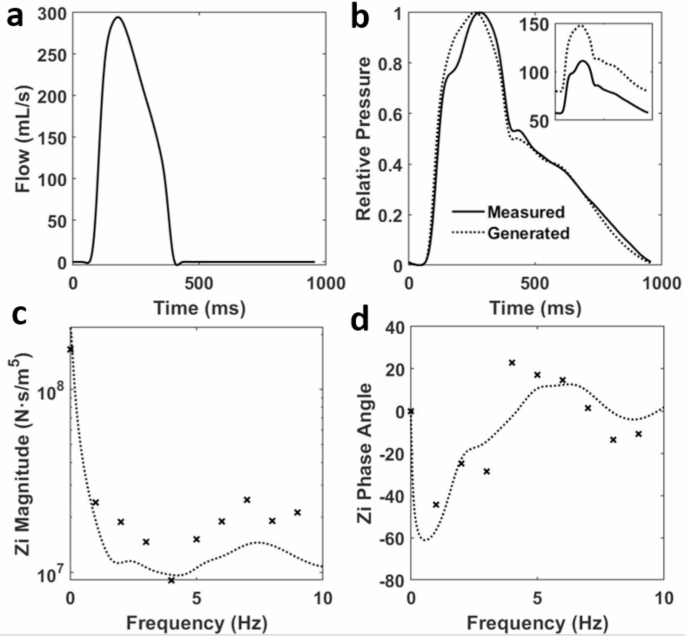
(a) An adult aortic flow waveform measured over 0.98 s36. (b) The corresponding BPW36 is plotted along with a generated BPW from the transmission line model on a relative pressure scale. The subplot shows the true pressures, in mmHg, and pulse pressures of the waveforms. The corresponding input (c) impedance magnitude and (d) phase are plotted with the generated impedance from the transmission line model and the measured value from Mitchell et al. represented by dotted lines and symbols, respectively.
The baseline arterial tree was modified for each independent parameter from 25 to 175% as described in the Methods. The three geometric parameters resulted in the most significant changes to BPW shape (Fig. 5). The remaining three parameters, viscoelastic phase constant in Eq. 8, blood density and blood viscosity, did not show a percent change in any of our cardiovascular indexes (HD, AI, PWV) greater than 20% (Fig. S2). The exception being blood density, the value of which does not vary as widely as the sensitivity analysis assessed (Table 1). It is for these reasons that these parameters were deemed as negligible to the changes in cardiovascular index (Fig. S1).
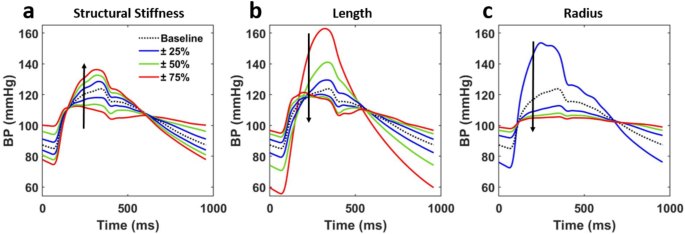
Morphology evolution of the BPW when controlling for all vessel and blood parameters but one: (a) structural stiffness, (b) length, (c) radius. Parameters of interest are incrementally scaled between 25% and 175% of the baseline value. Arrows show the direction of increasing the parameters.
The BPWs change in shape when model parameters are modified from their baseline values. However, each parameter has a differing effect on both the magnitude of change as well as the waveform features in question. For example, increasing vessel radius has the largest effect on blood pressure magnitudes while compared to increasing structural stiffness. We can also observe changing reflected wave time with respect to the forward wave, most prominently in increasing vessel length which results in earlier reflected peak arrivals.
At each of the seven values for the parameters shown in Fig. 5, cardiovascular indexes were also recorded and plotted (Fig. 6). The sensitivity variable, α, is a scaler value used to increase or decrease the identified parameters from their baseline values. The greatest percent change in these indexes from the baseline was observed when the geometric parameters were varied. These three parameters change by an order of approximately 400% from the baseline value and opposite ends for their ranges which demonstrates a strong sensitivity for both HD and AI calculations. HD experiences the greatest change from the baseline by modulating structural stiffness, while AI experiences the greatest change by vessel radius. PWV, by comparison to the other two indexes, is significantly less sensitive to all three parameters.
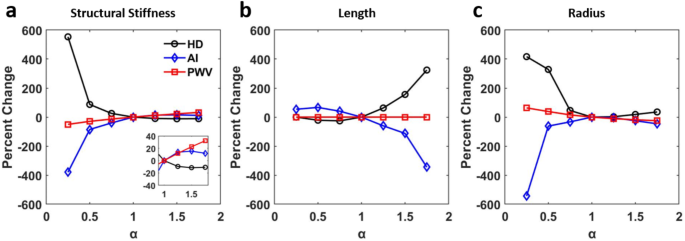
Index evolution corresponding to the changes made in Fig. 5. (a) structural stiffness, (c) length, (d) radius.
Random values within the physiological ranges were assigned to the six vessel and blood parameters and the resulting index values computed from the corresponding BPWs are plotted (Fig. 7). We observed a strong relationship to varied vessel length for both HD and AI. Taking the data set of parameters and indexes from the randomly generated arterial trees, a partial correlation test was performed controlling for all parameters (vessel length, radius, viscoelastic phase constant, blood density, blood viscosity, as well as systolic blood pressure) but the product of modulus and thickness in order to assess sensitivity of each index to structural stiffness and each other (Table 2). All indexes showed a strong correlation with Eh. Using the inflection point as a threshold (Fig. 7a) the data was further divided into low and high stiffness regimes and the partial correlation test was repeated (Table 3). The first column in each table, representing the three indexes’ correlation coefficients with Eh, demonstrates mostly strong correlations with structural stiffness. The notable exception being the stiffness sub-group greater than the inflection point where AI shows a weak correlation with Eh. Furthermore, while in the low stiffness regime, HD’s correlation with Eh is only marginally higher than that of AI, HD’s correlation is significantly higher in the high stiffness regime.
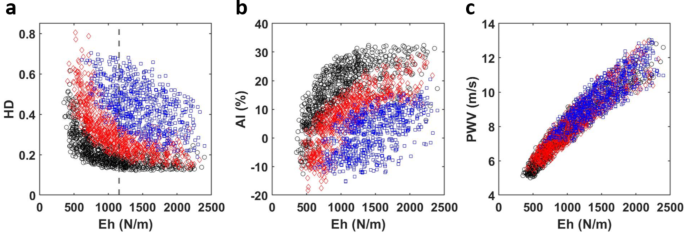
HD, AI and PWV values from randomly generated arterial trees (N = 1000) as a function of structural stiffness. Data is further visualized by scaled length. The shortest third of the data is colored black, the middle third is colored red, and the longest third is colored blue. (a) harmonic distortion (HD), (b) augmentation index (AI), and (c) pulse wave velocity (PWV). The vertical dashed line at Eh = 1158 N/m, indicated in (a), represents the median structural stiffness.
Discussion
In this study, we constructed a transmission line model to produce BPWs that depend on the variable mechanical impedance of each major vessel in the human vasculature. Our model was able to simulate BPWs in combination with cardiovascular indices. The results of our study show promise for implementing such analysis in a clinical setting, using BPW and flow waveforms collected noninvasively. Using the model, we quantified the effects of model parameters on changes in the BPW time domain morphology as well as the corresponding frequency domain features. The index HD, which we introduced and studied recently using a mouse model of aging and metabolic disease19, showed promises as a measure of arterial stiffness with potential clinical applications. The model was used to study the relations of two additional cardiovascular risk indexes, AI, and PWV, to different vessel parameters. All indexes were found to be sensitive to structural stiffness, Eh. However, HD, an index that measures the relative distortion of a waveform with respect to a perfect sinusoid, provides a more comprehensive assessment of BPW morphology than AI by including contributions of both magnitude and arrival time of the reflected wave. Therefore, within the limitations of the transmission line model, this study reinforces HD as a useful index which is easy to implement and reliably correlates with cardiovascular risk via arterial structural stiffness.
The framework of transmission line models of cardiovascular systems has been developed decades ago20,21,22,23,24,25,26,27, and were used to study AI and PWV sensitivity46,47,48. As a means of model validation, we note that our transmission line model was implemented based on validated data published by Westerhof et al. and Stergiopulos et al.6,25. In addition, our sensitivity analysis using random tree structures was based on acceptable wave shape index ranges derived from human experimental data. Specifically, to eliminate BPWs with combinations of parameter values that may not be physiologically possible, a tree structure was accepted only if the corresponding AI and PWV values fell within established minimum and maximum bounds based on the published data from Mitchell et al.45.
Our study shows that AI is more sensitive to arterial stiffness than geometric parameters (Fig. 6a), which is consistent with previous findings46. It was further revealed that increased viscoelasticity of the arterial wall promotes a stronger correlation between heart rate and PWV47,48. We also found viscoelasticity to be essential for the transmission line model to produce appropriate BPWs (not shown), although we note that viscoelasticity had little effects on the cardiovascular risk indexes (Fig S2a). In our study, we further examined both AI and PWV indexes as well as HD’s relative sensitivity to parameters that influence the characteristic impedance of the transmission line model.
Our results demonstrated that HD is inversely related to stiffness through Eh (Fig. 6a), when controlling for all other parameters, both geometric and those relating to material properties listed in Table 2. In clinical practice, structural stiffness is often used over the elastic modulus39,49. The determination of the appropriate h required for calculating a specific E often is challenging. Therefore, Eh is used to represent the average contribution of different components within the arterial wall. Furthermore, structural stiffness is critical in understanding hemodynamics due to changes in arterial wall thickness via extracellular matrix remodeling playing a key role in vascular diseases such as hypertension49. Indeed, it is thought that structural stiffness may have a role in a positive feedback loop in conjunction with hypertension as the arterial wall remodels it may promote further hypertensive effects leading to more remodeling50. Thus, structural stiffness as defined by Eh appears to play an essential role in cardiovascular health. The Eh values used in this study (Table 1) are consistent with previously observed clinical range of aortic Eh ranging from 100 to 1750 N/m40, and with the values reported by Mitchell et al. (~ 2400 ± 900 N/m in a normotensive male group)36. Increasing Eh has a dramatic effect on the evolution of BPW morphology which shows not only an increase in peak pressure as the forward and reflected wavelets further overlap (Fig. 5a). Importantly, the movement of this reflected wave promotes the aggregate BPW to transition from a square wave-like morphology to a more sinusoidal shape that results in a reduced HD (Fig. 6a). Alongside increasing systolic pressure, decreasing diastolic pressure is also observed which generates larger PP values. This is likely related to the decoupled changes in parameters in the model that will lead to increased values of impedance at zero frequency.
We also noted HD’s strong sensitivity to the remaining geometric vessel parameters, such as vessel length and radius, a trend that is shared by AI but in an opposite direction (Fig. 6). Most notably vessel length, which could be thought of as analogous to human height, has the opposing effect on HD and AI. This is due to altering the reflected wave arrival and therefore waveform morphology (Figs. 5b and 6b). HD and AI’s strong sensitivity to changes in vessel radius (Fig. 6c) can be understood by the contribution of radius to the mechanical impedance, because both the longitudinal and transverse impedance decrease strongly with increasing radius (Eqs. 3–5). Indeed, increasing radius similarly changes the waveform shape as decreasing Eh (Fig. 5a vs. 5c). Physiologically, low radius values are rarely reached (Table 1). AI’s sensitivity to vessel geometry has been previously observed46. From a clinical perspective, the consistent trend of AI exhibiting notably higher values in women can be interpreted as a consequence of AI tending to be elevated in individuals of shorter stature, which is associated with the presence of shorter blood vessels7,51. As a result, it’s logical to speculate that HD, which shares many similarities with AI (Fig. 6), would also reflect this characteristic. However, even when studies control height, they continue to report elevated AI values in women11,52. This persistent discrepancy is likely attributed to the presence of smaller muscular arteries in females53,54. Further clinical study, perhaps utilizing HD alongside AI, is needed to better understand this phenomenon.
As expected, PWV remains the benchmark for accurate assessments of arterial stiffness as shown in our results the strong correlation between PWV and Eh (Tables 2 and 3). A fundamentally different measure with respect to the other two indexes, PWV is a highly reliable measure of arterial stiffness that correlates strongly with various cardiovascular conditions such as aging, diabetes, and hypertension16,17. Previously reported averages of PWV in normotensive adult males (8.2–8.7 m/s ± 2 m/s)7,36, fall within the range of our generated values, 5–14 m/s (Fig. 7c). Though clinical PWV can be much higher than the maximum value generated in our study, reaching over 20 m/s for people with cardiovascular disease, the typical normotensive range of PWV (5–15 m/s)7 aligns with our reported values. Notably, we observe that Eh plays a dominating role in determining PWV values (Fig. 7c). Though stature could play a role in PWV55, it is more likely that our assumption of vessel parameters scaling together promotes the PWV behavior observed in Fig. 7c.
Our study created physiologically comparable arterial trees to mimic interindividual variability of the BPW as well as PWV seen in a clinical group. This is useful in order to study the statistical relationships in a population of non-identical arterial trees and further differentiate the three identified cardiovascular indexes. From a clinical standpoint, the similarities between HD and AI are further reflected by their correlation values with Eh (Table 2). Correlation values also change within the stiffness sub-groups (Table 3). HD shows further promise as a stiffness index displaying high correlation values for both stiffness sub-groups. In fact, HD shows superior correlation with Eh over AI in the stiffest sub-group and maintaining a similar correlation with AI in the less stiff sub-group. AI’s strong correlation with Eh values less than the Eh median (Fig. 7) can be explained by AI being a more successful stiffness index in individuals younger than 60 years of age7,49. In short, the results of the partial correlation test in the high stiffness sub-group imply that HD is potentially a stronger predictor of arterial stiffness in individuals with arterial stiffening. This high stiffness regime can be understood as representing the individuals older than 60 years of age, which AI fails to accurately assess, thereby meeting an important limitation of AI as a stiffness index. Several studies have compared AI to PWV, with contradictory findings in the correlation of the two indexes49,56,57,58. In our study, we found AI to correlate more poorly with PWV as compared to HD (Table 3). As we have discussed, HD can be sensitive to reflected wave arrival timing, while AI is not. Furthermore, true physiological waveform has noise, or waves with significant overlap, which at times has made the location of inflection points difficult to locate in AI analysis12,13. HD analysis, however, can be successfully applied to any completely isolated BPW. While HD presents certain advantages over AI, it cannot be stated that HD is a better index in all situations.
HD has proven to be a promising index that warrants further study. HD is an index that characterizes a waveform’s deviation for a perfect sinusoid (HD = 0) and therefore is not significantly influenced by limiting factors for existing indices beyond morphology, such as BP magnitude or pulse pressure. HD is also a robust measure that can be implemented on any waveform, regardless of the region it was collected from. However, further studies are needed to understand the regional variation of HD along the arterial tree considering regional dependence of vascular remodeling59.
Limitations
Due to the nature of the transmission line model, there are several assumptions to consider. First, the model assumed that all vessels scaled together, and did not fully account for the distinct effects of aging on arterial properties, such as the relatively small changes in the Young’s modulus of muscular arteries compared to elastic arteries in aged population45. Future studies that allow for discontinuities between arterial segments, such as the joining of an elastic with a muscular artery, are needed. However, the generated arterial trees using our model resulted in PWV values lower than this older age group45. Therefore, arterial trees with vessel parameters analogous to an older population are not represented in this study. Additionally, the mechanical properties of the arterial wall were assumed to be linearly viscoelastic, while nonlinear anisotropic wall mechanics have been broadly reported19,60. Transmission line approaches offer a simple calculation of the input impedance of entire tree in the frequency domain. Although nonlinearity can be added in the time domain to include the effects of varying wall properties during the cardiac cycle61, this comes at a great computational cost. Additionally, the transmission line approach offers a simpler mechanistic view of how wall mechanics and blood properties determine key physiological parameters such as input impedance, characteristic impedance and propagation constant. Further work is thus required to reveal how a more sophisticated representation of nonlinearity effects may influence various functional indexes. The input blood flow waveform was held constant in the model; however, HD is sensitive to the flow input. Therefore, flow morphology changes need be taken into account by considering an individual’s flow pattern over a length of time62. For our purposes, we chose to control heart rate and focus on material properties and geometry. Nevertheless, we acknowledge a more comprehensive assessment would include variable flow inputs. Similarly, beat-to-beat blood pressure variability likely produce intra-subject variability of all three indexes. Blood is a non-Newtonian viscous fluid, but water properties are often used in cardiovascular studies, both computational and experimental, as an approximation to blood62. The effect of perivascular pressure due to surrounding tissues on arterial properties19,63was neglected in the current study. Wall tapering along the length of longer arteries was also neglected. Thus, input impedance was calculated by adding discrete segments with characteristic impedance that jumped at bifurcations. The ends of the transmission line model were terminated with 3-element Windkessels. However, studies have shown that the smaller distal vessels modeled by the Windkessel terminations have negligible contribution to the input impedance[,34. Furthermore, the electrical circuit modeling of the mechanical input impedance of the vasculature (Fig. 2) does not allow for turbulent blood flow. Future studies considering aging and diseases may need improvement of the model by considering different arrangement and number of circuits features26,29.
Conclusion
The BPW is an often-overlooked measurement due to the intricate interactions of the confounding vessel and blood flow parameters. In this study, a transmission line model of the mechanical impedance of the arterial tree was implemented to study the effect of vessel and blood flow parameters on BPWs. Our results demonstrated that HD analysis of BPWs showed promises as an index to assess changes in arterial mechanical function. Beyond directly correlating with stiffness, HD also correlates well with AI and PWV when controlling for all other factors. Although HD meets some limitations similar to those of other cardiovascular risk indexes, the ease of accessibility and the reliability in calculation make HD a potentially useful index that in a clinical setting as a means to assess cardiovascular health.


Responses