Body mass index and menstrual irregularity in a prospective cohort study of smartphone application users

Introduction
Menstrual cycle characteristics are some of the most accessible indicators to assess female health. Regular menstruation is dependent on a functioning hypothalamic-pituitary-ovarian (HPO) axis1. Disruption of this HPO axis can lead to a wide spectrum of abnormalities in the menstrual cycle, such as irregular menstrual cycles, anovulation, and amenorrhea2. Hence, studies have utilized menstrual characteristics such as long or irregular cycles as indicators of reproductive health and infertility3,4. Given that infertility is becoming a leading gynecological problem said to affect about 1 in 6 worldwide (https://www.who.int/publications/i/item/978920068315), utilization of menstrual cycle characteristics may be imperative to provide appropriate preconception care to individuals in need.
Those in the extremities of the body mass index (BMI) spectrum are known to be at increased risk of menstrual irregularities5. High BMI/obesity, is commonly seen in individuals with a known history of infertility6, due to high adiposity leading to multiple endocrine alterations such as increased insulin resistance and increased levels of androgens, which can negatively affect ovulation7. For the lower end of BMI, the underweight, have also been reported to be at an increased risk of ovulatory infertility, although research has been limited to populations such as those with anorexia nervosa and female athletes8. Extremely low body fat composition, linked to chronic energy deficiency, results in multiple endocrine disturbances, including a lack of sufficient leptin levels, decreased kisspeptin expression in the hypothalamus, and sequentially, impairment of the HPO axis8.
Currently, the findings of BMI extremities and menstrual irregularities are inconsistent in reports using menstrual tracking applications. One study has concluded that the median menstrual cycle length was not remarkably different with increasing BMI categories9. Another reported that the prevalence of infrequent menses increased in obese individuals, but no differences for the underweight category (underweight comprising 2% of the study cohort), and no significant difference between irregular menses and BMI categories10. Both studies have opted to use categorical BMI for analysis, and with limited data on the underweight. This approach may have been insufficient to analyze the non-linear relationship between BMI and menstrual irregularity that is expected.
Menstrual tracking applications have proven to be a reliable tool for the collection of objective menstrual cycle data11. Notably, Bull, et al. have reported if cycles are ovulatory, the association with BMI in the range of 18-35 exhibits a plateau relationship with variations in cycle length12. The non-linear relationship between BMI and menstrual irregularity has been visualized using self-assessment of “menstrual irregularity”13,14 and so with appropriate statistical measures this association may also be seen with data from menstrual tracking applications and cycle length logs. Furthermore, the proportions of ovulatory cycles across continuous BMI have not been reported yet. If it follows a similar pattern to menstrual irregularity, together with Bull’s findings, the relationship between cycle irregularity and ovulation could be explored further. Additionally, since the relationship between BMI and adiposity differs significantly across race/ethnic groups15, and the majority of studies have been conducted where the predominant race is Caucasian9,10,11,12,13,14, data from other demographics such as the Asian population could be explored further.
Hence, the primary objective of this study is to investigate the relationship between menstrual cycle characteristics and BMI both categorical and continuously, with sufficient representation of both the underweight and overweight. To achieve this objective, we used a large dataset retrieved from a Japanese nationwide menstrual tracking application. Additionally, we aimed to include cycles in our analysis that exhibit irregular patterns, including possibly anovulatory cycles, to examine the relationship between BMI and menstrual irregularity. Finally, by examining basal body temperature, we can further assess the ovulatory state of cycles and explore their association with BMI.
Results
Characteristics of participants
Figure 1 shows the inclusion and exclusion criteria. Daily logged menstrual cycle data and in-app questionnaire responses were collected from users who agreed to participate in the study. Among those who agreed to participate and completed Wave 1 and Wave 2 questionnaires (n = 10,465), each participant, on average, logged 21 cycles. Subjects were excluded if they logged fewer than 3 cycles (n = 37). Natural logarithms of menstrual cycle lengths that were greater than +4 standard deviation (SD) (ranging from 110 to 549 days) or less than −4SD from natural logarithms (ranging from 1 to 7 days) of average of all cycle lengths were excluded to eliminate outliers. (cycles n = 1695). Participants were excluded if BMI < 15 (n = 7/10,465, 0.1%), or BMI > 35 (n = 105, 1.0%). Those who answered that they were pregnant (n = 190, 1.8%), using IUD/IUS (n = 40, 0.4%), on hormonal contraceptives (n = 497, 4.7%), or currently under infertility treatment (n = 390, 3.7%) were excluded. This resulted in 8745 individuals and 191,426 cycles. Basal body temperature (BBT) data were also obtained from 3221 participants and 15,883 menstrual cycles.

A flow diagram illustrating the inclusion and exclusion criteria for study participants. The initial dataset included 10,465 individuals, of which 1720 were excluded. The analysis included 8745 participants, out of which 3221 were included in the basal body temperature analysis.
The characteristics of the study participants are shown in Table 1. Overall, the individuals were in their late 20 s and early 30 s, unmarried, non-smokers, without excessive alcohol intake (daily average <2 units), employed (without night shift duties), and had an education level beyond high school. Participants’ BMI was distributed as follows: 13.8% (n = 1209/8745) were underweight (BMI 15–18.4), 59.3% (n = 5185) had BMI in the normal range (BMI 18.5–22.9), 12.9% (n = 1124) were overweight and 14.0% (n = 1227) were obese (BMI 23–35). The mean (SE) of all CL was 31.52 (4.95) days, and the mean(SE) of SD of CL was 1.33(1.45) days. Of all participants, a total of 3.99% (n = 349) had AMB, and 7.03% (n = 615) had IMB.
Associations between BMI and cycle length
The average and SD of CL across continuous BMI are described in Figs. 2 and 3, respectively. Figures 2 and 3 are restricted cubic spline models of BMI and the average and SD of CL adjusted for baseline characteristics. Both figures show a J-shaped curve. Individuals with BMI 20 had the lowest average of CL [30.55 (95% CI, 30.28–30.82) days]. Those with BMI 16 had a greater average CL [+1.03 (95% CI, 1.01–1.05) days], and those with BMI 30 also had a greater average CL [+1.06 (95% CI, 1.05–1.07) days]. Individuals with BMI 20 also had the lowest SD of CL [0.76 (95% CI, 0.72–0.80 days]. Those with BMI 16 had a greater SD CL [+1.09 (95% CI, 1.04–1.16) days], and those with BMI 30 also had a greater SD CL [+1.38 (95% CI, 1.27–1.49) days]. Regression analysis in comparison to those with BMI 20 is shown in Supplementary Fig. 1 (average of CL) and Supplementary Fig. 2 (SD of CL). For the average of CL, those with BMI < 18 and BMI > 21 showed an increase compared to those with BMI 20. For the SD of CL, those with BMI < 19 and BMI > 22 showed an increase compared to those with BMI 20.
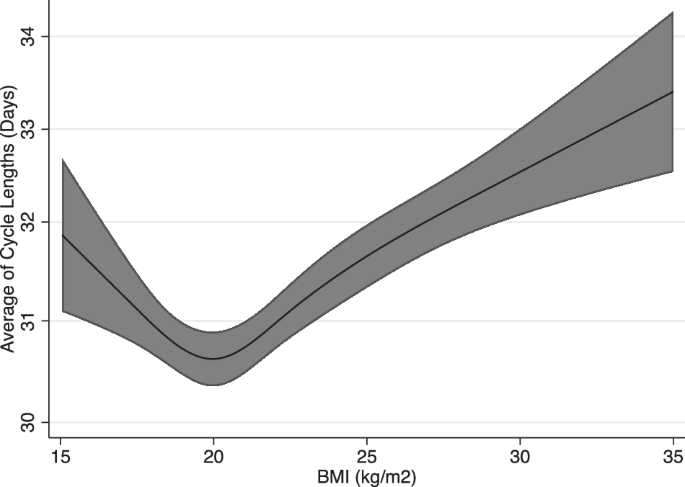
Spline regression model (line) and 95% confidence intervals (shaded area) are shown. Cubic spline regression models used; adjustments for age, co-residing with child, marital status, pregnancy desire, exercise, smoking, employment status, and past medical history (Polycystic Ovary Syndrome, or Diabetes Mellitus).
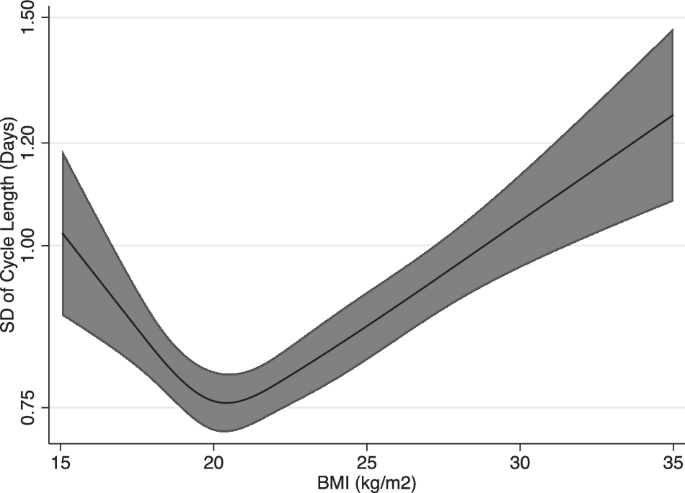
Spline regression model (line) and 95% confidence interval (shaded area) are shown. Cubic spline regression models used; adjustments for age, co-residing with child, marital status, pregnancy desire, exercise, smoking, employment status, and past medical history (Polycystic Ovary Syndrome, or Diabetes Mellitus).
Associations between BMI and menstrual irregularities
The odds ratio (OR) of menstrual irregularities across different BMI categories is described in Table 2. Individuals in the overweight and obese categories had higher risks of IMB compared to those with normal BMI. ([OR 1.56, 95% CI 1.11, 2.18], [OR 2.63, 95% CI 1.97, 3.50], respectively. Individuals in the underweight and obese categories had higher risks of AMB compared to those with normal BMI. ([OR 1.78, 95% CI 1.17, 2.70], [OR 1.94, 95% CI 1.33, 2.83], respectively). Associations remained unchanged after analysis limited to those with complete data.
Figure 4 shows the relationship between BMI and the proportion of individuals with menstrual irregularity. Both AMB (Fig. 4A) and IMB (Fig. 4B) in relation to BMI showed a J-shaped curve. Therefore, a decrease and increase in BMI lead to an increasing prevalence of AMB and IMB. The model calculating for OR of AMB and IMB in comparison to those with BMI 20 is shown in Supplementary Fig. 3. A higher risk of AMB compared to individuals with BMI 20 was found for those with BMI 19 (OR 1.17, 95% CI, 1.00–1.31) and below, and BMI 26 (OR1.53, 95% CI, 1.00–2.34) and above. A higher risk of IMB compared to individuals with BMI 20 was found for those with BMI 18 (OR 1.32, 95% CI 1.04, 1.69) and below, and BMI 21(OR 1.08, 95% CI, 1.01–1.17) and above.
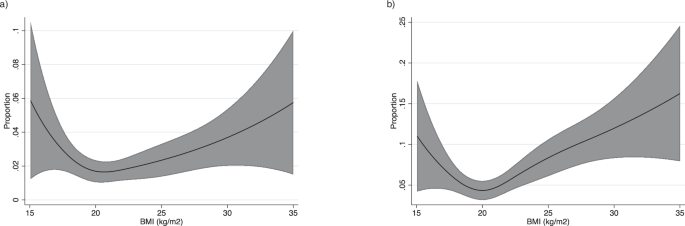
a Absent menstrual bleeding. Spline regression model (line) and 95% confidence intervals (shaded area) are shown. Cubic spline regression models used; adjustments for age, co-residing with child, marital status, pregnancy desire, exercise, smoking, employment status, and past medical history (Polycystic Ovary Syndrome, or Diabetes Mellitus). b Infrequent menstrual bleeding. Spline regression model (line) and 95% confidence intervals (shaded area) are shown. Cubic spline regression models used; adjustments for age, co-residing with child, marital status, pregnancy desire, exercise, smoking, employment status, and past medical history (Polycystic Ovary Syndrome, or Diabetes Mellitus).
Association between BMI and biphasic cycles
Figure 5 is a restricted cubic spline model of BMI and proportions of biphasic cycles. The relationship showed an inverted J-shaped curve with a peak at BMI 20. The proportion of biphasic cycles decreases with both higher and lower BMI values. Individuals with BMI 22 (OR −0.10, 95% CI, −0.16–−0.03) and above had a lower OR of biphasic cycles (Supplementary Fig. 4).
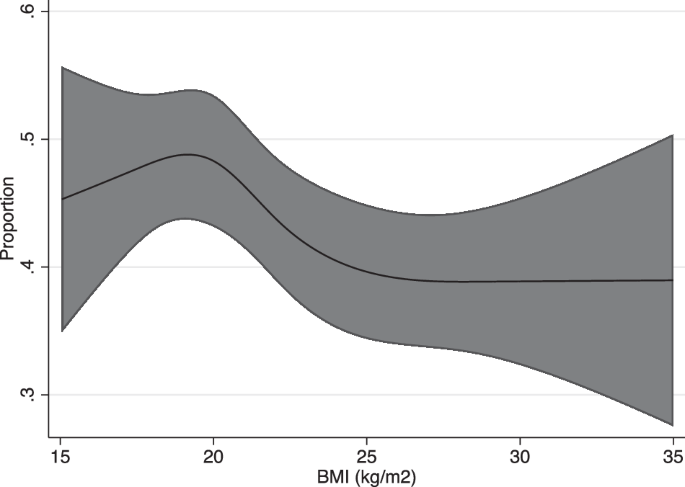
Poisson regression model (line) and 95% confidence intervals (shaded area) are shown. Cubic spline regression models used; adjustments for age, co-residing with child, marital status, pregnancy desire, exercise, smoking, employment status, and past medical history (Polycystic Ovary Syndrome, or Diabetes Mellitus).
Discussion
This study with 8745 participants and 191,426 menstrual cycles is, to the best of our knowledge, the first to utilize big data to show the nonlinear relationship between BMI and menstrual cycle characteristics. The average and SD of CL, and the proportion of menstrual irregularities (AMB and IMB), all showed a J-shaped curve in relation to BMI. Those with both high and low BMI had an increased risk of longer, irregular menstrual cycles. For the proportion of biphasic cycles, an inverted J-shaped curve was found. This showed that both high and low BMI had an increased risk of nonovulatory cycles. Therefore, populations with normal BMI (especially those at BMI 20) demonstrated the least risk of irregular, nonovulatory menstrual cycles.
For ovulatory cycles, previous research using phone app data by Bull et al. reported mean cycle length to be between 29.1 and 29.8 days for each category of BMI12. In addition, they found minimal variation in ovulatory cycle length for those with BMI 18–3513. Therefore, the cycle length and variation of cycle lengths limited to ovulatory cycles seem to be independent of BMI. With our analysis not limited to ovulatory cycles, a greater fluctuation of cycle length and variation was seen in relation to continuous BMI. This may be attributed to differences in the proportions of ovulatory cycles across different levels of BMI.
For analysis not limited to ovulatory cycles, prior phone app data studies have yielded varying results for the relationship between BMI and cycle irregularity, although a simple comparison is difficult since the definition of outcomes differs with each study. One study concluded that median cycle lengths were not remarkably different across BMI categories9. However, although not significant, they have reported a tendency of higher cycle variation for individuals with lower BMI, and higher median cycle length for individuals with a BMI over 359. The usage of median as an indicator for cycle length and categorical BMI may have led to underestimations. Nevertheless, our findings align with this finding and further demonstrate that both low and high BMI can lead to increased variability and elongation of the menstrual cycle.
Our findings also show an elevated risk of AMB and IMB for both lower and higher BMI than normal. Specifically, the underweight and overweight/obese subgroup had an increased risk of AMB, and the overweight/obese also had an increased risk of IMB. In the Apple Women’s Health Study, those with BMI categories class 1,2,3 obesity had a higher prevalence of infrequent menses compared with those with healthy BMI, and those with BMI over 40 had a higher prevalence of AUB compared with those with healthy BMI10. Their cohort had a mean BMI of 29.3, and only 2% of those included in the AUB analysis were underweight. This possibly might have led to underestimation for the underweight category. Our study adds to this finding to show the nonlinear relationship, with both over and underweight to be at increased risk in a dose-response manner.
Previous studies utilizing questionnaire responses have reported significant increases in menstrual abnormalities classified as overweight and obese women4,13,14,16,17,18. While significant findings for the underweight have been limited, a few have reported J or U-shaped associations between continuous measurements of BMI and incidences of self-assessed menstrual abnormalities13,14. Other observational studies have also described increased menstrual abnormalities in the obese populations16,17,18 and the underweight, limited to those with anorexia nervosa8 and female athletes19. Using quantitative data on the menstrual cycle, our study demonstrates that cycle lengths differ in a dose-response manner outside the normal BMI range and trough at a BMI of 20. Together with these previous studies, our finding suggests that the association between BMI and menstrual cycle characteristics can be extended to encompass the entire BMI range rather than strictly looking at the extremities of the BMI population.
Furthermore, our analysis is the first to our knowledge to reveal that basal body temperature is also affected by BMI, in which the proportion of biphasic cycles decreases in a dose-dependent manner with both an increase and decrease in BMI. With a higher proportion of biphasic cycles, cycles are more likely to be ovulatory with functioning corpus luteum, which is one of the key indicators of fertility20. Hence, a lower incidence of biphasic cycles is suggestive of increased anovulatory cycles, possibly leading to ovulatory infertility. Previous questionnaire studies have reported a “U-shaped” association between BMI and relative risk of ovulatory disorder infertility, and a “J-shaped” association between adolescent BMI and relative risk of ovulatory infertility in adulthood2,21. While these data were suggestive of the effect of overweight and underweight on ovulation, analysis using quantitative indicators has been lacking. In our study, the underweight and obese populations were shown to have fewer biphasic cycles compared to those with normal BMI, with a significance shown for the overweight/obese which may be suggestive of ovulatory dysfunction.
There are several limitations to this study. First, it is important to acknowledge the presence of selection bias, a common challenge in studies utilizing mobile phone applications as a tool for data collection. This may pose challenges in terms of generalizability. Additionally, the app employed in our study is widely used in Japan. This may be a limitation as our data may not be generalized to another race or ethnicity. However, it also provides a unique opportunity to perform analysis minimizing the major effects of genetic differences between races and overt socioeconomic differences. This is mainly due to Japan’s unique demographic, where more than 98% of the population is Japanese, with a high school enrollment rate exceeding 98% (https://gpseducation.oecd.org/CountryProfile?primaryCountry=JPN&treshold=10&topic=EO). It is also worth noting that previous menstrual tracking app studies have studied populations of predominantly Caucasians12 or app users from Europe/North America10, with limited data on the Asian population. This highlights the importance of our study in presenting data specific to this underrepresented demographic.
Secondly, measurement error can be an issue since this is a collection of self-recorded data. We have opted for the following methods to minimize potential measurement errors and improve data quality. For questionnaire responses, such as weight and height, we have limited the data to those with BMI 15–35 as values below or above are rare in the general population and may be erroneous input. For cycle measurements, we have limited the cycles to be included if they were within –4 to +4 standard deviations from the average of all CL to eliminate possible errors22. Also, the app has a key function of alerting the next estimated start date of menstruation using individually calculated averages of previously logged cycles. This can motivate individuals to go back and log in their actual menstrual cycle start date if the estimation seems inaccurate.
In conclusion, using real-world data from a menstrual tracking application, this study demonstrated the nonlinear association between BMI and menstrual cycle irregularities. Our findings revealed a distinct J-shaped pattern for the relationship between BMI and menstrual characteristics. Additionally, for the relationship between BMI and the proportions of biphasic cycles, an inverted J-shaped curve was shown. Individuals with normal BMI (especially individuals with BMI 20) were shown to have the most regularly occurring, biphasic menstrual cycles. Both higher and lower than normal BMI were shown to have a dose-response relationship with menstrual characteristics. The utilization of technology such as phone apps may be important in future management and providing appropriate preconception care to those with menstrual irregularity. Further research is warranted on to what extent changes in the BMI within individuals affect their menstrual cycle regularity and ovulation.
Methods
Study design
This prospective cohort study was conducted through a smartphone application LunaLuna, which is one of the most popular period tracking applications in Japan, produced by MTI Ltd. In the app, users can log their daily information, such as the start/end of the menstrual cycle, daily basal body temperature, menstrual flow, pain, mood, etc23. All current app users were notified of the research objective, outline, data collection, and method of participating in the study during the recruitment period of January 23rd through March 25th, 2020. From those who agreed to participate, menstrual cycle data was collected from January 2019 through March 2021. Users who agreed to participate in the study answered bi-monthly questionnaires in the app, to which their logged menstrual cycle data were linked. The questionnaires included a variety of questions such as lifestyle, employment status, education attainment, and health conditions.
Questionnaire responses were collected as follows: the first questionnaire (Wave 1) was from January 23rd through March 25th, 2020, followed by the second questionnaire (Wave 2) from May 14th, through June 14th, 2020. Participants who completed both Wave 1 and Wave 2 questionnaires were included in this study.
Study population
Among those who agreed to participate, participants were excluded if they had less than or equal to 2 cycle logs. To exclude outlying logged cycles, natural logarithms of menstrual cycle lengths that were greater than +4 standard deviation (SD) or less than −4SD from natural logarithms of the average of all cycle lengths were excluded, as this is a conventional cross-sectional approach to exclude outliers in large data studies22. Among the study participants, individuals were not included in the analysis if they had answered that they were pregnant, on birth control, or currently going under infertility treatment. Individuals with missing BMI or BMI outside the range of 15 through 35 were excluded.
Definition of outcomes and covariates
The main outcome variables were the average of cycle length (CL), the standard deviation (SD) of CL, the proportion of biphasic cycles, and the proportion of individuals with menstrual irregularities.
Cycle length was calculated from the start date of menstruation (when users log “menstruation started” in the app) and the day before the next start date. When users push the “menstruation started” button in the app, the app recognizes this date as day 1 of menstruation, and this step is sufficient for the app to recognize a new cycle, and no further action is needed. When the user pushes the “menstruation started” button again, the day before becomes the last day for the previous cycle. For each woman, the within-individual average of cycle length (CL) and standard deviation (SD) of CL were calculated.
Indicators of menstrual irregularities included absent menstrual bleeding (AMB) and infrequent menstrual bleeding (IMB). We defined participants as having AMB if any logged CL was greater than or equal to 90 days, and IMB if they had an average CL larger than or equal to 39 days and less than 90 days. Definitions were derived from the FIGO recommendations on terminologies and definitions for abnormal uterine bleeding24. Proportions of participants with menstrual irregularities and 95% confidence intervals (CIs) were calculated.
For analysis of basal body temperature (BBT), the follicular phase was defined as the first 10 days from the start of the menstrual cycle. The luteal phase was defined as 10 days counting to the day before the start date of the next menstruation. BBT logs were included in the analysis if 3 or more BBT were logged for each follicular and luteal phase. Also, logs were included if temperature ranged from 34.0 to 37.5 °C. The difference in the average of luteal phase BBT from the follicular phase (dBBT) was calculated. Participants were included if they had more than 3 cycles with dBBT. A cycle was considered biphasic if the dBBT was greater than 0.3 degrees25. The proportion of biphasic cycles was calculated for each individual.
BMI was calculated from self-reported height and weight, reported as kg/m2. Individuals with a BMI ranging from 15 to 35 were included in the study. BMI was categorized into three groups – underweight (15–18.4), normal (18.5–22.9), and overweight/obese (23–35). BMI was also categorized into five subgroups – underweight (15–18.4), normal (18.5–22.9), overweight (23–24.9), obese I (25–29.9), and obese II (30–35). Definitions were based on the International Obesity Task Force recommendation for the Asian subgroup (https://iris.who.int/handle/10665/206936).
Covariates were age, co-residing with child, marital status, pregnancy desire, exercise level, drinking status, work status, mental health status, education attainment, and past medical history. Age was determined from the responses to “Current Age” at Wave 1 of the questionnaire. Participants who selected “Child” to question “Select the family members who currently live with you” were classified as positive for covariate “Co-residing with child”. Due to limitations in collecting direct pregnancy or birth history data, this covariate was employed as a surrogate measure. For drinking status, usual alcohol intake was first classified into six categories: <1 day/month or less, 1–3 days/month, 1–2 days/week, 3–4 days/week, 5–6 days/week, and every day. Those who reported >1 day/month were also asked to report the usual amount and type of alcohol. Daily ethanol consumption was calculated by combining the units of alcohol per day and frequency per week. Units of alcohol were calculated as one unit per 8 g of ethanol. Heavy drinking was defined as drinking more than an average of 2 units/day (https://www.nhs.uk/live-well/alcohol-advice/calculating-alcohol-units/). To evaluate mental health status, subjects asked questions following the K6 questionnaire and were classified as depressive if scores were over 1026. Answers regarding education attainment were classified into above or under high school graduates.
Statistical analysis
All analyses were performed with STATA/SE version 16.1 (StataCorp LLC, College Station, Tx, USA). Natural logarithm of average and SD of CL were used for regression models. A restricted cubic spline model27 was used to assess the relationship between continuous measures of BMI and all outcomes, with linear regression used for continuous outcomes (CL, SD of CL), logistic regression used for binary outcomes (risk of AMB and IMB), and Poisson regression used for proportions (biphasic cycles). For all splines, four knots were placed at fixed and equally spaced percentiles (5%, 35%, 65%, 95%). BMI 20 was set as a reference point to calculate odds ratios (OR) and risk ratios (RR) in logistic and Poisson regression, respectively.
All regression analyses were adjusted for age, co-residing with child, marital status, pregnancy desire, exercise, smoking, employment status, past medical history of Polycystic Ovary Syndrome (PCOS), and Diabetes Mellitus (DM). Studies have previously shown that age, exercise, smoking, night shifts, and diseases, including PCOS and DM, affect the menstrual cycle28. Since we did not have information on other factors, such as recent pregnancy/birth and breastfeeding status, we opted to use marital status and answers to pregnancy desire as a surrogate for such confounding factors. Marginal models were used to visualize the association between BMI and all outcomes after adjustment for these confounders. Analysis was rerun and limited to those with complete data.
Ethical statement
The National Center for Child Health and Development institutional review board approved the study protocol (approval date: July 15, 2020, project number: 1985). Our study complied with all relevant ethical regulations, including the Declaration of Helsinki and the Ethical Guidelines for Medical and Health Research Involving Human Subjects. All current app users were notified of the research objective, outline, data collection, and method of participating. Informed consent was obtained from all participants upon answering the questionnaire and agreeing to provide menstrual cycle data to the study.


Responses