Breast cancer risk assessment based on susceptibility genes and polygenic risk score in Vietnamese women
Introduction
Breast cancer (BC) is the leading cause of cancer death in women with almost 2.3 million new cases and 700,000 deaths globally [1]. In Vietnam, the incidence rate of BC has been on the rise and is becoming a public health problem [2]. A high proportion of Vietnamese patients are diagnosed with late-stage BC, resulting in poor survival rates and high treatment costs [3]. Such delays in diagnosis and intervention were partly attributed to low awareness of BC signs and risk factors [3, 4]. Hence, public education and routine BC screening are of utmost importance for early BC detection. Vietnam, however, does not have a national screening program for BC. Recommendations for routine breast examinations including mammograms vary by healthcare centers and usually start at the age of 40–50. Since BC risk is known to be heterogeneous, this universal age-based approach is not optimal to encourage screening uptake and compliance. In recent years, personalized risk-stratified screening has emerged as a promising concept to improve the benefit-to-harm ratio of BC screening [5]. Individual risk assessment based on genetic data, medical history, and lifestyle information could guide screening frequency, starting age, and imaging modality for different subgroups of women.
Among different risk factors for developing BC, positive family history is one of the strongest. It is estimated that 5–10% of all BC cases have a hereditary component [6]. A third of them are caused by hereditary breast and ovarian cancer syndrome (HBOC), in which a person inherits a pathogenic variant in high- and moderate-penetrance genes such as BRCA1, BRCA2, CHEK2, and ATM in an autosomal dominant pattern [6]. This gene list is growing as more genes involved in maintaining genomic integrity and DNA repair are found associated with HBOC [6]. The HBOC prevalence in Vietnam was previously reported at 6.3% in a small group of only 79 BC patients [7]. Whether HBOC is associated with an earlier age of BC development remains a big question to help consolidate the screening guidelines for HBOC predisposition gene mutation carriers in Vietnam.
Besides HBOC, a small fraction of familial BC could be explained by low-penetrance susceptibility single-nucleotide polymorphisms (SNPs), which have been identified in several genome-wide association studies (GWAS) [8,9,10,11,12]. Although the contribution of one single variant is negligible, the cumulative effect of multiple variants, often expressed by a polygenic risk score (PRS), could significantly differentiate the risk levels. In a large study involving 94,075 BC patients and 75,017 healthy participants of European ancestry, the best PRS model using 313 SNPs was able to stratify BC risk by the PRS percentiles. Women at the top centile of the PRS score had a lifetime risk of overall BC at 32.6% [9]. As the linkage disequilibrium pattern and allele frequencies for these SNPs are highly specific to ethnicity, their association with BC needs to be examined in the Vietnamese population before PRS-based models can be adopted in this population.
Our study is the largest to assess the BC risk based on genetic variants in Vietnamese women. We first examined the prevalence and age at diagnosis of HBOC cases among BC patients in Vietnam. For those who did not have HBOC, we investigated the association of 398 susceptibility SNPs with BC and then used the significant variants to construct a PRS model to predict the risk of BC. The results of this study would provide a foundation to build evidence-based guidelines tailored for individual risk profiles of Vietnamese women.
Materials and methods
Participants
This study recruited 892 BC patients and 735 healthy individuals at the MEDIC Medical Center, the Oncology Hospital, and the Medical Genetics Institute in Ho Chi Minh City, Vietnam from 2016 to 2021. All patients had pathologically confirmed primary breast cancer, with no other concurrent malignancies. Healthy individuals had no medical history or symptoms of cancer at the time of recruitment. They were recruited during their annual health check-up, cancer-unrelated examinations such as noninvasive prenatal testing, or self-enrolled to receive genetic testing and counseling at no cost. The two groups were matched by age (±5 years), they were all female, Asian by race, and from the Kinh ethnic group (this ethnic group accounts for ~85% Vietnamese population). All participants were not related; family history could not be verified and hence excluded from the analysis. Demographic information of all participants is in Table S1.
All participants or legal guardians approved and gave written informed consent to participate in the study and to the anonymous use of their genomic data. The study was approved by the institutional ethics committee of the University of Medicine and Pharmacy, Ho Chi Minh City (# 442/HDDD-DHYD and # 51/HDDD-DHYD) and the ethics committee of the Oncology Hospital, Ho Chi Minh City (# 1271/BVUB-CDT). All methods were performed in accordance with the Declaration of Helsinki and relevant guidelines/regulations.
Sample collection and processing
Each participant provided 1–2 mL of peripheral blood in the BD Vacutainer K2 EDTA tubes (BD, Franklin Lakes, NJ, USA). Tubes were centrifuged at 4 °C, 2000 × g for 10 min; the buffy coat was collected and genomic DNA was extracted by the MagMAX™ DNA Multi-Sample Ultra 2.0 kit (ThermoFisher, USA) according to the manufacturer’s instructions. DNA concentration was quantified using the QuantiFluor dsDNA system (Promega, USA). A total of ≥ 13 ng and ≥ 5 ng of DNA were required for the HBOC analysis and SNP genotyping respectively.
HBOC analysis
DNA samples were subjected to next-generation sequencing (NGS) as previously described [7]. In brief, DNA fragmentation and library preparation were performed using the NEBNext Ultra II FS DNA library prep kit (New England Biolabs, USA) following the manufacturer’s instructions. Libraries were pooled together and hybridized with a hereditary cancer gene panel consisting of 17 genes [7], 7 of which are high penetrance genes for HBOC: BRCA1, BRCA2, PALB2, TP53, PTEN, CDH1, and STK11 (IDT, USA). Massive parallel sequencing of DNA libraries was performed on the NextSeq 2000 system (Illumina, USA). Samples with ≤ 80% targeted regions reaching 10x coverage were considered as failed and re-run if possible or removed from analysis. Data analysis was performed as previously described [7]. Variants were classified according to the guidelines of The American College of Medical Genetics and Genomics (ACMG) [13]. Only variants classified as “pathogenic” or “likely pathogenic” were reported in this study. All variants were confirmed by Sanger sequencing as previously described [7].
SNP genotyping
We selected a list of 398 susceptibility SNPs previously reported to be associated with BC in Asian populations either from large-scale GWAS studies or small studies focusing on the Vietnamese, and SNPs used to construct PRS in Asian populations [8,9,10,11,12] (Table S2). Genotyping at these positions was performed in multiplex polymerase-chain reactions using predesigned rhAmpSeq™ primers and rhAmpSeq™ workflow (IDT, USA). The DNA libraries were sequenced on the DNBSEQ-G400 sequencer (MGI, Shenzhen, China). Raw reads in FASTQ format were first trimmed of low-quality bases and adapter sequences using Trimmomatics (v0.38) [14] before being aligned to the human reference genome (GRCh38) by BWA-MEM (v0.7.17) [15]. Subsequently, Picard (v2.25.6) was used for post-alignment procedures including sorting and assessing alignment quality. Bam-readcount (v1.0.1) [16] was used to count reference and mutation bases at specific nucleotide positions followed by parsing and calculating the allele frequencies (AF) using R (v4.1.3) with Tidyverse package (v1.3.1) [17]. The reference allele frequency was then used to identify the genotype at each position: i) homozygous with two reference alleles when reference allele frequency > 80%; ii) heterozygous when the reference allele frequency ranged from 20% to 80%; iii) homozygous with two alternative alleles when reference allele frequency < 20%.
Statistical methods
SNP association testing
Basic logistic regressions were used to individually test the association between each SNP and risk of BC using the entire dataset. In order to adjust for the population structure, we included age and the first 15 principal components of our successfully genotyped dataset in the logistic regressions:
Logistic regressions, corrected with the Benjamin–Hochberg procedure [18] were used to test for the significant interactions between any pairs of SNPs:
PRS development
The entire data was split randomly into train (80%) and validation (20%) datasets. In order to filter out SNPs that demonstrate weak or no association with breast cancer when developing the PRS, all variants were re-evaluated for association with 0.1 p-value cutoff on the train dataset. After that, logistic regression was used to characterize the contribution of each SNP to the BC phenotype:
The best combination of SNPs was selected through Akaike information criterion (AIC) and the stepwise approach. The per-allele log odds ratio (OR) values βi of the variants estimated from the best model were used to construct PRS on the train dataset. ({X}_{i}) is the allele dosage for variant (i).
The PRS was subsequently evaluated on the independent validation dataset.
Risk stratification
For the empirical risk curve, we employed the maximum likelihood estimation to estimate the mean and the standard deviation of PRS between case and control groups with the assumption of Gaussian distribution. We stratified the risk into 11 categories: <1%, 1–5%, 5–10%, 10–20%, 20–40%, 40–60% (baseline), 60–80%, 80–90%, 90–95%, 95–99%, and >99%, based on the PRS percentile of the control group, similar to previous studies [8,9,10,11,12]. The divergence of PRS distribution between case and control groups was used for odds ratio computation. The confidence interval (CI) was computed from bootstrapping. We re-sampled with replacement of the whole data 100 times and for each time, the empirical risk curve was re-estimated. The 95% confidence interval (95% CI) was reported as the 2.5% and 97.5% percentiles.
Absolute risk
We assumed that 732 BC cases in our dataset reflected the stable annual incidence of a hypothetical female population of 1,880,752 individuals. The size and age of this hypothetical population were selected based on the annual non-hereditary BC incidence at about 39 per 100,000 Vietnamese women (assuming the hereditary cases accounted for 5% of all cases and given the incidence rate of BC to be 41 per 100,000 Vietnamese women [3, 19]), and the Vietnamese age structure [20]. We aggregated our data into 15 five-year age classes ({A}_{i}) from 0 to 70+. Since the prevalence and survival time of BC are low and short respectively [19, 21], given the risk category r, the probability of acquiring BC of one individual in age class ({A}_{i}) for one year was approximated as:
The probability of acquiring BC for one year of one individual at age (a) which is in age class ({A}_{i}) was computed as:
Then, the probability of acquiring BC in the next 10 years of a healthy individual at age (a) was approximated as:
Other statistics
For sample size calculation, to compare the frequency of a single SNP between cases and controls, assuming an SNP frequency of 7% in controls, an odds ratio of 1.4, 5% significance, 70% power, and a 1:1 case-control ratio, the number of BC cases required was estimated to be 730. After adjusting for a 5% prevalence of HBOC and a 10% low-quality sample, the estimated number of BC patients needed for this study was ~850. Analysis was performed using the epiR package. For other statistical tests, Wilcoxon rank sum test with continuity correction test was used to compare the age of diagnosis between HBOC and no-HBOC BC patients. Lilliefors test and F-test were used to assess normal distribution and equal variance respectively for PRS distributions of cases and controls. T-test was used to compare the PRS between the cases and controls. All statistical analyses were conducted in R.4.2.0.
Results
Study cohort
Our study recruited a total of 892 BC and 735 healthy women (Fig. 1). The HBOC analysis included 802 BC patients, whose DNA samples were sufficient or sequencing passed quality control as mentioned in the Methods. For the SNPs and PRS analysis, 732 BC cases (642 cases with no HBOC, 90 cases with unknown HBOC status) and 735 healthy controls were included (Table S1).

Our study recruited 735 controls and 892 breast cancer (BC) cases in total. The control group had not been diagnosed with BC prior to the time of study entry. Among 892 BC cases, 802 of them had gDNA available to test for hereditary breast and ovarian cancer syndrome (HBOC) and 43 were found to have HBOC. 642 cases with no HBOC and 90 cases with unknown HBOC status formed a group of 732 cases for polygenic risk score (PRS) development.
HBOC prevalence and age of breast cancer diagnosis
BC women (n = 802) were tested for pathogenic and likely-pathogenic variants in the 7 HBOC-associated genes. We found that 5.4% (43/802) of the patients carried at least 1 variant in the gene panel (Fig. 2a). Majority of the variants were in the BRCA1 and BRCA2, followed by PALB2 and TP53 genes (Fig. 2b). No variants were found in the STK11, PTEN and CDH1 genes (Fig. 2b). Distribution of the pathogenic and likely-pathogenic variants along the corresponding protein sequences was illustrated in Figure S1, showing no hotspots of the variants.

a 5.4% of BC women carried at least 1 pathogenic variant in the HBOC gene panel, indicative of HBOC (n = 802). b Top mutated genes in the BC patients with HBOC were BRCA1 and BRCA2, followed by PALB2 and TP53. No pathogenic variants were detected in STK11, PTEN, and CDH1. c Histogram comparing the distribution of age at diagnosis between HBOC and no-HBOC BC patients. Wilcoxon rank sum test, *p < 0.05. d The proportion of BC patients with HBOC was found the highest in the age groups of 20–29 and 30–39 years.
We then compared the age of BC diagnosis between the HBOC and no-HBOC patients and found significantly earlier age for HBOC cases (median 45 years old) compared to the no-HBOC cases (median 49 years old) (Fig. 2c). Although the age distribution for the HBOC group appeared bimodal, our Gaussian mixture model failed to characterize it due to the limited sample size. When we divided all BC patients into different age groups, we found that the HBOC patients were the most enriched in the age groups of 20–29 and 30–39 years old, accounting for 10.5% and 8.8% of the cancer patients respectively (Fig. 2d). This proportion of HBOC cases decreased gradually as the age of the patients increased (Fig. 2d).
Susceptibility SNPs
Since HBOC-associated variants have high penetrance, we removed HBOC cases from the analysis of susceptibility SNPs. This analysis included 732 BC cases and 735 healthy controls. The 2 groups both had the median age of 48 years old (Table S1) and age-matched in 5-year intervals (Fig. 3a).

a Age distributions of all the cases and controls used for the association analysis (n = 735 controls, 732 cases). b Manhattan plot for the p-values of 357 susceptibility variants tested. The dashed line is the significant threshold of 0.05. The top 12 variants with the lowest p-value were annotated in the graph.
Out of 398 susceptibility SNPs we genotyped, 41 SNPs had missingness exceeding 10% of the samples and hence were excluded from further analysis (Fig. S2). Among the remaining 357 SNPs (Table S2), we performed association testing for each SNP with the significance level defined as p < 0.05. In the logistic regressions, age and the first 15 principal components of the dataset were added to best adjust for population structure (Figs. S3–4). In total, we identified 36 SNPs as significantly associated with BC in our cohort and they distributed evenly across all the chromosomes (Fig. 3b). We then compared the list of these 36 SNPs with significant SNPs reported for other populations (Table S3). Majority of our SNPs (32/36) had previously been associated with BC in other Asian populations while only 20 SNPs and 1 SNP were shared with the European and African cohorts respectively (Table S3).
We further examined if there was any SNP-SNP interaction among the 357 SNPs by performing 63,546 different interaction tests corresponding to 63,546 possible pairs. The result showed no pair of SNPs with significant interaction (Table S4).
Polygenic risk score
All of the 357 SNPs were used as the input for the PRS development process. The train dataset was used first to filter out SNPs with weak or no association with BC and only 48 variants with significant association were considered. After the model selection using the AIC and stepwise method, the final quantitative model comprised of only 34 SNPs (Table S5), 23 of which were susceptibility SNPs identified in the above analysis. The PRS was then evaluated on the independent validation dataset. Since there was no statistical difference in the PRS distributions between the train and validation datasets in terms of the variance, mean and AUC (Table S6, Fig. S5), we merged them into one for subsequent analysis.
The PRS distributions of cases and controls were well-characterized by normal distributions (pcontrol = 0.44 and pcase = 0.83) with no difference in variance (p = 0.84) (Fig. 4a). The PRS of cases was significantly higher than that of controls (p < 0.00001), with the mean difference of 0.6 (95% CI: 0.52–0.69). Area under the receiver operating characteristics curve (AUC) of the PRS measured in the train and validation sets were 0.67 (95% CI: [0.65–0.7]) and 0.61 (95% CI: [0.56–0.68]) respectively (Fig. S5). The AUC of our PRS model was found comparable to those of the PRS models developed for other cohorts (Table 1).
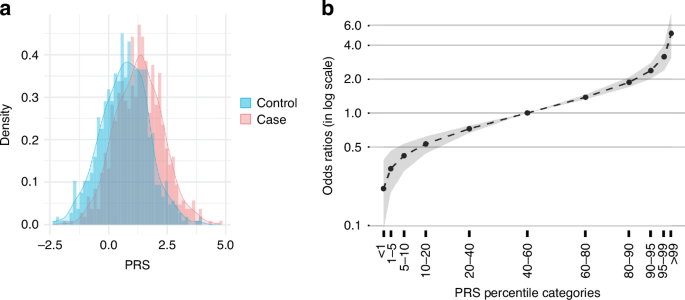
a The histograms showed higher polygenic risk score (PRS) in the cases compared to the controls. b Breast cancer risk in different PRS percentile categories. The black line shows the mean and the gray area illustrates 95% confidence interval.
Using the case-control PRS distributions for odds ratio computation, we found that for individuals in the top 1% of the PRS score, the odds ratio of overall BC was 5.09 (95% CI: 3.10–7.86). For those in the bottom 1% of the PRS score, the odds ratio was 0.21 (95% CI: 0.09–0.39) (Fig. 4b). The number of cases and controls in each risk category is shown in Table S7.
Ten-year risk of breast cancer
We approximated the 10-year risk of BC based on the annual BC incidence and size of the Vietnamese population (Table S8). The risk of developing BC was found steadily increasing with age for the first 40 years of life (Fig. 5, S6). The 2.3% threshold was the 10-year absolute risk for a woman at 50 years old to develop BC, which is also the recommended age for annual mammograms [8]. In each PRS percentile, we computed the starting age at which the 10-year risk exceeded the 2.3% threshold. For individuals in the >99%, 95–99%, and 90–95% PRS percentiles, this age was 30.1, 37.7, and 41.6, respectively (Fig. 5). For all the lower PRS percentiles, the risk of acquiring BC in the next 10 years was consistently lower than 2.3% (Fig. S6). This result was comparable with other PRS models developed for other Asian cohorts (Table 2). The lifetime absolute risk of BC is presented in Fig. S7.

The ten-year absolute risk of developing BC was estimated for different PRS percentiles: >99% (a), 95–99% (b), 90–95% (c) and 80–90% (d). Data were re-sampled for 100 times and each gray dot corresponds to the approximated risk of one re-sampled dataset. The blue dots show the mean, the area bounded by green lines is 95% confidence intervals, the red curve is generated by a generalized additive model with smoothing spline. The red vertical lines correspond to the age at which the smooth red curve reaches 2.3% risk threshold.
Discussion
Although the association between BC risk and susceptibility variants has been studied extensively in some Asian populations, this is the first study to rigorously examine this association in the Vietnamese. Risk discrimination based on genetic data has the potential to guide personalized screening recommendations, which sequentially improves BC risk awareness and screening compliance to detect BC early in Vietnam.
First, we identified the prevalence of HBOC in Vietnamese BC women to be 5.4%. This low rate of HBOC was consistent with our previous report and comparable with other Asian ethnicities such as the Chinese, Malaysian, and Japanese [7, 22,23,24]. While the previous study of 79 Vietnamese patients did not report any BRCA2 variants [7], in this larger cohort of 802 patients, we identified pathogenic variants in both BRCA1 and BRCA2 genes, accounting for 88.4% of HBOC cases. Outside of the 7 BC predisposition genes, we also observed pathogenic variants in MSH2, PMS2, MLH1, VLH, and RET genes in some BC patients, but their relevance remained unclear and was beyond the scope of this analysis. Furthermore, on average, the age of BC diagnosis among HBOC patients was 4 years younger than the no-HBOC group, similar to many other cohorts [22,23,24,25]. HBOC was also most prevalent among patients under 40 years old [22,23,24]. However, the proportion of HBOC cases in Vietnamese patients at 20–39 years old was only 9.0% (14/155), comparable with the Chinese at 8.7% [22], but lower than that in the Japanese at 13.8% (estimated for the same gene panel) [23] and the Malaysians at 12.0% (only BRCA1/2 examined) [24]. This could partly be due to the absence of PTEN variants in our cohort, which were strongly linked to the early onset of BC in the Japanese study [23]. With this data, we concluded that HBOC predisposition gene mutation carriers are at a higher risk of developing BC before the age of 40 years old and should start BC screening at 30 years old or younger. This is in line with recommendations from the National Comprehensive Cancer Network® (NCCN®) for pathogenic variant carriers: clinical breast examination and magnetic resonance imaging (MRI) at 25 years old followed by annual mammogram and MRI at 30 years old [25]. Although our study did not examine some lower-penetrance genes like ATM and CHEK2, a large study by Lowry et al. also concluded that for carriers of pathogenic variants in ATM, CHEK2, and PALB2, starting annual MRI screening at 30 years old might reduce BC mortality by 50% [26]. It is also important to note that the benefit of screening between 25 and 30 years old remains uncertain due to the high false-positive rate and high cost of MRI, and the increased risk of cancer from early exposure to radiation of mammogram [25].
We next assessed the BC risk associated with polygenic SNPs in the patients with no HBOC. This included 90 cases with unknown HBOC status due to insufficient DNA for HBOC testing, equivalent to potentially 4–5 HBOC cases but we expected the noise to be insignificant. Of the 357 susceptibility SNPs examined, 36 SNPs were significantly associated with BC in the Vietnamese, which was mostly shared with the Asian cohorts followed by the Europeans, reflecting the lower genetic distance between Asians and Europeans compared to the Africans [27]. The result also agreed with the literature that significant SNPs and PRS derived from the European ancestry could still be used for the Asians but not Africans [8, 28, 29]. Particularly, our large study using NGS also confirmed 4 significant SNPs previously reported in small Vietnamese cohorts using real-time PCR high-resolution melt analysis [30,31,32].
For constructing the PRS to predict BC risk in the Vietnamese, we used only the train dataset to re-test the association of all 357 SNPs with BC and develop PRS from these associated SNPs. The external validation dataset was used solely to evaluate the PRS performance. The developed PRS model was stable and robust with no significant difference between the train and validation datasets. The distribution of PRS between cases and controls appeared to be Gaussian and obeyed the theory of logistic regression presented in previous studies [12, 33]. In the top 1% PRS percentile, the odds ratio for overall BC was 5.09 (95% CI: 3.10–7.86), similar to the values reported in other large-scale PRS studies [9, 12, 34]. The AUC computed from our PRS was 0.61 (95%CI: 0.56–0.68) on validation dataset, in the same range with AUC of other PRS studies (Table 1). Although we determined the critical age that the BC risk exceeded 2.3% threshold by a resampling method instead of a probable survival model, the result still showed high consistency with previous works [8, 33, 34]. Assuming 2.3% is a sufficient risk to start regular screening, Vietnamese women would reach this threshold in different PRS percentiles at similar ages compared to the Chinese and the Malaysian, which share similar cancer epidemiology with Vietnam (Table S8). India has the BC incidence rate two times lower than that of Vietnam, which could explain for the higher ages that this population reached 2.3% threshold in the corresponding PRS percentiles. In reverse, BC is 4-times more prevalent in Europe compared to Vietnam, hence the Europeans reached the age threshold earlier in all the PRS percentiles, including the PRS percentiles of 40–80% that none of the Asians would reach. However, it should be noted that the absolute risk computed in this study did not account for non-breast cancer mortality rate as well as the patients that already have BC, so the absolute risk might be slightly biased. In conclusion, the PRS score could help stratify the risk of developing BC in women with no HBOC. Those in the top 1% percentile with the odds ratio of 5.09 (95% CI: 3.10–7.86) should consider screening at 30 years old while those in the 90–99% percentile with the odds ratio of 2.38–3.16 could start screening at 40 years old, unless other risk factors are present.
The limitation of our study is the relatively small sample size and the lack of hormone receptor information to perform further subgroup analysis. Also due to the limited sample size, the PRS was not tested in pathogenic variant carriers and the estimates presented in this work had wide confidence intervals. Hence, the model and its performance, risk stratification, and absolute risk have to be thoroughly validated in a future larger cohort. Moreover, since our participants were mainly from Southern Vietnam, the extrapolation of our data and model to the entire Vietnamese population must be carefully evaluated. Only the 34 associated SNPs were included in the PRS because our analysis using more SNPs as input had either low AUC or instability (Table S9). Moreover, the epidemiology of BC does not involve only genetic factors but also lifestyle risk factors such as obesity, level of physical activity, hormones, or alcohol use [35], which were not accounted for in our model due to the lack of data. Future research that integrates these factors to assess the overall BC risk would be more accurate than the PRS alone. Finally, it would be interesting to compare the performance of our PRS model with the most well-characterized PRS comprising of 313 SNPs from the European ancestry, since the latter was shown to enhance risk stratification in some Asian cohorts after population-specific calibration [8, 34].
In conclusion, our study provided the first large datasets of HBOC examination, susceptibility SNP association testing, and a PRS model in the Vietnamese women. The data could lay the foundation for a more evidence-based personalized screening approach for BC in Vietnam and empower precision public health in the future.
Responses