Broadband cavity-enhanced Kerr Comb spectroscopy on Chip

Introduction
The direct interaction of laser light with different states of matter constitutes the cornerstone of modern spectroscopic studies. By confining matter within a cavity, a multitude of important spectroscopic modalities are made possible, such as enhanced sensing at the single-molecule level1, dramatic amplification of optical nonlinearities2,3,4 and the establishment of strong coupling for coherent energy flow between matter and the cavity5. The advent of optical frequency combs (OFCs) provides a rich array of spectroscopic tools, presenting a particularly intriguing avenue for cavity-enhanced measurements. OFCs, consisting of ultra-wideband coherent spectra in the form of equidistant sharp peaks, have become an essential metrological tool to bridge the gap between optical and RF frequencies6, thus unveiling important applications in timekeeping7 and frequency synthesis8. The expansion of the utility of OFCs beyond coherent up and down conversions has allowed them to play a significant role in a multitude of novel applications such as spectroscopy9, dimensional metrology10,11 and environmental monitoring12. Naturally, OFCs may perfectly complement cavities leading to the emergence of Cavity-Enhanced Direct Frequency Comb Spectroscopy13 (CE-DFCS), which allowed to probe complex molecular structures with an extremely broad bandwidth and high sensitivity14, investigate the kinetics of different radicals15,16 and to provide a high-resolution spectroscopy of gases17 with a prominent application to human breath analysis18. A further major development that broadens the capabilities of comb spectroscopy is the use of two combs with offset repetition rates, known as dual-comb spectroscopy19. Essentially, this multi-heterodyne technique transfers the detection to the radio-frequency range, allowing for increased acquisition speed and eliminating the need for an optical spectrum analyzer20,21.
Recent years have shown the emergence of the field of integrated photonics, introducing the manipulation of light on a chip by utilizing various photonic components, such as waveguides, modulators, and detectors. This approach promises to revolutionize sensing, data communication, and quantum technologies by enabling high-speed, low-power, and compact photonic devices. Central to these technologies are integrated micro-cavities, enabling unprecedented levels of field confinement and enhancement, which in turn lead to novel applications in both sensing and non-linear optics. Various integrated cavity configurations have been implemented, such as Bragg-mirror based Fabry-Perot cavities22, whispering gallery mode resonators23, microring resonators (MRRs)24, and even the combination of thereof25. Arguably, one of the most intensively used and investigated platforms to date is SiN MRR configuration26, which benefits from extremely low-loss, wide operational bandwidth and CMOS-compatible manufacturing process. Indeed, a plethora of sensing modalities have been demonstrated using integrated silicon-based micro-resonators, as for example concentration and temperature measurement of glucose solution27, iron corrosion sensing28, and CES with microfluidic channels29, to name a few. Owing to to the inherent field enhancement in optical cavities, the threshold for non-linearities reduces significantly, allowing to exploit χ(3) process within the waveguide. In particular, Kerr-comb generation may be initiated by a cascaded four-wave mixing process producing coherent and octave-spanning spectrum30. Consequently, microcombs have already been demonstrated to be extremely versatile in their applications including ranging31,32, sensing and dual-comb spectroscopy33, optical clocks34, and precision atomic spectroscopy35. The main challenge for reaching wideband comb generation and a fully-coherent soliton state is dispersion engineering36. In order to compensate for material non-linearity through modal dispersion, the geometry of the MRR waveguide must be precisely adjusted. Simultaneously, the modal dispersion landscape defines the existence of dispersive waves, required to cover the octave range. This dictates the necessity for the accurate and broadband dispersion measurement of the cavity. Currently, the most common method for microcavity dispersion measurement involves sweeping an external cavity diode laser (ECDL) at the microcavity input while acquiring the transmission power at its output. Additional frequency reference in a form of an interferometer37 or a stabilized frequency comb38,39,40 is used to define the resonance positions. However, despite that such methods provide robust dispersion measurements, they suffer from limited measurement bandwidth, relatively slow acquisition speed, high setup complexity, and lack a path towards chip-scale integration and scalability.
Here, we demonstrate the coupling of a photonically-integrated microcomb source with a microring resonator to achieve high-resolution and broadband micro-cavity transmission spectroscopic measurements. We show that such a system may serve as a universal spectroscopic platform, enabling broadband dispersion characterization and microcomb-cavity enhanced spectroscopy on-chip. In this study we use two identical MRRs which constitute the comb and the cavity. Simple thermo-optic tuning of the cavity, probed by a Kerr microcomb operating in a soliton regime, enabled us to thoroughly characterize its guided-mode dispersion by providing detailed and broadband cavity lineshapes and resonance frequency positions. Our results agree well with comprehensive numerical simulations as well as reference measurements. In our current demonstration, we were already able to provide a broad bandwidth of nearly 250 nm. The effective bandwidth measurement obtained is already highly competitive relative to contemporary table-top tunable laser sources such as ECDLs and optical parametric oscillators (OPOs). Ultimately, our approach can support even larger bandwidths approaching an octave span. Our demonstration exploits the coherence and the high-Q of the cavity to allow cavity-enhanced spectroscopy of the guided-wave mode dispersion. By evanescently coupling specimen to the guided mode, we can extend the spectroscopic approach to allow CEDFCS of anlaytes. In particular, we numerically investigate the coupling of a microcomb to a water-cladded cavity, enabling an extremely broadband, sensitive, and photonically integrated platform for sensing. Our microcomb-cavity coupled system address important challenges in integrated photonics, enabling rapid and precise mapping of the microresonator dispersion landscape, while concurrently makes it possible to perform broadband resonantly enhanced spectroscopy. As such, it paves the way for a variety of comb-cavity experiments and applications in the fields of non-linear integrated photonics, as well as environmental and biomedical sensing.
Results
Comb-cavity coupling concept
In this part, we present the concept of photonically-integrated coupling of a microcomb and a microring resonator. Utilizing such a system allows for broadband and accurate characterization of cavity transmission linshapes.As will be shown and discussed later, this measurement technique can be simultaneously used for direct cavity-enhanced frequency comb evanescent spectroscopy as well as provide an ultra-wideband measurement platform for thorough microcavity dispersion characterization. Our conceptual arrangement is schematically depicted in the Fig. 1a. Operationally, a Kerr-comb spectrum is initiated in the source MRR and directly coupled to a target MRR. The latter frequency landscape is controlled by means of thermo-optic effect, which is nowadays routinely implemented by integrated microheaters41. Here, such an effect primarily alters the refractive index of the constituting MRR materials, thus, shifting the resonance frequencies in a negative direction for the case of increasing temperature. The Kerr-comb acts as a reference frequency source which tracks the moving resonance transmission dips of the target cavity. When the cavity resonance overlaps with the corresponding static comb line the coupling occurs one at a time for the corresponding comb line-resonance pair. As shown in Fig. 1b cavity transmission response can be extracted from monitoring the power of a specific comb line, providing a detailed lineshape data and consequently revealing the resonance frequency position, line-splitting, contrast and linewidth. Cavity transmission acts as a filter which is shifting in response to the temperature change effectively implementing the convolution operation with respect to the comb signal. Resulting data (Fig. 1c) naturally represents the so-called integrated dispersion Dint up to a linear term, which results from a mismatch between the comb repetition rate and cavity free spectral range (FSR). We can define Dint in terms of the resonant frequency positions with an angular number m ({omega }_{mu }={omega }_{0}+{D}_{1}mu +frac{1}{2}{D}_{2}{mu }^{2}+ldots) as follows:
where D1/2π is an FSR of the cavity in Hz, the rest of the terms define higher-order dispersion and μ is a longitudinal mode number with respect to the reference mode μ = 0. Our results are acquired through a continuous thermo-optical scan of the target cavity. Prior this process, we synchronize the resonant frequency of the target cavity with the microcomb’s pump frequency by applying a fixed thermal offset. To determine the magnitude of this temperature offset, we measure the relative frequency position of the pumped source MRR resonance with respect to the resonance of the target cavity. This can be achieved by a laser frequency scan around the pump resonance. Knowing the frequency scan rate and the temperature-to-frequency resonance shift coefficient of the material, one can calculate the initial temperature value and subsequent temperature change range for the target cavity scan. Once calculated, the desired temperature profile is applied to the target cavity, and the corresponding frequency sweep range is then deduced. Above a certain power threshold, the resonant lineshape appears as a triangular-like (often coined ‘thermal triangle’) resonance instead of a Lorentzian one. This is a consequence of a thermo-optic effect supported by the small mode volume and field enhancement42. Thus, the photodetected signal of the scanning laser would consist of the source MRR thermal triangle and a conventional Lorentzian resonance as is shown in Fig. 1a. Simultaneous presence of the thermal triangle along with the Lorentzian resonance neatly demonstrates the conceptual coexistence of the non-linear and linear effects in a comb-cavity coupled system.

a Source Kerr-comb is coupled to either a silicon-dioxide cladded cavity, allowing waveguide-mode dispersion measurement or to an analyte-cladded cavity allowing for the evanescent-mediated specimen-light interaction. Heaters are used to set the appropriate pump wavelength of the comb source and to implement the temperature sweep of the target cavity. b Schematic description of the mechanism: cavity resonances with a certain FSR shift in response to the temperature change, while the stationary comb with a linespacing of frep acts as a probe signal. The change in intensity of a specific comb line, resulting from the coupling of comb tooth with a cavity resonance, provides comprehensive dispersion data – relative frequency positions of the resonances and their corresponding lineshapes. c Straight horizontal alignment of the resonances corresponds to a perfect dispersionless cavity with FSR = frep, linear one reveals the mismatch between FSR and frep, and parabolic arrangement indicates a second-order dispersion characterizing group velocity dispersion.
Repetition rate frep of the frequency comb defines the even spacing of the comb lines in the frequency domain, thus, scanning the target cavity resonances with respect to the stable comb lines results in the partial subtraction of the linear term defined in (1). In case of a closely matched comb frep and cavity FSR the remaining linear term can be negligibly small which would naturally result in an integrated dispersion data representation very close to its original definition. For the ideal scenario of a dispersionless cavity with an FSR precisely matching frep (see Fig. 1c), the measurement would show the resonance positions perfectly aligned with respect to each other, which implies that the overlap between the comb lines and corresponding resonance dips during the shift occurred simultaneously. In case of a mismatch between a dispersionless FSR and identical frep, a linear term would show up. Second-order dispersion, characterizing the group velocity dispersion for the pulse propagation, would have a parabolic shape with a concavity defined by the normal or anomalous dispersion character. Analogously, if the higher-order dispersion is present, it would be captured by the measurement. An access to the resonant lineshape data allows to use the aforementioned setup for implementation of a photonically integrated cavity-enhanced spectrometer. Because such a method provides simultaneous information about Dint (real part of the refractive index) as well as the losses (imaginary part of the refractive index and the resonance contrast) we term it as complex Dint throughout this paper. By exposing the MRR’s top cladding one can evanescently couple a portion of the circulating light to a material under investigation for the purpose of cavity-enhanced sensing. For example, placing liquid or gas on top of the cladding of the MRR waveguide would alter the effective refractive index of the transversal mode propagating along the cavity and simultaneously induce frequency-dependent losses. By comparing the reference complex Dint with the one obtained after adding the material under the investigation to the sensing cavity, absorption and dispersion spectroscopy can be implemented. Integrated comb-cavity coupling constitutes a conceptually universal, broadband and compact platform for CE-DFCS and microcavity studies.
Experimental setup
The schematic representation of our experimental setup is illustrated in Fig. 2a. To implement comb-cavity coupling we used two SiN chips with identical design parameters. Yet, owning to manufacturing tolerances, the optical path differs slightly and consequently the dispersion of the MRRs. The cross-sectional dimensions play a crucial role in defining the dispersion of the ring. In our work, we targeted an anomalous dispersion, which we achieved with the microring waveguide of 1.55 μm width and 0.8 μm height for MRR and 1 μm width and 0.8 μm height for the bus waveguide, correspondingly. A MRR radius of 22.5 μm resulted in approximately 1 THz separation between the comb lines.
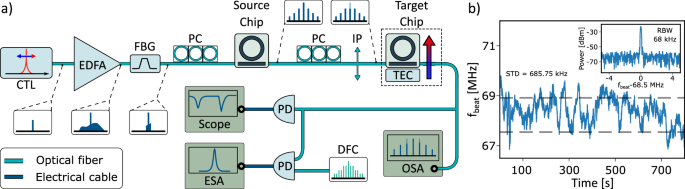
a Continuously tunable laser (CTL) is amplified by an Erbium-Doped Fiber Amplifier (EDFA) with an amplified spontaneous emission filtered by a band-pass Fiber Bragg Grating (FBG) filter. The first polarization controller (PC) is used to optimize the pump coupling to the SiN chip for the soliton generation achieved by a forward-backward tuning of the CTL in the vicinity of the source MRR resonance. The second PC in conjunction with an in-line polarizer (IP) is used to eliminate the pump to prevent triggering non-linear effects in the target cavity. Our target chip is placed on a copper stage attached to a Peltier element for the temperature sweep, which is controlled by means of Thermo-Electric Controller (TEC). Resulted comb signal is split for the detection of the individual comb line power by an Optical Spectrum Analyzer (OSA) simultaneously with monitoring the chip’s temperature. Another part of the signal is photodetected to facilitate soliton generation, and the last portion is used for detecting the beat between the coherent comb state and a table-top Difference Frequency Comb (DFC). b Comb coherence verification by measuring the beat frequency between the comb line and DFC. A standard deviation of 700 kHz is obtained for the 800 s measurement, demonstrating a sub-MHz linewidth.
Precise comb-assisted spectroscopy requires the source to be coherent. Otherwise, the broad linewidth of comb-teeth43 as well as their corresponding jitter can hinder the measurement resolution and degrade the available signal-to-noise ratio (SNR). This requirement can be matched by initiating a soliton state. To that end, we employed a technique highly reminiscent of a backward tuning reported by Guo et al.44. An amplified continuously tunable laser (CTL) was used to generate a multi-soliton state at first, which then was converted to a single-soliton state by the backward tuning. In our case no fast forward-tuning was required in order to get a multi-soliton state, which we attribute to the presence of avoided mode-crossings around the pump resonance45. The pump power obtained after amplification with an Erbium-doped fiber amplifier (EDFA) and right before the source chip was measured to be 210 mW. Fiber Bragg grating (FBG) based band-pass filter was used to filter out the amplified spontaneous emission of the EDFA. The first polarization controller (PC) was used to achieve an optimal coupling of the pump to the chip, while an additional PC in combination with an in-line polarizer allowed us to reduce the pump power to avoid triggering non-linear effects in the target MRR cavity.
To choose an appropriate temperature scan range and to control the laser offset during the soliton generation, the optical signal was photodetected and monitored by an oscilloscope. We scanned the laser wavelength to obtain the transmission signal of the target cavity simultaneously with the thermal triangle of the source MRR to identify the initial value of the temperature sweep. In order to verify the coherence of the microcomb we heterodyned an adjacent line to the pump frequency with a table-top stabilized frequency-comb (DFC) line. The resulting beat-note (Fig. 1b) was captured by an electrical spectrum analyzer (ESA). Sub-MHz linewidth of the beat verifies the coherent nature of the generated comb state. Fluctuation of the beat frequency during an 800 s measurement did not exceed a peak-to-peak level of 3 MHz with a standard deviation of approximately 700 kHz. According to elastic-tape model46, the other comb lines inherit the coherence level of the pump laser as well. As described in the previous section, after propagating a comb light through the MRR cavity we initiated the temperature sweep of the target chip. The target cavity chip was placed on a copper stage connected to a Peltier element, which was managed by a thermo-electrical cooler (TEC) controller. An overall temperature sweep from 30 °C up to 33 °C was performed. An Optical Spectrum Analyzer (OSA) was used to monitor the power of comb lines, while simultaneous temperature tracking of the target chip was obtained using a thermistor. We used an apriori temperature-to-frequency shift calibration to convert the temperature measurement data into frequency shift values.
Broadband MRR cavity transmission measurement
Figure 3 shows the obtained broadband cavity spectroscopic measurement and its processing to extract the complex integrated dispersion. Our single-shot measurement has the capacity to resolve 31 cavity lines corresponding to a frequency (wavelength) deviation of 31 THz (246 nm). Each row in Fig. 3a is assigned a mode number μ with respect to the comb pump mode number μp = 0, where μ decreases with the increasing wavelength and increases with respect to the frequency. For clarity we show the mode numbers related directly to the comb structure used in the experiment in Fig. 3b. Figure 3b shows the simplified experimental setup, highlighting the initial comb spectrum and its state after propagation through the target cavity. The useful bandwidth of the final comb state is reduced compared to the initial one due to coupling losses, which can be significantly improved by integrating the entire system on the same chip. Raw measurements from the temperature scan are shown with light blue dots with the processed fit data (red curve) on top of that. The apparent slope in the demonstrated data of Fig. 3a is due to the frequency-temperature coefficient (GHz/°C) frequency-dependent nature, the measurement was calibrated accordingly. The initial data in Fig. 3a was acquired simultaneously, after which every row was multiplied by a corresponding frequency dependent temperature-to-frequency conversion coefficient resulting in the scaling of the y-axis and appearance of the aforementioned slope. From the cavity transmission measurement we extracted the ordinary Dint, which characterizes cavity modes shift with respect to their dispersionless evenly spaced positions. The dominant parabolic nature of the frequency shifts shown in Fig. 3c and their concavity indicate anomalous dispersion. The second-order fit integrated dispersion coefficient D2/2π was calculated to be 24.8 MHz. To back-up our results we separately measured Dint using a wavelength meter, the result is depicted by black dots in Fig. 3(c). It is instructive to notice that the available measurement range obtained with a state-of-the-art CTL and a wavelength meter (110 nm) is more than twice as small as the range provided by the temperature scan (246 nm). We also emphasize that our setup (Fig. 2) was not optimized in terms of the available comb probe signal bandwidth as we will discuss below. To further verify the validity of the proposed method we executed numerical simulation of the MRR integrated dispersion by using a finite-elements-method (FEM) mode solver. The refractive index from the simulation was used to calculate D coefficients for the integrated dispersion47. The simulated Dint (blue dots) is in a good agreement with the measurements obtained, and the light blue background represents the uncertainty range caused by manufacturing imperfections (±20 nm variation in the height and width of the waveguide). The second-order dispersion coefficient D2/2π obtained from the simulation was equal to 31.2 MHz, which is in a good agreement with the measurement results, given the uncertainties in refractive indices values, and geometry. Apart from the frequency positions of the resonances, we are also able to to extract the quality factors of the corresponding cavity resonances, which is presented in Fig. 3d. The resulting data demonstrates a low-loss nature of the SiN waveguide based cavity with Q-factors ranging approximately from 1 up to 2 millions. As a consequence of the the relatively high Q-factors, splitting of some lineshapes is evident (owning to defects), which we include individually in the plot. Another interesting feature of the Q-factor distribution is its increasing trend with the increase of the mode number. We attribute this behavior to the influence of the frequency-dependent point coupling between the bus waveguide and the MRR itself, which is consistent with the study of Moille et al.48.
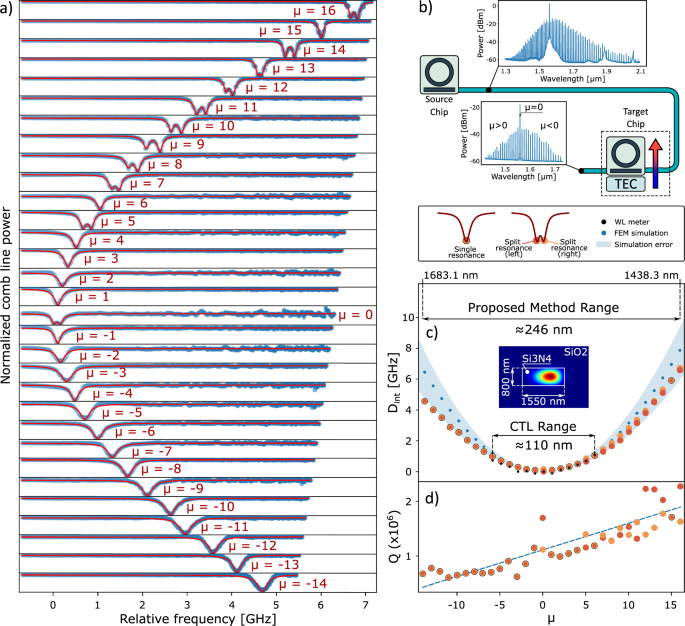
a Broadband micro-cavity transmission measurement obtained from micocomb-cavity coupling and subsequent temperature scan. Each row corresponds to a specific comb line mode number μ, ordered with respect to the pump (inset in (b) shows μ ordering with respect to the comb lines), and represents the cavity transmission as a function of frequency. Light blue dots represent the raw measurement data with the superimposed (red curves) fitted Lorentzian lineshapes. b Reduced schematic of the setup showing the initial wide comb compared with the comb state after propagation through the target cavity. c Real integrated dispersion, extracted from the complex data (a). The peaks of the split resonance are shown in light and dark orange, and a single resonance is designated by the combination of thereof. Blue dots show the result of a FEM simulation for Dint with the blue light background representing uncertainty in the WG dimensions. Inset demonstrates the WG cross-sectional dimensions along with the basic TE mode intensity accounting for the waveguide curvature. Wavelength meter measurement is depicted by black dots and the obtained CTL range is shown (110 nm). d Q-factor distribution extracted from (a) demonstrating the coupling-loss dependent loaded Q-factor which is a consequence of point coupling between the bus waveguide and MRR. Measurement range obtained in the current study exceeds state-of-the-art CTL range more than twice as much (246 nm).
On-Chip cavity-enhanced spectroscopy simulation
Complex integrated dispersion representation is naturally appealing for cavity-enhanced spectroscopy applications. For the case of an integrated photonic chip platform the sensing cavity can be realized by exposing the cladding of the target MRR. The evanescently coupled guided wave would be perturbed in the presence of a specimen such as a gas or liquid, resulting in a modified frequency-dependent effective refractive index. Comparing the reference complex Dint obtained without the specimen with Dint acquired after adding the specimen enables the identification of the spectral components of the material under investigation.
High-Q cavities used in our experiment provide a potential platform for dramatic sensitivity enhancement for spectroscopy experiments. SNR improvement due to the presence of the low-loss cavity should be approximately proportional to its Finesse, which defines the number of roundtrips the light field would make until its energy would decay to the 1/e with respect to the initial value. To verify this concept in context of our proposed platform we performed rigours calculations where we used water as the cladding of our cavity.
The transmission of a MRR can be mathematically represented by the following equation49:
where r is the self-coupling coefficient, a designates cavity losses, ϕ = neff(ω)kL is the phase of the waveguide mode with the wavenumber k and effective refractive index neff propagating along the cavity of length L. We calculated neff for the waveguide dimensions used in the experiment, but this time the SiO2 cladding was substituted with water as depicted in Fig. 4a. The complex neff = nr + ini, obtained from the simulation, is shown in Fig. 4a. For this simulation, we used the complex refractive index of liquid water from the ref. 50. From the imaginary part of neff we calculated a loss coefficient as (a=exp (2pi {n}_{i}Lf/c)) that is shown in Fig. 4b, the inset demonstrates a zoom-in view to emphasize the features presented at a small scale. The cavity transmission calculated with the Eq.(2) using the losses coefficient obtained from the numerical calculation is shown in Fig. 4c: the orange plot demonstrates the transmission with the initial water neff, while the blue plot shows the effect of the 0.1% change in the absorption coefficient a. Induced absorption change in the simulation mimics the scenario where liquid is used as a mediator between the biological measurands such as biomolecules, DNA or RNA and light. This became especially important in the context of the recent COVID-19 pandemic to develop a reliable and compact sensor for the virus signature detection51. We want to emphasize that for the presented simulation we used a fixed value of r = 0.993, which, due to the frequency-dependent nature of the loss coefficient, resulted in critical coupling (zero transmission value) only for a specific portion of the transmission spectrum. This suggests that bus-ring coupling can be used as an additional degree of freedom during the design of a specific sensing device. To qualitatively asses the sensitivity of our absorption spectroscopy we also plot the the straight waveguide transmission spectrum with length L equal to the MRR’s circumference as a reference. It is clearly seen that the use of a cavity allows to distinguish minute features of the water absorption spectrum, while a single-pass approach is sensitive only to a huge variations of losses. In practice, a short waveguide approach would suffer from a poor SNR compromising its sensitivity. This issue is commonly overcome by exploiting long waveguides in order to increase the effective light-matter interaction path52,53,54. However, this comes at a cost of a significantly increased footprint and analyte volume. In contrast, our MRR-based system simulation reveals the effective interaction length of 1.4 m in case of a weak losses. Thus, potentially we can reach an order of magnitude improvement in sensitivity without compromising the footprint whilst providing interferometric advantages. Assuming a relative intensity noise (RIN) limited measurement up to a 10 KHz bandwidth for a typical ECDL, we estimate the minimal absorption coefficient to be ≈7 × 10⁻⁵ cm−1. Considering a scenario where one performs intensity stabilization as well as coherent detection around a narrower frequency range, this approach can yield orders of magnitude lower absorption coefficient detection.
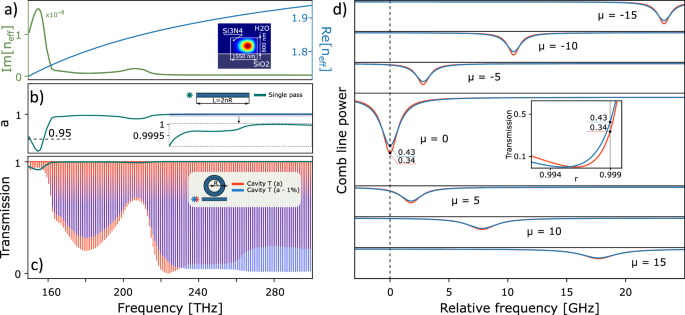
a Simulated real and imaginary part of effective index of a water cladded waveguide (cross-section is shown in the inset). b Round-trip loss coefficient of water with the zoom-in view which demonstrates subtle changes on a smaller scale. c MRR enhanced cavity transmission (orange curve) reveals with high visibility minute changes of the absorption coefficient on the scale less than 0.01%. Blue curve represents the change of 1% in water losses which mimics the scenario of biomedical sensing in liquid medium. For comparison the roundtrip transmission is also plotted (dark green curve). d Micro-cavity transmission extracted from the simulation, where μ = 0 corresponds to 1559 nm (same as in our experiment). Much higher concavity is expected with respect to the data obtained from the experiment in Fig. 3. Inset shows the dependence of the transmission on the coupling coefficient, for two cases of loss in the MRRs cladding, which defines the resulting signal contrast.
Figure 4d shows the complex Dint obtained from the simulation for the same mode numbers μ that were used in the experiment. In the presence of water, the concavity of the second-order dispersion is significantly increased with respect to the oxide cladding target MRR cavity (Fig. 3a), but the measurement can still be easily realized with a temperature scan of approximately 10 °C. To highlight the importance of the coupling the inset of Fig. 4d shows the cavity transmission as a function of coupling coefficient r. The mismatch between losses and coupling is the discriminator mechanism responsible for the contrast change in response to the change in the losses. We also note that our simulation does not account for a frequency-dependent coupling coefficient, which can be compensated by using pulley coupling48. Consequently, broadening of the resonances presented in Fig. 4d and change in the contrast are a direct consequence of the losses.
Discussion
Our demonstration marks a significant advancement towards both lab-based and out-of-the lab applications. However, in our current setup, the acquisition and characterization of broadband optical signals was obtained by using a table-top, large, and non-integrated OSA, hindering the realization of a fully integrated sensor. While chip-scale spectrometers are a prominent field of research, the coherence of our microcomb suggests the adoption of a dual-comb approach. This method facilitates the conversion of the spectrum and spectroscopic information from the optical to radio-frequency domain, enabling rapid measurement of the entire spectrum. Dual-comb setups with microcombs have been successfully implemented55, offering a scalable and integrable solution for broadband detection. Alternatively, a viable, albeit more complex solution, involves using wavelength-division-multiplexing filters combined with an array of photodetectors to split the comb signal into separate lines and track them simultaneously.
In our experiment, we utilize identically designed THz-rate MRRs for both comb generation and cavity analysis, facilitating broadband microcomb-MRR coupling with a modest thermo-optic scan range. In case of a fully-integrated solution, the use of buried microheaters can potentially unlock a full 1 THz FSR scan41. However, certain sensing scenarios or photonic dispersion characterizations may necessitate finer resolution. Therefore, a more general approach for MRRs of larger radii would be advantageous. In resonant frequency comb cavity-enhanced spectroscopy, one can identify two relevant resolution scales: the sampling resolution, defined by the cavity’s free spectral range (FSR), and the scanning resolution, primarily determined by the comb linewidths. For waveguide spectroscopy (i.e., solid-state), as shown in this study, a sampling resolution on the order of THz is sufficient to capture all the main spectral features. Liquid spectroscopy requires a resolution varying from tens to hundreds of GHz56,57, while gas-phase spectroscopy starts with sub-GHz requirement within an effective span of a few tens of GHz52,58 ending up with dozens of GHz59,60 for a broadband measurements. The 10 GHz –1 THz range can be readily covered with the sampling resolution of exisitng micro-cavities33,61,62,63. Sub-GHz scanning resolution can be covered by the recently demonstrated sub-kHz linewidth self-injection locked microcombs64,65. To achieve a scanning span of several dozen GHz, a simultaneous scan of the comb66,67 and the sensing cavity can be implemented, albeit at a cost of a more complex setup. Lower FSRs and repetition rates at the GHz rate could potentially enable continuous and simultaneous scanning of our target MRR and microcomb, allowing for gap-less scanning of the entire microcomb spectrum. Generally, the use of the lower repetition rate microcombs decreases the available overall bandwidth. However, 18 GHz microcomb was shown to reach an effective bandwidth of 400 nm63. Achieving the gap-less measurement would require establishing the capability to scan the microcomb’s frequency offset whilst maintaining a known measurable repetition rate. Additionally, it would be intriguing to explore the possibility of using two MRRs with different radii. In such a scenario, for example, we can leverage the established extreme broadband nature of THz-rate microcombs to measure the dispersion of microcavities with much smaller FSRs (tens and hundreds of GHz), up to the possibility of directly observing zero Dint points responsible for dispersion wave generation. Even a relatively sparse THz microcomb frequency grid should be enough to reliably extract smoothly varying dispersion of a GHz-rate microcavities. Finally, we note that our demonstrated experiment implemented with two separate photonic chips can be straightforwardly integrated onto a single chip, offering a fully integrated solution for microcomb-based cavity-enhanced spectroscopy. Such an integration can also provide a wider characterization bandwidth, eliminating the influence of fiber chip-to-chip interconnects.
In conclusion, we have proposed and demonstrated a universal photonically-integrated platform based on the microcomb-microcavity coupling, which enables simultaneous investigation of microcavity dispersion and on-chip CE-DFCS. Both comb source and target cavity were implemented using identically designed SiN MRRs. We performed a detailed MRR dispersion characterization by a single-shot temperature scan that outperformed conventional tunable laser source approaches providing a wide bandwidth of 250 nm. Numerical simulations, along with measurements aided by a wavelength meter (limited in bandwidth), confirmed the reliability of the proposed method. Our measurements provided access to information not only about the cavity resonance positions but also about their lineshapes. Thus, we termed the resulting data representation as complex integrated dispersion. Combination of the comb source and a high-Q cavity along with the complex integrated dispersion representation naturally suggests to use such a system for cavity-enhanced evanescent spectroscopy. We performed a numerical simulation to demonstrate the effective light-matter interaction paths achievable due to the cavity enhancement, which we evaluated to be 1.4 m for the case of weak losses. Finally, we discussed the apparent limitations of the proposed system and strategies to overcome them. Our study provides a valuable basis for the design and investigation of the MRRs for nonlinear optics applications like soliton or OPO generation, as well as offers a clear path for the implementation of an ultra-compact chip-scale cavity-enhanced spectrometer for biomedical, food-safety68 and environmental sensing applications.
Methods
Chip design and fabrication
Our silicon nitride chip (fabricated by Ligentec) was designed with an 800 nm silicon nitride layer embedded in optical-quality silicon oxide. The chip constitutes mostly of microring resonators with 22.5 μm radius with a waveguide width around 1500 nm which were used to achieve a 1.06 THz free spectral range at 1559 nm wavelength for a subsequent THz frequency comb generation. Straight bus waveguide with a width of 1000 nm was used to couple light to microring. Finite element method (FEM, Lumerical) software was used to optimize the microring’s waveguide width to obtain a dispersion profile facilitating soliton generation. Finite-Difference Time-Domain (FDTD, Lumerical) software was used to optimize the bus waveguide width and the gap between the bus and the microring to achieve critical coupling, resulting in a 700 nm gap. Inverse tapers were used to match the mode field diameter of the lensed fiber for chip coupling.
Experimental setup
A tunable ECDL laser (Toptica CTL 1550) with an output power of 3 mW was amplified using an erbium-doped fiber amplifier and connected to the source MRR chip via an FBG band-pass filter with 1 nm FWHM and a fiber polarization controller to optimize light coupling to the chip. Laser light was coupled to the chip using lensed fibers with the mode field diameter of 2.5 μm, and the output power following the lensed fiber was measured to be approximately 200 mW. A custom designed copper stage was used for chip placement and Peltier-based temperature control. The output optical signal from the target chip was split in two to control the overall optical power for a comb generation and to implement thermo-optic assisted dispersion spectroscopy (at a range from 30° to 33°) with an Optical Spectrum Analyzer (Yokogawa AQ6370D). Separately, calibration of the frequency temperature coefficient was obtained by the aid of a wavelength meter and precise temperature variations.
Soliton initiation and coherence assessment
Our tunable ECDL was slowly tuned from the blue-shifted side of the MRR resonance (1559.3 nm) towards the red-shifted side to trigger the nonlinear threshold and cascaded four-wave mixing. Further, red-shifting resulted in multi-soliton state generation. Subsequently, backward and slow blue-shift allowed us to achieve a single-soliton state with a smooth hyperbolic secant squared envelope. To verify the coherent nature of the generated comb, we used tunable optical filters to isolate a single comb tooth and heterodyne it with a difference frequency comb with 200 MHz line spacing (Toptica DFC CORE+) stabilized to a hydrogen maser. The resulting beat showed a sub-MHz linewidth, and a 3 MHz peak-to-peak deviation over 15 min of measurement, with a standard deviation of 685.75 kHz.
Integrated dispersion FEM simulation
We simulated (FEM, Lumerical) the waveguide eigenmodes corresponding to our chip layer structure with a silicon nitride waveguide cross-section of 800 × 1550 nm embedded in silicon oxide. The dispersion of the basic TE-mode was extracted from these simulations, from which we obtained the dispersion D-coefficients of Eq.(1) up to the 4th order to recover the integrated dispersion profile. The same procedure was repeated for the water-cladded silicon nitride waveguide to evaluate the cavity-enhancement effect.

Responses