CaecilianTraits, an individual level trait database of Caecilians worldwide

Background & Summary
Biodiversity is a multidimensional concept that extends beyond species richness alone1,2. It has become increasingly popular to study biodiversity based on functional traits3. These studies have tested hypotheses and yielded important conclusions in the formation of biodiversity4, biodiversity conservation5,6, community ecology7, species coexistence8 and ecosystem stability8,9. Functional trait variation mirrors different adaptive capacities among species. However, differences in traits exist not only among species but also among individuals10. Variations in traits among individuals shape differences in their abilities to adapt to environments and interact with other species or individuals, thereby influencing their survival. Infraspecific variations in functional traits are also related to the ability to adapt environment changes and various disturbances. Considering the climatic changes and habitat alterations caused by human activities, it is urgently important to understand trait variation at the individual level11. Individual trait-based approaches have been applied in studies of plant ecology10,12. However, most zoological databases provide data only at the species level13,14. Meanwhile, databases providing continuous morphological traits are rare15,16. High-resolution continuous data can provide fine-grained resolution about the ecological roles of species17,18. Furthermore, discrete data or functional groupings may be difficult to capture differences at the individual level. Instead, continuous measurement data can better capture variations in adaptive capabilities among individuals.
The order Gymnophiona of Amphibia, commonly known as caecilians, is a very ancient19 and unique group of amphibians20. The morphology, habits and life history of caecilians are very different from those of other amphibian species20,21,22. With the exception of a few aquatic or semi-aquatic species, they are predominantly fossorial, inhabiting subterranean habitats or forest leaf litter23. Consequently, they are among the least understood groups of amphibians24. A comprehensive database of morphological traits will help us to better understand this taxon. Moreover, trait database is also important for biodiversity conservation of caecilians. The biodiversity of caecilian may already be under severe threat, but we still lack knowledge about their biodiversity and threats they face24. Currently, 222 species of caecilians have been described25,26. Among the 202 species listed in the IUCN Red List, 91 are classified as Data Deficient27. Trait-based predictions of threat levels are widely used across taxa28,29. A comprehensive database will facilitate forecasting the potential threats faced by caecilians. Additionally, we do not yet have a comprehensive understanding of amphibian biodiversity30,31. On average, about 153 new amphibian species were descripted each year in last decade25,26. For Gymnophiona, 67 species were descripted since 2000, accounting about 30% of all species. Accessible and comprehensive morphological traits databases will also facilitate taxonomists in exploring the biodiversity of caecilians.
Based on amounts of literature32,33,34,35,36,37,38,39,40,41,42,43,44,45,46,47,48,49,50,51,52,53,54,55,56,57,58,59,60,61,62,63,64,65,66,67,68,69,70,71,72,73,74,75,76,77,78,79,80,81,82,83,84,85,86,87,88,89,90,91,92,93,94,95,96,97,98,99, we compiled the most comprehensive morphological traits database of caecilians at the individual level100. Our primary source of data was species description literature, as morphological traits were descripted in detail in such literature. Our database encompasses 218 out of 222 species across the order Gymnophiona (Fig. 1). Among these species, 72.94% have morphological traits recorded for multiple individuals (Fig. 1). We calculated the standard deviation to represent the degree of intraspecific variation for the most complete trait. The infraspecific variation supported the importance of considering individual level data in ecological or evolutionary studies. At the same time, we explored the relationship between standard deviation and sample size. The scatter plot shows a triangular pattern, indicating that there is no clear relationship between sample size and standard deviation, but when the sample size is small, a few species may exhibit very large standard deviations (Fig. 2). Therefore, we recommended increasing the sample size if it was possible to reduce the impact of random errors. We hope that this database will facilitate macroecological and macroevolutionary studies of this interesting and important taxon.

Number of data records and traits of each genus.
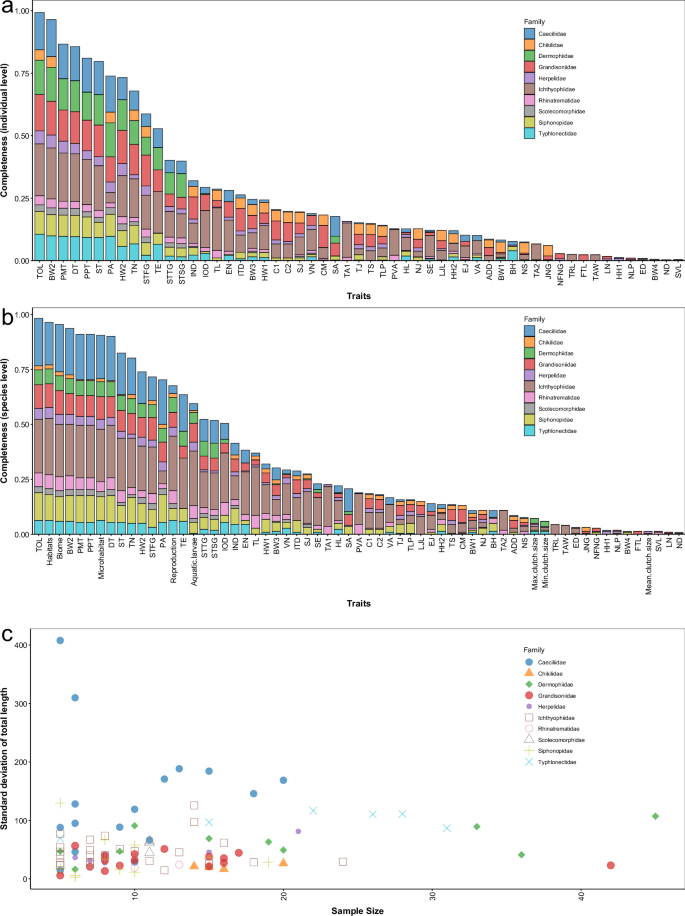
(a) Data completeness for each trait in the individual-level dataset; (b) Data completeness for each trait in the species-level dataset; (c)The scatter plot shows the relationship between the standard deviation of total length and the sample size. Descriptions of the traits are in Supplementary Table 1.
Methods
We organised the literature of all species based on taxonomic databases25,26. Due to numerous taxonomic revisions, a species may have multiple synonyms, which made searching literature using the species name directly difficult to implement. For the taxonomic system, we considered both Amphibian Species of the World25 and AmphibiaWeb26. Whenever possible, we recorded data for every specimen for each species. In cases where species description work did not provide measurements for each specimen, we recorded the mean and standard deviation of the traits. When mean values of traits were available and the holotype specimen was also descripted, we recorded both sets of data. We included as many morphological traits as possible to offer researchers more options when using the database (Fig. 2 and Supplementary Table 1). This approach also made our database more useful to other researchers, such as taxonomists.
To facilitate species level ecological and evolutionary studies, we also compiled morphological, ecological, and life history data at the species level. Based on species descriptions from the IUCN Red List and AmphibiaWeb, we collected information about habitat, microhabitat, mode of reproduction (oviparous or viviparous), mode of development (presence or absence of a water-dependent larval stage), and clutch size. For species not listed in IUCN Red List and AmphibiaWeb, we referred to field records in the original descriptions and other natural history records to compile the data. Additionally, we organized the biome101 for species based on distribution data from IUCN Red List. Biomes comprising less than 5% of the species range were not considered. For species without distribution data in the IUCN Red List, we extracted the biome information using distribution data collected from GBIF (https://www.gbif.org/) and original species description literature. We integrated these data with morphometric data. For the morphometric data, we primarily used individual level data to calculate averages. However, when population level data had a larger sample size than individual level data in our database, we chose the population level data to represent the species’ traits.
Data Records
The data100 table was organized in an excel file. The first sheet recorded the description of the data. The second sheet was the individual level dataset. The first column recorded the references. The second, third, and fourth columns recorded the taxonomy of the species, which included family, genus and binomial species name. The fifth column recorded the type the data, which were individual-level data (I), population-level data (P) or species-level data (S). The sixth column recorded the specimen number. For population level data, this column recorded the information on sampling locations. The seventh column recorded the sex information, M indicated male, F indicated female and J indicated juvenile. The subsequent columns recorded the measurements (Fig. 2). Descriptions of each trait were also listed in Supplementary Table 1. The third sheet was the species-level dataset. For the species-level dataset, the first three columns recorded the taxonomy of the species. The next columns recorded biome, habitats, microhabitats, metadata of microhabitats, reproduction, presence or absence of aquatic larvae, clutch size, metadata of reproduction, and references. The subsequent columns recorded the species level morphometric data.
For the individual-level dataset, a total of 1523 data entries were recorded in this dataset, including 1482 individual level data entries for 215 species, 35 population level data entries for 6 species, and 6 species level data entries for 4 species. Among the species level data, two species had data for both males and females. For the individual level data, the highest data completeness was 60.7%, with an average completeness of 26.11%, meaning that each record contained an average of 14.62 traits. For the population level data, the average data completeness was 33.0%. There were ten traits that covered more than 70% of the species. Among the individual level data, eight traits had a coverage rate exceeding 70%, with the highest coverage still being total length at 99.3% (Supplementary Table 1). This trait is also the most commonly used trait in ecological studies.
For the species-level dataset, habitats have the highest completeness at 96% (Supplementary Table 1). The completeness of biome and microhabitats is also high, both exceeding 90%. In contrast, the completeness for reproductive mode and whether larvae depend on water is relatively low, at 68% and 59%, respectively (Supplementary Table 1). The completeness for traits about clutch size are the lowest, with the highest completeness for maximum clutch size being only 7%. For measurement data, the completeness of most traits is slightly higher than that of the individual-level dataset (Supplementary Table 1). The highest coverage was for total length, which covered 98% of the species. We also calculated the data completeness by family (Supplementary Table 2). For the data with the highest completeness, total length, families with a larger number of species, such as Caeciliidae and Ichthyophiidae, are more likely to have missing data.
Compared to other databases16, our database provides individual-level measurement data and covered the most species. To facilitate researchers interested in species-level information, we have also compiled species-level data. Notably, the microhabitat data in our dataset differs from those in other datasets102,103. Moreover, we observed differences in microhabitat types from different sources102,103,104,105. Therefore, we had provided metadata information to support future research.
Technical Validation
We employed two strategies to ensure the accuracy in the data included in the database. First, we used different methods, such as boxplots or frequency histograms, to detect potential mistakes. We created a boxplot for each trait to quickly identify the potential mistakes. For example, misplacement of decimal points was a common mistake during data collection, and this type of error could be quickly detected through boxplot visualization. If the trait of a record was identified as a potential mistake, we would recheck the data of that species. When creating boxplots, we used the mean values instead of raw values for species level and population level data. Second, we randomly selected 10% of the species and checked the original sources again. The database recorded a total of 218 species. We randomly selected 22 species and re-verified the data for these species.


Responses