Cancer-associated fibroblasts promote EGFR-TKI resistance via the CTHRC1/glycolysis/H3K18la positive feedback loop

Introduction
Lung cancer remains the leading cause of cancer-related deaths worldwide, with non-small cell lung cancer being the most common subtype [1]. Although epidermal growth factor receptor tyrosine kinase inhibitors (EGFR-TKIs) have significantly advanced the treatment of EGFR-mutant lung cancer, the clinical efficacy of these drugs is frequently hampered by acquired resistance [2, 3]. Consequently, understanding the underlying mechanisms of EGFR-TKI resistance is a critical challenge in lung cancer therapy.
Recent research has increasingly highlighted the pivotal role of the tumor microenvironment (TME) in promoting tumor heterogeneity and resistance to anticancer drugs [4, 5]. The TME comprises various non-malignant cells, including cancer-associated fibroblasts (CAFs), endothelial cells, tumor-infiltrating lymphocytes, and myeloid-derived immune cells, which coexist with malignant cells. Among these, CAFs are particularly noteworthy due to their significant heterogeneity and plasticity, which contribute to their central role within the tumor ecosystem [6]. The diverse phenotypes of CAFs are known to drive drug resistance; for instance, in bladder cancer, the SLC14A1 + CAF subpopulation promotes chemotherapy resistance by secreting the cytokine WNT5A [7]. Similarly, the presence of LRRC15+ CAFs in pancreatic ductal adenocarcinoma has been closely associated with poor outcomes in anti-PD-L1 immunotherapy [8]. As a result, targeting CAFs presents a promising strategy for enhancing anticancer efficacy. However, previous efforts to inhibit or deplete CAFs using broad-spectrum approaches have produced unsatisfactory outcomes [9,10,11], underscoring the need to better understand CAF functional heterogeneity in drug resistance and to develop personalized strategies for CAF regulation.
In this study, we explored the complexity of CAFs in the EGFR-TKI-resistant tumor microenvironment by analyzing single-cell RNA sequencing (scRNA-seq) data. A specific subpopulation of CAFs overexpressing collagen triple helix repeat-containing 1 (CTHRC1) was identified. Using a multidisciplinary approach, we examined the clinical relevance of these CTHRC1+ CAFs, investigated their crosstalk with cancer cells, and explored the factors driving this CAF phenotype. Furthermore, we identified a potential inhibitor that modulates CAF activity to reverse EGFR-TKI resistance. In summary, this study deepens our understanding of the role of CAFs in anticancer drug resistance and proposes a novel CAF-targeting therapeutic strategy to overcome drug resistance.
Results
Identification of CTHRC1-positive fibroblasts in EGFR-TKI resistant lung cancer
We analyzed scRNA-seq data from 19 lung cancer patients before and after EGFR-TKI treatment [12], yielding 7,208 cells after quality control and filtering (Fig. 1A, Table S1). Gene expression normalization was followed by principal component analysis to identify variably expressed genes, and dimensionality reduction was performed using t-distributed stochastic neighbor embedding (tSNE) (Fig. 1B). Based on the expression of known marker genes, cells were categorized into seven major types: epithelial cells (EPCAM, KRT7, SFN, KRT19), B cells (CD79A, MS4A1, JCHAIN, MZB1), T cells (CD3D, CD3E, CD3G, NKG7), monocytes/macrophages (CD14, CD68, CSF1R, CD163), fibroblasts (COL1A1, DCN, LUM, MYLK), endothelial cells (PECAM1, CD34, VWF, PLVAP), and mast cells (CPA3, TPSAB1, KIT) (Fig. S1A, B). To differentiate between malignant and non-malignant epithelial cells, we performed copy number variation (CNV) analysis. Among the epithelial cells, cluster 0, cluster 3 and cluster 5 were defined as cancer cells (Fig. S1C). Significant differences in cell type distribution were observed in tumor tissues at various stages of EGFR-TKI treatment: treatment-naïve (TN), residual disease (RD), and progressive disease (PD) (Fig. S1D). These observations suggest that EGFR-TKI treatment significantly remodels the tumor microenvironment. To investigate intercellular communication in the EGFR-TKI resistant microenvironment, we mapped known receptor-ligand pairs across different cell types, constructing a cell-cell communication network. This analysis revealed extensive interactions between fibroblasts and cancer cells (Fig. 1C), suggesting a potential role for fibroblasts in contributing to drug resistance.

A Schematic diagram of single-cell RNA sequencing (scRNA-seq) analysis workflow. B t-stochastic neighbor embedding (t-SNE) plot of all cells colored by their identity/cell type (left and top right) or by their sample origin (bottom right). C The number (top) and weight/strength (bottom) of interactions between different cell types as identified by CellChat analysis. D t-SNE plot of fibroblasts sub-clusters colored by their cell type (top) or by their sample origin (bottom). E Heatmap showing differentially expressed genes across fibroblasts sub-clusters. F Violin plots showing representative marker genes across fibroblasts sub-clusters. G The developmental trajectory between fibroblast subtypes with Monocle colored by their cell type (left) or by their sample origin (right). H The percentage of CTHRC1 + CAF in in lung cancer samples derived from biopsies at EGFR-TKI treatment naïve stage (TN, n = 22) and at progressive disease stage (PD, n = 22). I Representative images of cytokeratin (pan-CK), COL1A1, and CTHRC1 in situ immunofluorescent staining in TN and PD samples. Scale bar, 50 μm. J The correlation between EGFR-TKI response and the percentage of CTHRC1 + CAF in lung cancer samples derived from biopsies before treatment (n = 32). SD = stable disease; PD progressive disease, CR complete response, PR partial response. K Kaplan-Meier survival curves of lung cancer patients received EGFR-TKI treatment with low and high infiltration numbers of CTHRC1+ CAFs (n = 32). L Kaplan-Meier survival curves of lung cancer patients in TCGA-LUAD database with low and high CTHRC1 + CAF signature expression. M The correlation between the CTHRC1 + CAF signature expression and clinical prognostic factors in lung cancer samples in TCGA-LUAD database. ns not significant; *p < 0.05, **p < 0.01, ***p < 0.001, ****p < 0.0001.
Subsequently, we isolated fibroblasts for further analysis and identified five distinct subclusters with unique transcriptomic profiles (Fig. 1D, E). Consistent with previously characterized fibroblast types in the lung cancer microenvironment [13]: subcluster 0 (C0) was similar to collagen-associated fibroblasts (collagen CAFs) (FN1 + /MMP11-); subcluster 2 (C2) was positive for MCAM and identified as vascular CAFs (vCAFs); subcluster 3 (C3) lacked FAP and ACTA2 expression, classifying them as normal fibroblasts (NFs); subclusters 1 (C1) and 4 (C4) were identified as PDPN+ myofibroblastic CAFs (PDPN + mCAFs-1 and PDPN + mCAFs-2, PDPN + /MMP11 + /ACTA2 + ) (Fig. 1F). Trajectory analysis showed a differentiation pattern from C3 to C1 fibroblasts (Fig. 1G), with C1 fibroblasts significantly elevated in PD samples compared to TN samples (Fig. S1E). These findings suggest that C1 fibroblasts may play a key role in driving EGFR-TKI resistance.
Next, we examined the correlation between C1 fibroblasts and patient responses to EGFR-TKI treatment in two independent in-house cohorts. CTHRC1 was predominantly expressed in C1 fibroblasts (Fig. S1F), serving as a marker for this subcluster. In the first cohort, we employed in situ multiple fluorescence immunohistochemical staining (mIHC) with antibodies against cytokeratin (pan-CK), COL1A1, and CTHRC1 to detect CTHRC1+ CAFs in lung cancer biopsy samples from patients at both the TN and PD stages of EGFR-TKI treatment. We identified fibroblasts that were negative for pan-CK but double-positive for COL1A1 and CTHRC1, which were significantly enriched in PD samples (Fig. 1H, I, Table S2). In the second cohort, we analyzed tumor tissues from 32 patients prior to EGFR-TKI treatment and found that a higher proportion of CTHRC1+ CAFs was associated with a greater number of non-responders (Fig. 1J) and shorter progression-free survival (PFS) (Fig. 1K, Table S3). To directly observe the dynamics of CTHRC1+ CAFs during EGFR-TKI treatment, we compared paired tumor samples from the patient who initially responded to EGFR-TKI therapy but later developed resistance. A higher percentage of CTHRC1+ CAFs was observed in the drug-resistant tumor (Fig. S1G), suggesting that CTHRC1+ CAFs may be involved in EGFR-TKI resistance.
We then derived a CTHRC1 + CAF signature from the scRNA-seq data [12]. In the Cancer Genome Atlas lung adenocarcinoma (TCGA-LUAD) dataset, high expression of this signature correlated with poorer survival outcomes (Fig. 1L). Additionally, the CTHRC1 + CAF signature was more highly expressed in patients with unfavorable prognostic features, such as advanced T-stage, lymph node metastasis, and higher tumor stage (Fig. 1M). Moreover, the presence of CTHRC1+ CAFs was confirmed in two additional independent lung cancer scRNA-seq datasets [14, 15] (Fig. S1H, I). These findings suggest that a CTHRC1+ fibroblast subpopulation exists within the lung cancer microenvironment and serves as a prognostic marker associated with tumor progression, survival, and resistance to EGFR-TKI therapy.
CTHRC1 + CAFs promote acquired resistance to EGFR-TKI in lung cancer
To investigate the role of CTHRC1+ CAFs in EGFR-TKI resistance, we faced challenges in obtaining sufficient tissue for fibroblast isolation, as most patients were diagnosed at an advanced stage post-resistance, making them ineligible for surgical resection. To overcome this, we established patient-derived xenograft (PDX) models using tumor tissues from patients sensitive or resistant to the EGFR-TKI, osimertinib (Osi) (Fig. 2A). Pathologic comparisons revealed a high degree of similarity in differentiation status between the xenografts and their corresponding parental tumors (Fig. S2A). Immunohistochemistry confirmed that EGFR expression levels were consistent in xenograft tumors and remained stable during passage (Fig. S2B). Furthermore, Osi treatment suppressed tumor growth in the sensitive PDX (PDX-S) but had no effect on the resistant PDX (PDX-R) (Fig. 2B), suggesting that the PDX models accurately mirrored patient responses. Collectively, these results indicate that the PDX models effectively replicated the biological characteristics of the original patient tumors, making them valuable resources for studying the molecular traits of EGFR-TKI-resistant tumors and their response to drug therapy.
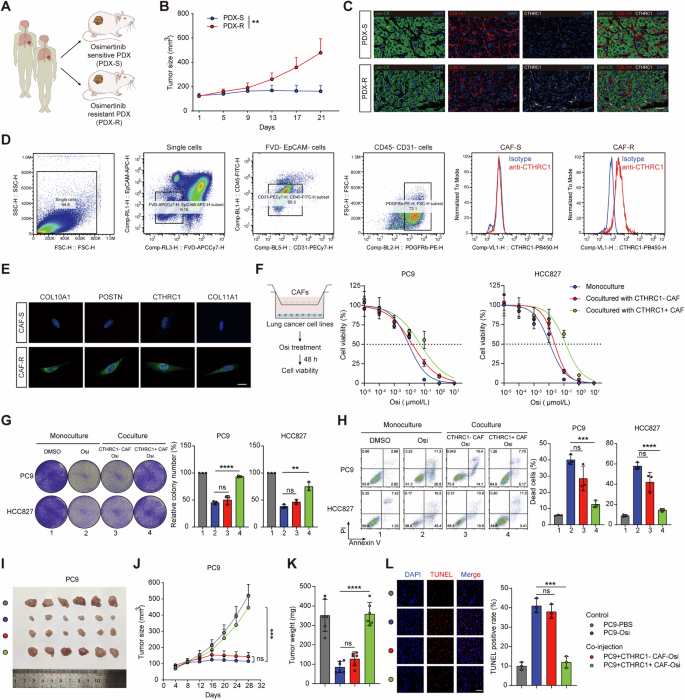
A Schematic illustration of PDX models establishment from EGFR-TKI (osimertinib, Osi) sensitive and resistant patients. B Tumor growth curves of tumor xenografts from PDXs that were treated with Osi (5 mg/kg, n = 5 mice per group). C Representative images of cytokeratin (pan-CK), COL1A1, and CTHRC1 in situ immunofluorescent staining in tumor tissues from PDXs. Scale bar, 50 μm. D Flow cytometric analysis of CTHRC1 expression in CAFs in tumor tissues from PDXs. E Representative immunofluorescent staining images of CTHRC1 + CAF marker genes in primary CAFs derived from PDXs. Scale bar, 20 μm. F Cell viability of indicated lung cancer cell lines after Osi treatment or co-cultured with indicated CAFs and treating with Osi. Representative images of the colony formation (G) and the percentage of dead cells in indicated lung cancer cell lines (H) after being cultured alone, treated with Osi (0.01 μM) alone, or co-cultured with indicated CAFs and treating with Osi. PC9 cells with or without indicated CAFs were injected subcutaneously into nude mice (n = 6). Treating with Osi (5 mg/kg) or vehicle. The digital photographs of tumors dissected from mice in different groups (I). Tumor growth curves (J) and tumor weight at the therapeutic endpoint were monitored (K). Representative immunofluorescent images for TUNEL staining apoptotic cells in xenografts at the therapeutic endpoint (L). Scale bar, 50 μm. ns, not significant; *p < 0.05, **p < 0.01, ***p < 0.001, ****p < 0.0001.
Consistent with our clinical findings, CTHRC1+ CAFs were enriched in the tumor tissues of PDX-R models (Fig. 2C). We isolated primary CAFs from the tumors of PDX models and found that fibroblasts derived from PDX-R (CAF-R) were positive for CTHRC1, whereas those from PDX-S (CAF-S) were negative (Fig. 2D). In line with the scRNA-seq data, we confirmed the upregulated expression of COL10A1, POSTN, CTHRC1, and COL11A1 in CAF-R compared to CAF-S (Fig. 2E). These results suggest that CTHRC1+ CAFs are associated with EGFR-TKI resistance in the PDX models.
We then isolated cancer cells and fibroblasts from the PDX tumors (Fig. S2C, D). Using an in vitro transwell coculture system, we investigated the function of CTHRC1+ CAFs. We found that EGFR-mutant lung adenocarcinoma cell lines (PC9 and HCC827) co-cultured with CAF-R (CTHRC1+ CAFs), but not with CAF-S (CTHRC1- CAFs), exhibited enhanced resistance to Osi (Fig. 2F). Co-culture with CTHRC1+ CAFs reduced the effectiveness of Osi in inhibiting proliferation and inducing apoptosis in the cancer cells (Fig. 2G–H). Next, we evaluated the in vivo effect of CTHRC1+ CAFs on cancer cells using a subcutaneous co-injection model. Co-injection of PC9 cells with CTHRC1+ CAFs, but not with CTHRC1- CAFs, sustained tumor growth (Fig. 2I–K) and significantly reduced cancer cell apoptosis in mice treated with Osi (Fig. 2L). These findings collectively indicate that CTHRC1+ CAFs promote cancer cell resistance to EGFR-TKI.
CTHRC1 + CAFs promote EGFR-TKI resistance via metabolic reprogramming in cancer cells
To explore the potential mechanism of CTHRC1+ CAFs involved in EGFR-TKI resistance, we performed RNA sequencing (RNA-seq) analysis, which showed that genes involved in glycolysis and gluconeogenesis were remarkably upregulated in PC9 cells cocultured with CTHRC1+ CAFs (Fig. 3A). In line with this, scRNA-seq data from Maynard et al. [12] showed that the glycolytic metabolic activity of cancer cells was enhanced in drug-resistant tumors (Fig. S3A). We then conducted untargeted metabolomics to further characterize the metabolic alterations induced by CTHRC1+ CAFs in PC9 cells. The results confirmed an upregulation of several glycolytic metabolites (Fig. 3B). Pathway enrichment analysis indicated that CTHRC1+ CAFs influence multiple metabolic pathways, particularly glycolysis and gluconeogenesis (Fig. S3B).
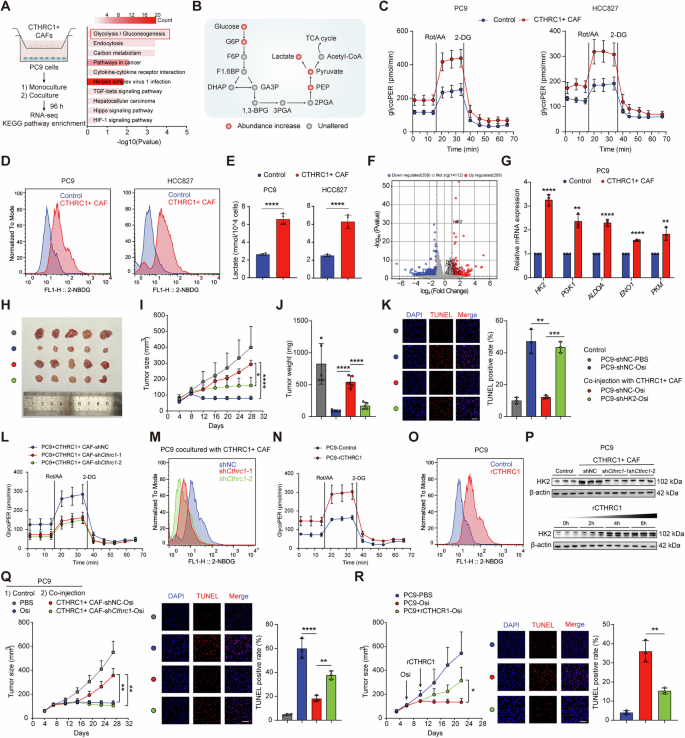
A KEGG enrichment analysis shows the top upregulated pathways in PC9 co-cultured with CTHRC1+ CAFs (n = 3). B Schematic show change of metabolites involved glycolysis pathway in PC9 co-cultured with CTHRC1+ CAFs (n = 4). Cell glycolytic profile of indicated lung cancer cells co-cultured with CTHRC1+ CAFs was evaluated by measuring glycolytic proton efflux rate (GlycoPER, C), 2-NBDG incorporation (D) and lactate production (E, n = 4). F Volcano plot of differently expressed genes in PC9 co-cultured with CTHRC1+ CAFs. G Expression of the key glycolytic enzymes in PC9 co-cultured with CTHRC1+ CAFs. PC9 cells with or without shHK2 and CTHRC1+ CAFs were co-injected subcutaneously into nude mice (n = 5). Treating with Osi (5 mg/kg). The digital photographs of tumors dissected from mice in different groups (H). Tumor growth curves (I) and tumor weight (J) were monitored. Representative immunofluorescent images for TUNEL staining in xenografts (K). Scale bar, 50 μm. L–O Cell glycolytic profile of PC9 co-cocultured with CTHRC1+ CAFs after Cthrc1 knockdown, or treating with recombinant CTHRC1 (rCTHRC1, 500 ng/mL). P HK2 expression in PC9 co-cultured with CTHRC1+ CAFs after Cthrc1 knockdown (top) or treating with rCTHRC1 (500 ng/mL) at 0, 2, 4 and 8 h (bottom). Q PC9 cells and CTHRC1+ CAFs with or without shCthrc1 were co-injected subcutaneously into nude mice (n = 5). Treating with Osi (5 mg/kg). Tumor growth curves were monitored (left). Representative immunofluorescent images for TUNEL staining in xenografts (right). R PC9 cells were injected into nude mice (n = 5) and treated with Osi (5 mg/kg) or rCTHRC1 (100 μg per mice) combined with Osi. Tumor growth curves were monitored (left). Representative immunofluorescent images for TUNEL staining in xenografts (right). Scale bar, 50 μm. ns, not significant; *p < 0.05, **p < 0.01, ***p < 0.001, ****p < 0.0001.
To quantify the impact of CTHRC1+ CAFs on glycolysis, we measured the glycolytic proton efflux rate (GlycoPER), which reflects the overall glycolytic flux by quantifying proton production as a proxy for lactate production. PC9 and HCC827 cells co-cultured with CTHRC1+ CAFs exhibited significantly higher glycolysis rates compared to those cultured alone (Fig. 3C). Additionally, these cancer cells showed a greater capacity to incorporate the fluorescent glucose analogue 2-NBDG (Fig. 3D) and produced substantially more lactate (Fig. 3E). Collectively, these results indicate that CTHRC1+ CAFs enhance glycolysis in EGFR-mutant lung cancer cells.
We then examined the expression of key glycolytic enzymes in PC9 cells co-cultured with CTHRC1+ CAFs. Among these, hexokinase 2 (HK2) showed the most significant upregulation (Fig. 3F, G). Analysis of publicly available RNA-seq data [16] also revealed that HK2 expression was elevated in EGFR-TKI-resistant cells compared to sensitive cells (Fig. S3C), suggesting that HK2 may contribute to EGFR-TKI resistance. To further investigate its role, we knocked down HK2 in PC9 and HCC827 cells using short hairpin RNA (shRNA) (Fig. S3D). The knockdown of HK2 effectively attenuated the proliferative and anti-apoptotic effects of CTHRC1+ CAFs on these cancer cells (Fig. S3E, F). In vivo experiments using a subcutaneous co-injection model further supported these findings. Co-injection of HK2-knockdown PC9 cells and CTHRC1+ CAFs led to decreased tumor growth and increased cancer cell apoptosis under Osi treatment (Fig. 3H–K). These results suggest that CTHRC1+ CAFs enhance glycolysis and EGFR-TKI resistance in cancer cells by upregulating HK2.
To investigate how CTHRC1+ CAFs promote glycolysis and drug resistance in cancer cells, we examined representative genes enriched in these fibroblasts—COL10A1, POSTN, and CTHRC1. RNA interference knockdown experiments revealed that only Cthrc1 knockdown in CTHRC1+ CAFs significantly increased cancer cell sensitivity to Osi (Fig. S3G, H). Further validation using shRNAs confirmed that Cthrc1 knockdown reduced CAFs’ ability to promote glycolysis (Fig. 3L, M) and suppressed their proliferative and anti-apoptotic effects on cancer cells under Osi treatment (Fig. S3I–K). This highlights CTHRC1 as a critical driver of glycolysis and drug resistance. Treating cancer cells with recombinant CTHRC1 (rCTHRC1) directly enhanced glycolytic activity and resistance to Osi (Fig. 3N, O, S3L-M). Furthermore, Cthrc1 knockdown in CTHRC1+ CAFs suppressed HK2 expression in cancer cells, while rCTHRC1 treatment upregulated it (Fig. 3P). Consistently, in vivo experiments demonstrated that Cthrc1 knockdown in CTHRC1+ CAFs inhibited tumor growth and promoted apoptosis during Osi treatment (Fig. 3Q), while intratumoral injection of rCTHRC1 sustained tumor growth (Fig. 3R). These findings suggest that CTHRC1 is the crucial contributor in CAFs to promote cancer cell glycolysis and EGFR-TKI resistance.
CTHRC1 + CAFs enhance aerobic glycolysis of cancer cells through TGF-β signaling pathway
After confirming the pivotal role of CTHRC1 in promoting glycolysis and drug resistance, we sought to elucidate the molecular mechanisms underlying these processes. CTHRC1 exerts its tumor-promoting effects primarily through the TGF-β signaling pathway [17]. Pathway enrichment analysis indicated significant enrichment of TGF-β/Smad signaling-related pathways in PC9 cells co-cultured with CTHRC1+ CAFs (Fig. 4A). The TGF-β/Smad pathway is well-known for its role in cancer progression [18]. Consistent with RNA-seq findings, we observed increased phosphorylation of SMAD3 protein after co-culturing with CTHRC1+ CAFs, while Cthrc1 knockdown in CTHRC1+ CAFs reduced this effect. rCTHRC1 also induced time-dependent SMAD3 phosphorylation (Fig. 4B). Immunostaining showed increased nuclear SMAD3 localization following treatment with CTHRC1+ CAFs or rCTHRC1 (Fig. 4C), indicating translocation of SMAD3 from the cytosol into the nucleus and the activation of SMAD3 signaling.
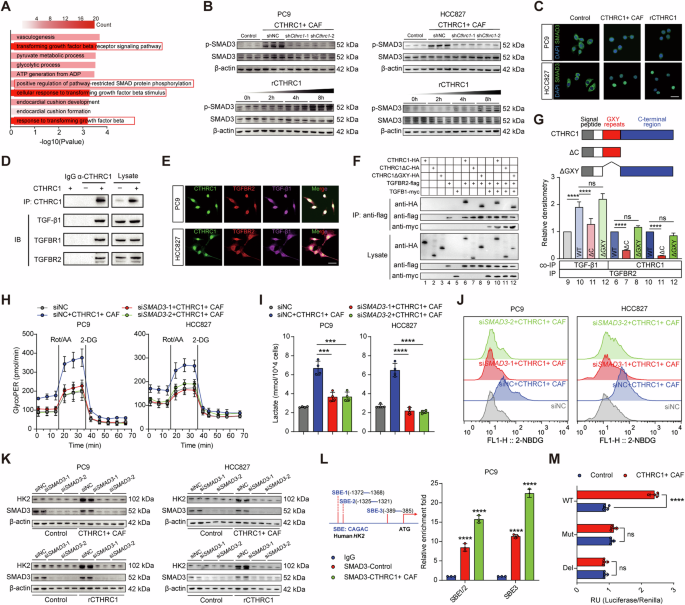
A GO enrichment analysis shows the top upregulated pathways in PC9 co-cultured with CTHRC1+ CAFs. B Western blotting for pSMAD3/SMAD3 of indicated lung cancer cells co-cultured with CTHRC1+ CAFs after Cthrc1 knockdown (top) or treating with rCTHRC1 (500 ng/mL) at 0, 2, 4 and 8 h (bottom). C Representative images of SMAD3 (green) shuttling in indicated lung cancer cells after being cultured with CTHRC1+ CAFs or rCTHRC1 treatment (500 ng/mL). Scale bar, 20 μm. D Coprecipitation of CTHRC1 with TGF-β1, TGFBR1 and TGFBR2. E Representative images of CTHRC1 co-stained with TGFBR2 and TGF-β1 in indicated lung cancer cells. Scale bar, 20 μm. F Coculture IP detected the specific interaction between CTHRC1 and TGFBR2 or TGF-β1. G Effects of domain deletions in CTHRC1 on the CTHRC1-TGFBR2 or TGF-β1-TGFBR2 interaction. CTHRC1 mutants used in this study are shown (top). H–J Cell glycolytic profile of indicated lung cancer cells with or without siSMAD3 and co-cultured with CTHRC1+ CAFs. K HK2 expression of indicated lung cancer cells with or without siSMAD3 and co-cultured with CTHRC1+ CAFs (top) or treating with rCTHRC1 (500 ng/mL, bottom). L Potential SMAD-binding elements (SBEs, motif: CAGAC) were identified in the human HK2 promoter (left). CUT&RUN-qPCR testing of SMAD3 binding to SBEs in HK2 promoter (right). M Luciferase reporter assays for HK2 promoter activity in PC9 co-cultured with CTHRC1+ CAFs (n = 4). ns, not significant; *p < 0.05, **p < 0.01, ***p < 0.001, ****p < 0.0001.
Since CTHRC1 is a secreted protein, we investigated how it activates the TGF-β signaling pathway by examining its interaction with the extracellular components of this pathway. Co-immunoprecipitation experiments revealed that the CTHRC1 immunoprecipitants from PC9 cells contained TGF-β receptors TGFBR1 and TGFBR2, as well as the ligand TGF-β1 (Fig. 4D). In TGF-β/Smad signaling pathway, TGF-β1 binds to the receptor TGFBR2, which recruits and phosphorylates TGFBR1 [19]. We therefore chose to focus on the interaction between CTHRC1 and TGFBR2. Immunofluorescence analysis confirmed the co-localization of CTHRC1 with TGFBR2 and TGF-β1 in PC9 and HCC827 cells (Fig. 4E). Further analysis through co-culture IP using HEK-293T cells, which were transfected with expression plasmids for CTHRC1 and various components of the TGF-β signaling pathway, confirmed that CTHRC1 binds to the receptor TGFBR2 and the ligand TGF-β1 in the extracellular space (Fig. 4F, lanes 6 and 10). Notably, the presence of CTHRC1 significantly enhanced the co-precipitation of TGF-β1 with TGFBR2 (Fig. 4F, lanes 9 and 10, and Fig. 4G), indicating that CTHRC1 facilitates or stabilizes the interaction between TGF-β1 and TGFBR2. This suggests that CTHRC1 plays a critical role in modulating TGF-β signaling by promoting the formation or stability of the TGF-β1-TGFBR2 complex. Given that CTHRC1 contains characteristic GXY repeats and a conserved C-terminal region, we explored which domains are essential for its interaction with TGF-β signaling components by using deletion constructs. Our findings revealed that, unlike the C-terminal deletion mutant (ΔC), both the full-length CTHRC1 and the GXY repeat deletion mutant (ΔGXY) retained the ability to bind TGFBR2 and TGF-β1 (Fig. 4F, G). This indicates that the C-terminal region is crucial for CTHRC1’s interaction with TGFBR2 and TGF-β1, thus facilitating the activation of TGF-β/Smad3 signaling in the extracellular space.
We then explored whether CTHRC1 promotes glycolysis by activating the TGF-β/Smad3 signaling pathway. Knockdown of SMAD3 in cancer cells significantly reduced the ability of CTHRC1+ CAFs to enhance glycolysis (Fig. 4H–J). Given that CTHRC1+ CAFs upregulate HK2 in cancer cells, we investigated whether this regulation occurs via the TGF-β/Smad3 pathway. SMAD3 knockdown inhibited the CTHRC1 + CAF-induced upregulation of HK2 (Fig. 4K). Moreover, in silico analysis of the HK2 promoter identified three potential SMAD-binding elements (SBEs). CUT&RUN-qPCR revealed increased SMAD3 binding to these SBEs, particularly SBE3, in PC9 cells treated with CTHRC1+ CAFs (Fig. 4L). Dual-luciferase reporter assays confirmed that the SBE3 wild-type HK2-Luc construct exhibited enhanced activity under CTHRC1 + CAF treatment, while SBE3-deficient or mutant construct did not respond (Fig. 4M). These findings demonstrate that CTHRC1+ CAFs activate the TGF-β/Smad3 pathway to transcriptionally upregulate HK2 expression, thereby enhancing glycolysis in cancer cells and contributing to drug resistance.
Lactate drives CTHRC1 + CAFs phenotype via histone lactylation
Next, we sought to explore the molecular cues inducing CTHRC1+ CAFs in lung cancer. We found extensive intercellular communications between cancer cells and fibroblasts (Fig. 1C). This led us to hypothesize that drug-resistant cancer cells might play a role in inducing the CTHRC1 + CAF phenotype. We conducted in vitro co-culture experiments using cancer cells derived from PDX tumors. These experiments revealed that resistant PDX-derived cancer cells (CC-R) were capable of upregulating Cthrc1 expression in primary CAFs derived from sensitive PDX tumors (Fig. 5A). Since EGFR-TKI-resistant cancer cells are known to exhibit increased glycolytic activity and produce high levels of lactate, we investigated whether lactate could directly induce the formation of CTHRC1+ CAFs. Consistent with our hypothesis, we observed that lactate levels were higher in tumor tissues from drug-resistant PDX compared to sensitive tissues (Fig. 5B). Moreover, when primary CAFs were treated with lactate, Cthrc1 expression was upregulated in a concentration- and time-dependent manner (Fig. 5C, D). Additionally, lactate treatment resulted in significant changes in the transcriptional profiles of CAFs (Fig. 5E). To further validate these findings, we compared the gene expression profiles of CTHRC1+ CAFs identified in vivo through scRNA-seq with those of lactate-treated CAFs in vitro. Venn diagram analysis showed that the genes upregulated in CTHRC1+ CAFs exhibited significant overlap between the in vivo and in vitro datasets (Fig. 5F). Gene set enrichment analysis further confirmed the enrichment of the CTHRC1 + CAF signature following lactate treatment (Fig. 5G). Moreover, representative effector markers of CTHRC1+ CAFs were also upregulated after lactate treatment (Fig. 5H). These results collectively indicate that lactate plays a critical role in inducing the formation of the CTHRC1 + CAF phenotype.
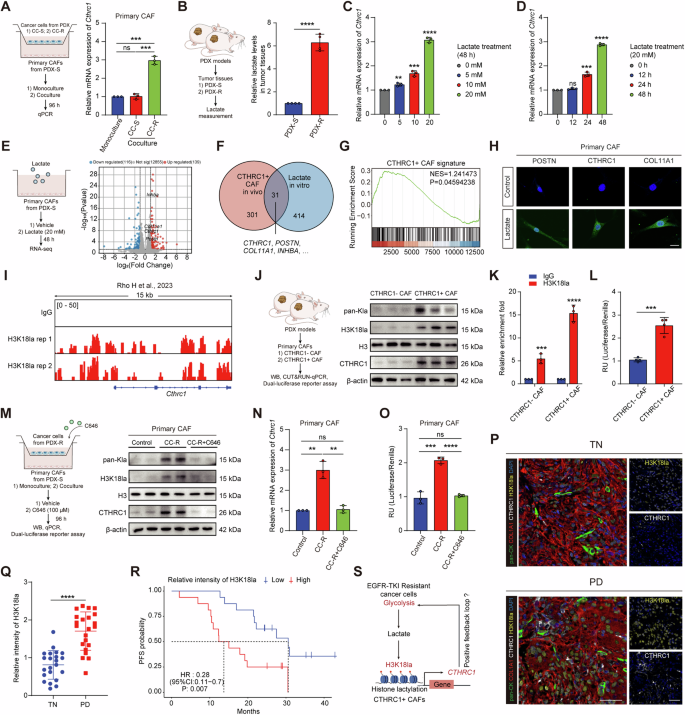
A Cthrc1 expression in primary CAFs isolated from PDX-S co-cultured with primary cancer cells from PDX-S (CC-S) and PDX-R (CC-R). B Lactate levels in tumor tissues derived from PDXs (n = 4). Cthrc1 expression in primary CAFs isolated from PDX-S treating with lactate at different concentrations (C) or timepoints (D). RNA-seq of primary CAFs from PDX-S after lactate treatment (20 mM) (n = 3). Volcano plot of differently expressed genes (E). Venn diagram shows significant upregulated overlap genes between in vivo scRNA-seq and in vitro RNA-seq (F). GSEA shows CTHRC1 + CAF signature expression after lactate treatment (G). H Representative immunofluorescent images of CTHRC1 + CAF marker genes in primary CAFs after lactate treatment (20 mM). Scale bar, 20 μm. I Representative snapshots of CUT&Tag tracks for H3K18la on Cthrc1 promoter. J Levels of pan-Kla, H3K18la, and CTHRC1 in primary CAFs isolated from PDXs. K CUT&RUN-qPCR testing of H3K18la enrichment on Cthrc1 promoter in primary CAFs isolated from PDXs. L Luciferase reporter assays for Cthrc1 promoter activity in primary CAFs isolated from PDXs. M Levels of pan-Kla, H3K18la, and CTHRC1 in primary CAFs isolated from PDX-S co-cultured with CC-R alone or with C646 treatment (100 μM). Cthrc1 expression (N) and promoter activity (O) in primary CAFs isolated from PDX-S co-cultured with CC-R alone or with C646 treatment (100 μM). P Representative immunofluorescent images of CTHRC1+ CAFs and H3K18la in TN and PD lung cancer samples. Scale bar, 50 μm Q Quantification of H3K18la intensity in TN (n = 22) and PD (n = 22) lung cancer samples from clinical cohort 1. R Kaplan-Meier survival curves of lung cancer patients from clinical cohort 2 who received EGFR-TKI treatment with low and high H3K18la intensity (n = 32). S Schematic proposing a positive feedback loop between CTHRC1+ CAFs and EGFR-TKI resistant cancer cells. ns, not significant; *p < 0.05, **p < 0.01, ***p < 0.001, ****p < 0.0001.
To further explore how lactate influences the CTHRC1 + CAF phenotype, we investigated its potential role in regulating gene transcription through histone lactylation—a process recently recognized as a mechanism for lactate-mediated gene regulation [20]. Analysis of publicly available CUT&Tag data revealed strong enrichment of H3K18la peaks at the Cthrc1 gene promoter [21] (Fig. 5I). This led us to hypothesize that histone lactylation might be elevated in CTHRC1+ CAFs. Indeed, western blot analysis of extracted histones showed increased levels of both pan-lysine lactylation (pan Kla) and H3K18la in CTHRC1+ CAFs compared to CTHRC1- CAFs (Fig. 5J). Furthermore, CUT&RUN analysis using H3K18la antibodies demonstrated higher H3K18la occupancy on the Cthrc1 gene promoter in CTHRC1+ CAFs (Fig. 5K). Dual-luciferase reporter assays confirmed enhanced activity of the Cthrc1 promoter in CTHRC1+ CAFs (Fig. 5L). Collectively, these results suggest that histone lactylation, particularly the H3K18la modification, is increased in CTHRC1+ CAFs and may contribute to the activation of Cthrc1 transcription. To corroborate these findings, we co-cultured CC-R cells with primary CAFs from PDX-S and observed elevated levels of pan-Kla, H3K18la, and CTHRC1 expression in the CAFs (Fig. 5M). Notably, the acetyltransferase p300, identified as a potential histone Kla “writer” enzyme, appears to play a critical role in this process [20]. Treatment with the p300 inhibitor C646 reduced pan-Kla, H3K18la levels, and CTHRC1 expression in the co-cultured CAFs (Fig. 5M, N). Consistently, Cthrc1 promoter activity, which was enhanced in CAFs co-cultured with CC-R, was abolished upon C646 treatment (Fig. 5O).
Moreover, mIHC staining revealed that most cells in drug-resistant tumors, including CTHRC1+ CAFs, displayed enhanced H3K18la fluorescence intensity (Fig. 5P, Q). Higher levels of H3K18la were also associated with poorer prognosis (Fig. 5R). Taken together, these results suggest that lactate released during the process of glycolysis induces Cthrc1 expression in CAFs via H3K18la modification, thereby promoting the formation of CTHRC1+ CAFs. This, in turn, suggests a potential positive feedback loop where CTHRC1+ CAFs promote glycolysis in cancer cells, further driving EGFR-TKI resistance (Fig. 5S).
CTHRC1/glycolysis/H3K18la forms a positive feedback loop in EGFR-TKI resistant tumor
To confirm the existence of a positive feedback loop between cancer cells and CTHRC1+ CAFs, we conducted in vitro co-culture experiments using primary CAFs derived from PDX-S and PC9 cells. When rCTHRC1 was added to this co-culture system, we observed a significant increase in lactate production in the cancer cells (Fig. 6A), elevated levels of histone lactylation, and increased CTHRC1 expression in the CAFs (Fig. 6B).
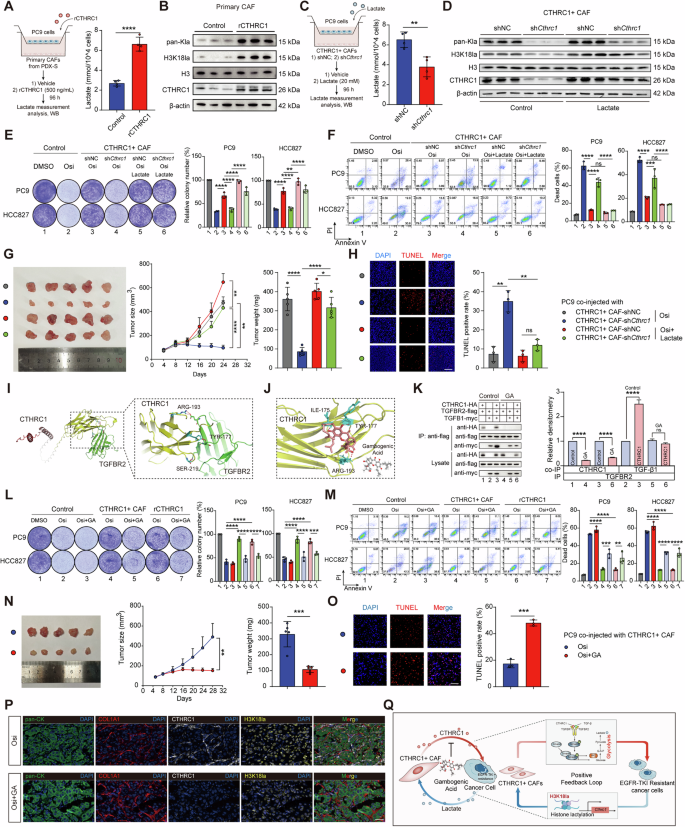
A Lactate production in PC9 cocultured with primary CAFs isolated from PDX-S after rCTHRC1 treatment (500 ng/mL, n = 4). B Levels of pan-Kla, H3K18la, and CTHRC1 in primary CAFs isolated from PDX-S after rCTHRC1 treatment (500 ng/mL). C Lactate production in PC9 cocultured with CTHRC1+ CAFs after Cthrc1 knockdown (n = 4). D Levels of pan-Kla, H3K18la, and CTHRC1 in Cthrc1-knockdown CAFs after lactate treatment. Representative images of the colony formation (E) and the percentage of dead cells (F) in indicated lung cancer cells co-cultured with Cthrc1-knockdown CAFs and treating with Osi (0.01 μM) alone or Osi combined with lactate (20 mM). PC9 cells and CTHRC1+ CAFs with or without shCthrc1 were co-injected into nude mice (n = 5). Treating with Osi (5 mg/kg) or Osi combined with lactate (1 g/kg). The digital photographs of tumors dissected from mice (left). Tumor growth curves (middle) and tumor weight (right) were monitored (G). Representative immunofluorescent images for TUNEL staining in xenografts (H). I Molecular docking analysis of binding between CTHRC1 and TGFBR2. J Docking of Gambogenic Acid (GA) into the crystal structures of CTHRC1. K Coculture IP detected the CTHRC1-TGFBR2 and TGF-β1-TGFBR2 interactions after GA treatment (0.5 μM). Representative images of the colony formation (L) and the percentage of dead cells (M) in indicated lung cancer cells co-cultured with CTHRC1+ CAFs and treating with Osi (0.01 μM) alone or Osi combined with GA (0.5 μM). PC9 cells and CTHRC1+ CAFs were co-injected into nude mice (n = 5). Treating with Osi (5 mg/kg) alone or Osi combined with GA (10 mg/kg). The digital photographs of tumors dissected from mice (left). Tumor growth curves (middle) and tumor weight (right) were monitored (N). Representative immunofluorescent images for TUNEL staining in xenografts (O). Scale bar, 50 μm. P Representative immunofluorescent images of CTHRC1+ CAFs and H3K18la in xenografts after Osi combined with GA treatment. Scale bar, 50 μm. Q A proposed working model for how a CTHRC1/glycolysis/H3K18la positive feedback loop in lung cancer tumor microenvironment drives EGFR-TKI resistance, and interruption of this feedback loop by blocking CTHRC1 overcomes drug resistance. ns not significant; *p < 0.05, **p < 0.01, ***p < 0.001, ****p < 0.0001.
Conversely, when we co-cultured CTHRC1+ CAFs with PC9 cells and knocked down Cthrc1 in CAFs, we observed opposite effects: lactate production was reduced (Fig. 6C), and levels of histone lactylation decreased, a change that was reversed by lactate supplementation (Fig. 6D). Consistent with these findings, knockdown of Cthrc1 impaired the ability of CAFs to promote drug resistance, but this impairment was rescued by lactate supplementation (Fig. 6E, F). Furthermore, in vivo co-injection experiments demonstrated that lactate treatment could reverse the effect of Cthrc1 knockdown in CTHRC1+ CAFs on sensitivity to EGFR-TKI (Fig. 6G, H). These results collectively support the existence of a positive feedback loop between CTHRC1, glycolysis, and H3K18la that drives EGFR-TKI resistance in tumors.
To determine if disrupting the CTHRC1/glycolysis/H3K18la positive feedback loop could overcome EGFR-TKI resistance, we explored potential strategies for interrupting this loop. Although genetic inhibition of CTHRC1 proved effective, the absence of commercial CTHRC1 inhibitors prompted us to search for alternatives using a structure-based virtual screening approach. Given that CTHRC1 interacts with TGFBR2 to activate the TGF-β/Smad3 signaling pathway, we first analyzed the binding mode of CTHRC1 to TGFBR2. In alignment with our co-culture IP findings, CTHRC1 was found to bind to TGFBR2 via specific residues in its C-terminal region, including ARG193, TYR177, and SER219 (Fig. 6I). Using this information, we conducted virtual screening to find compounds that could potentially disrupt the CTHRC1-TGFBR2 interaction. The natural compound Gambogenic Acid (GA) emerged as a candidate with high-affinity binding to CTHRC1. Further analysis indicated that the binding sites of GA on CTHRC1 partially overlapped with those for TGFBR2 (Fig. 6J). Co-culture IP experiments confirmed that GA treatment significantly reduced the interactions between CTHRC1 and TGFBR2, as well as between TGFBR2 and TGF-β1 (Fig. 6K), suggesting that GA could function as an inhibitor of CTHRC1.
Previous studies have shown that GA exhibits broad-spectrum anticancer activity against solid tumors [22,23,24]. To evaluate its effectiveness in overcoming EGFR-TKI resistance, we co-cultured CTHRC1+ CAFs with PC9 and HCC827 cells and treated the cultures with GA. The results indicated that GA treatment increased the susceptibility of these cancer cells to Osi. In addition, GA also mitigated the inhibitory effect of rCTHRC1 on the therapeutic efficacy of Osi (Fig. 6L, M). In vivo, GA enhanced the inhibitory effect of Osi on tumor growth and promoted cancer cell apoptosis in co-injection models (Fig. 6N, O). Additionally, mIHC staining of tumor tissues post-GA treatment revealed a significant reduction in the density of CTHRC1+ CAFs and the intensity of H3K18la (Fig. 6P).
Overall, these findings suggest that GA effectively targets CTHRC1+ CAFs, disrupting the CTHRC1/glycolysis/H3K18la positive feedback loop and thereby reversing EGFR-TKI resistance (Fig. 6Q).
Discussion
Cancer progression and therapy resistance are critically influenced by the intricate interactions between cancer cells and TME. Understanding these reciprocal interactions is key to developing more effective treatments. In our study, we conducted an in-depth investigation into the bidirectional crosstalk between cancer cells and CAFs within the EGFR-TKI resistant TME, utilizing scRNA-seq data and PDX models. Our findings revealed that CTHRC1+ CAFs are significantly enriched in drug-resistant tumors and play a pivotal role in driving metabolic reprogramming in cancer cells. Moreover, we identified lactate, produced during the glycolysis process, as a crucial factor that induces the CTHRC1 + CAF phenotype, thereby establishing a positive feedback loop that promotes EGFR-TKI resistance.
Metabolic reprogramming, a hallmark of cancer, is often modulated by the TME [25, 26]. For instance, in breast cancer, macrophages have been shown to enhance aerobic glycolysis in cancer cells through the transfer of lncRNA via extracellular vesicles [27]. Similarly, in pancreatic cancer, CAFs facilitate cancer cell survival in an acidic environment by secreting acetate [28]. In our study, we discovered that CAFs contribute to the metabolic reprogramming of cancer cells through the crucial contributor, CTHRC1. We demonstrated that CTHRC1 activates the TGF-β/Smad3 signaling pathway in cancer cells, consistent with previous research [17]. Our study further elucidated that CTHRC1 interacts with TGFBR2 via its C-terminal region, recruiting TGF-β1 to activate TGF-β/Smad3 signaling, which in turn enhances glycolytic activity in cancer cells by upregulating HK2. These insights offer a deeper understanding of how the TME regulates cancer cell metabolism.
Increased glycolytic activity is closely associated with drug resistance [27, 29, 30]. Our research has demonstrated that cancer cells exhibit enhanced glycolytic activity in the drug-resistant microenvironment. Moreover, we observed that CAFs within the drug-resistant TME also undergo a metabolic shift towards glycolysis (data not shown). Consistent with previous reports of metabolic coupling between cancer cells and CAFs [31], we hypothesize that this coordinated metabolic shift contributes to lactate accumulation in the microenvironment, reinforcing EGFR-TKI resistance.
CAFs exhibit considerable heterogeneity and dynamism within the TME, with different microenvironmental factors inducing distinct CAF phenotypes that exert varying functions [6, 32]. Notably, our research identified lactate, produced during the process of glycolysis, as a key inducer of the CTHRC1 + CAF phenotype. Elevated lactate levels in the tumor environment are often associated with cancer progression and resistance to anticancer drugs [33]. Previous studies have shown that lactate promotes drug resistance by upregulating HGF expression in CAFs [31], though the underlying mechanisms were not fully understood. Our study uncovered that lactate directly activates Cthrc1 transcription in CAFs through histone lactylation, thus forming a CTHRC1/glycolysis/H3K18la positive feedback loop that drives EGFR-TKI resistance. Additionally, Hu et al. identified a CAF subpopulation with high expression of HGF and FGF7, which protects cancer cells from EGFR-TKI therapy [34]. Our findings show that this population also exhibits high CTHRC1 expression. Furthermore, we observed a modest increase in HGF expression in CTHRC1+ CAFs compared to CTHRC1- CAFs (data not shown). These results suggest that CAF subtypes contributing to EGFR-TKI resistance may share common characteristics, such as lactate induction and increased HGF expression. Our study proposes a novel positive feedback mechanism driving these CAFs, offering a potential therapeutic target for overcoming drug resistance.
Historically, broad-spectrum inhibition of CAFs in cancer treatment has not yielded satisfactory results [35, 36], highlighting the importance of precisely targeting specific CAF subtypes. Our study identified GA, a natural compound, as an effective inhibitor of CTHRC1+ CAFs. GA was shown to disrupt the CTHRC1/glycolysis/H3K18la positive feedback loop, thereby overcoming EGFR-TKI resistance. Natural compounds like GA, which are low-cost and have minimal side effects, are promising candidates for cancer treatment. GA, derived from the plant Garcinia cambogia, has previously been reported to exhibit broad-spectrum antitumor activity, including the inhibition of cancer cell proliferation, migration, and invasion, as well as the induction of apoptosis and autophagy [22,23,24]. Furthermore, GA has been shown to enhance the anticancer efficacy of erlotinib in lung cancer [37]. Our findings reveal a new biological target for GA, suggesting its potential as a natural therapeutic agent for overcoming EGFR-TKI resistance, warranting further investigation.
Furthermore, our study suggests that the level of CTHRC1+ CAFs in tumor tissues can be assessed through immunohistochemistry, in combination with classical fibroblast markers such as COL1A1. This approach could serve as a valuable biomarker for evaluating the sensitivity to EGFR-TKI therapy and the prognosis of lung cancer patients. Clinically, this means that patients could be stratified based on CTHRC1 + CAF levels, enabling more personalized treatment strategies and potentially improving patient outcomes.
Some potential limitations of this study must be noted. Our research primarily relied on PDX models in NOD/SCID/IL-2Rγnull (NSG) mice, as obtaining sufficient CAF quantities from clinical samples proved challenging. While these models allowed for effective study of cancer cell-CAF interactions within the TME, it is important to note that NSG mice lack functional immune cells. Additionally, although our study showed that CTHRC1- CAFs have minimal impact on EGFR-TKI efficacy, scRNA-seq analysis revealed that CTHRC1- CAFs comprise four distinct subgroups, excluding C1 fibroblasts. Further exploration of CAF heterogeneity and their diverse roles in EGFR-TKI resistance is needed.
In conclusion, this study identified a crucial positive feedback loop between cancer cells and CAFs that drives EGFR-TKI resistance in lung cancer. These findings underscore the importance of understanding the complex interactions between cancer cells and the TME, which could pave the way for new therapeutic strategies aimed at personalizing cancer treatment and delaying the onset of tumor resistance.
Methods
Clinical samples
Clinical sample collection procedures for this study were thoroughly reviewed and approved by the Ethics Committee of the First Affiliated Hospital of Nanjing Medical University (2023-SR-056). All participants provided informed consent. Clinical Cohort 1 comprised 22 patients, with lung cancer puncture biopsy specimens collected from individuals aged 32–79 years (median age: 63 years). Clinical Cohort 2 included 32 patients, with specimens obtained from individuals aged 32–80 years (median age: 64 years). The baseline characteristics of the patients in both cohorts, as well as the clinical information of the PDX donors, are detailed in Tables S2 and S3 (Supplementary Information).
Animal experiments
All animal experiments in this study were conducted in accordance with the guidelines and approvals provided by the Experimental Animal Welfare Ethics Committee of Nanjing Medical University (IACUC-2301010). PDX models were established using six-week-old NSG male mice. Tumor samples from donor patients (referred to as P0 tumors) were implanted subcutaneously into the NSG mice. Once the tumor growth reached approximately 800 mm³ (P1 tumors), these tumors were excised and re-implanted into new mice for subsequent passaging (P2 tumors). Stable passaging to the third generation (P3 tumors) was considered a successful transplantation. Cell line-derived xenograft models were constructed using 4-6-week-old female Balb/c-Nu/Nu mice. For co-injection experiments, PC9 cells (1×10⁶) were mixed with CAFs (3 × 10⁶) in 100 μL of phosphate buffer saline (PBS) and injected subcutaneously into the nude mice. For single-injection experiments, PC9 cells (4 × 10⁶) were injected subcutaneously into nude mice. All mice were commercially sourced and randomized into experimental groups upon arrival, and all animals within a single experiment were processed at the same time. The investigators were not blinded while the animal handlers were blinded to group allocation.
Cell culture
Primary CAFs and cancer cells were isolated from PDX tumor tissues. The tissues were finely cut into small pieces (1-2 mm in size) and digested in a medium containing 0.1 mg/mL of collagenase IV at 37 °C for 1 h. After centrifugation and resuspension, the cell suspension was incubated in advanced culture medium. After 1 h, the non-adherent cancer cells were carefully removed and seeded into a new culture dish. The isolated cancer cells were cultured in high-glucose DMEM medium supplemented with 10% fetal bovine serum (FBS). The remaining adherent fibroblasts were passaged and cultured in DMEM/F12 medium with 20% FBS. After three passages, the fibroblasts and cancer cells were deemed purified and ready for further experimentation. The purity of fibroblasts and cancer cells was evaluated by flow cytometry and immunofluorescence staining. Lung cancer cell lines PC9 and HCC827 were obtained from the American Type Culture Collection and cultured in high-glucose DMEM and RPMI-1640 containing 10% FBS, respectively.
ScRNA-seq analysis
The scRNA-seq data utilized in this study were derived from previously published datasets. Seurat was employed for data pre-processing, clustering and visualization [38]. Known cell lineage-specific marker genes were used for cell type annotation. InferCNV was utilized to estimate cellular copy number variations (https://github.com/broadinstitute/inferCNV). CellChat was applied to infer and analyze ligand-receptor interactions between different cell types [39]. Monocle was used to explore the differentiation and functional trajectories of CAFs [40]. scMetabolism was used to assess the metabolic activity of cancer cells [41]. All data analyses were based on the open-source software R.
Bulk RNA sequencing analysis
Total RNA was extracted from PC9 cells and CAFs using the TRIzol reagent. RNA libraries were prepared and sequenced on the NovaSeq 6000 platform. The sequencing reads were mapped to the human genome reference (GRCh38) for PC9 cells and to the mouse genome reference (GRCm39) for CAFs using the STAR aligner. Differential gene expression analysis was performed using DESeq2. Pathway enrichment analysis was conducted using clusterProfiler. Gene Ontology (GO) terms and Kyoto Encyclopedia of Genes and Genomes (KEGG) pathways were used for the enrichment analysis. The gene sets for GO and KEGG were obtained from the Molecular Signature Database at www.broadinstitute.org/gsea/msigdb. TCGA-LUAD RNA-seq transcriptome data and corresponding clinicopathological parameters of LUAD patients were obtained from the TCGA database (http://cancergenome.nih.gov/). RNA-seq data of osimertinib-resistant versus parental, sensitive lung cancer cells was downloaded from the GEO database (http://www.ncbi.nlm.nih.gov/projects/geo/). The CTHRC1 + CAF signature was established using the GSVA algorithm based on all upregulated marker genes from CTHRC1+ CAFs in scRNA-seq data (with p-value < 0.05 and log2FC > 0.25).
Nontargeted metabolomics analysis
The non-targeted metabolomics was performed by Biotree Tech (Shanghai, China). Metabolites were extracted from PC9 cells using an extraction solution composed of methanol, acetonitrile, and water in a 2:2:1 ratio. The extracted metabolites were analyzed using liquid chromatography-tandem mass spectrometry. Specifically, a UHPLC system (Vanquish, Thermo Fisher Scientific) was employed, coupled with a Waters ACQUITY UPLC BEH Amide column (2.1 mm × 50 mm, 1.7 μm). Detection and quantification of metabolites were carried out using an Orbitrap Exploris 120 mass spectrometer (Thermo Fisher Scientific). MS/MS spectra were acquired in information dependent acquisition mode. The raw mass spectrometry data were converted to mzXML format using ProteoWizard and processed using XCMS package. Following data processing, metabolites were annotated using an in-house MS2 database known as BiotreeDB. The processed metabolomics data were further analyzed using MetaboAnalyst 6.0.
Plasmid transfection
Cthrc1-specific shRNA plasmids, HK2-specific shRNA plasmids (Table S4, Supplementary Information) and control shRNA plasmids were synthesized by GeneChem Company (Shanghai, China) and verified by Sanger sequencing. Transfection was performed using FuGENE HD transfection reagent (Promega, Cat# E2311) according to the instructions. The knockdown efficiency was verified by qPCR.
Short interfering RNAs transfer
Short interfering RNAs (siRNAs, Table S4, Supplementary Information) were designed and synthesized by Tsingke (Beijing, China). Transfection was performed using Lipofectamine 2000 transfection reagent (ThermoFisher Scientific, Cat# 11668500) according to the instructions. The knockdown efficiency was verified by qPCR.
Co-culture experiments
A 6-well transwell plate system with a 0.4 μm pore size (Corning Incorporated) was used for the co-culture experiments. Depending on the experimental objective, CAFs and cancer cells were seeded in the upper and lower chambers of the transwell system, respectively. Cells seeded in the lower chambers were used for subsequent analysis.
Flow cytometry
Tumor samples were harvested from PDX models. The tissues were cut into small pieces (1-2 mm) and digested in a medium containing 0.1 mg/mL collagenase IV at 37 °C for 1 h. After digestion, the cell mixture was filtered through a 70-μm cell strainer to obtain a single-cell suspension. To ensure the viability of the isolated cells, they were stained with Fixable Viability Dye eFluor 780 (ThermoFisher Scientific, Cat# 65-0865-14) in PBS containing 1% FBS at 4 °C for 30 min. For surface marker staining: the single-cell suspension was resuspended in PBS containing 1% FBS and then stained with fluorochrome-conjugated antibodies targeting surface markers for EpCAM (BD Pharmingen, Cat# 566658), CD31 (BD Pharmingen, Cat# 561410), CD45 (BD Pharmingen, Cat# 553080) and PDGFRβ (BD Pharmingen, Cat# 558426) for 30 min at 4 °C. For intracellular staining: cells were fixed and permeabilized using the BD Cytofix/Cytoperm Fixation/Permeabilization Solution (BD Pharmingen, Cat# 554714) and then stained with primary antibodies at 4 °C for 30 min, including rabbit anti-human EpCAM antibody (Abcam, Cat# ab223582), rabbit anti-mouse αSMA antibody (Abcam, Cat# ab7817), and rabbit anti-mouse CTHRC1 antibody (Cell Signaling Technology, Cat# 73930). After primary antibody staining, cells were incubated with secondary antibodies at 4 °C for 30 min, including Alexa Fluor 488-conjugated goat anti-rabbit antibody (Absin, Cat# abs20025) and BV421-conjugated donkey anti-rabbit antibody (Jackson ImmunoResearch, Cat# 711-675-152).
Cell growth and viability assay
Cancer cells were seeded in 96-well plates at a density of 3000 cells per well. After 12-h incubation, cells were treated with increasing concentrations of osimertinib (from 0.01 nM to 10 μM, MedChemExpress, Cat# HY-15772) for 48 h. Then 10 μL of Cell Counting Kit-8 solution (Sigma-Aldrich, Cat# 96992) was added to each well and the cells were incubated at 37 °C for 1 h. The absorbance of each well was measured at 450 nm using a microplate reader (infinite M200 PRO).
Colony formation assay
Cancer cells were seeded in 12-well plates at a density of 30,000 cells per well. After 12-h incubation, cells were treated with or without the indicated drugs for 10 days. During this period, the culture medium with or without the drug was refreshed every 2-3 days. After 10 days of incubation, cells were fixed by 4% paraformaldehyde and then stained with Crystal Violet Staining Solution to visualize the colonies.
Apoptosis analysis
Cells treated with the indicated drugs were dissociated using 0.25% trypsin (EDTA-free). After centrifugation, the cells were resuspended in binding buffer and stained with the Annexin V-FITC/PI Apoptosis Detection Kit (Vazyme Biotech, Cat# A211-01) according to the manufacturer’s instructions.
Seahorse extracellular flux assay
Cells were pre-treated and seeded into Seahorse XF cell culture miniplates (Agilent Technologies). The glycolysis rate of the cells was assessed the next day using the Seahorse XF Glycolytic Rate Assay Kit (Agilent Technologies, Cat# 103344-100) according to the manufacturer’s instructions. The data were analyzed using Wave Desktop software (version 2.6).
Glucose uptake assay
Cells were incubated in glucose-free PBS for 1 h at 37 °C to deplete intracellular glucose and then stained with 50 μM 2-NBDG (MedChemExpress, Cat# HY-116215) for 30 min at 37 °C. After incubation, the stained cells were analyzed by flow cytometry.
Lactate measurement
Cell culture supernatant was collected from cancer cells cultured alone or co-cultured with CAFs. Tumor tissues were homogenized in lysis buffer and then sonicated on ice. The lysates were centrifuged at 12,000 g for 10 min at 4 °C and the supernatant was collected for lactate measurement. Lactate levels were measured using the L-Lactate Assay Kit (Sigma-Aldrich, Cat# MAK329) according to the manufacturer’s instructions.
Immunofluorescence
Paraffin-embedded samples were sectioned at 4-μm thickness. Antigen retrieval was performed using Citrate Antigen Retrieval Solution (pH 6.0) at high temperature for 15–20 min. Then the sections were incubated in PBS containing 5% goat serum for 1 h at room temperature. For immunofluorescence staining of cells cultured in vitro, cells were fixed with 4% paraformaldehyde, washed with PBS, permeabilized with 0.1% Triton X-100 in PBS and blocked with PBS containing 5% goat serum for 1 h at room temperature. For immunofluorescence, by using the Five Color Multiplex Fluorescence Immunohistochemical Staining Kit (Absin, Cat# abs50013) according to the manufacturer’s instructions, samples were incubated with antibodies against pan-CK (Abcam, Cat# ab7753), COL1A1 (Abcam, Cat# ab316222), CTHRC1 (Abcam, Cat# ab256458), COL10A1 (Proteintech, Cat# 26984-1-AP), POSTN (Abcam, Cat# ab315104), COL11A1 (Servicebio, Cat# GB113041-100), SMAD3 (Cell Signaling Technology, Cat# 9523), TGFBR2 (Abcam, Cat# ab216483), TGF-β1 (Abcam, Cat# ab215715) and H3K18la (PTM BIO, Cat# PTM-1406RM). DAPI was then used to counter the nuclei. For TUNEL assay, slides were stained using the TUNEL Bright Red Apoptosis Detection Kit (Vazyme Biotech, Cat# A113-01) according to the manufacturer’s instructions. All images were acquired using a laser scanning confocal microscope (LSM880 Zeiss) and further analyzed using ImageJ software.
The total number of CAFs and the number of CTHRC1-positive CAFs in tumor sections from NSCLC patients were assessed by COL1A1 staining or co-staining of CTHRC1 and COL1A1 using ImageJ, as previously described [42]. Briefly, nuclei were defined in the DAPI channel. Using the “Cell Counter” plugin of ImageJ, the total number of CAFs was measured by counting the spots with COL1A1 staining, and the number of CTHRC1+ CAFs was measured by counting the spots with co-localization of COL1A1 and CTHRC1 in five randomly selected fields of each sample. The proportion of CTHRC1+ CAFs was calculated by dividing the number of CTHRC1+ CAFs by the total number of CAFs. The high and low CTHRC1 + CAF groups were classified based on the median proportion. Relative H3K18la levels were determined by comparing the fluorescence intensity of H3K18la to that of DAPI (target fluorescence intensity at 488 nm absorbance/ DAPI intensity at 405 nm absorbance) in five randomly selected fields of each sample. The high and low H3K18la intensity groups were classified based on the median value.
Hematoxylin and eosin and immunohistochemistry staining
Paraffin-embedded samples were sectioned at 4-μm thickness. For hematoxylin and eosin (HE) staining, after deparaffinization and rehydration, tissue sections were stained with Hematoxylin Staining Solution for 5 min, followed by Eosin Staining Solution for 3 min. For immunohistochemical staining, antigen retrieval was performed using Citrate Antigen Retrieval Solution (pH 6.0) at high temperature for 15–20 min. Then the sections were incubated with antibody against EGFR (Abcam, Cat# ab52894) overnight at 4 °C. The next day, DAB Horseradish Peroxidase Color Development Kit was used to visualize antibody binding according to the manufacturer’s instructions. Images were captured using a light microscope (Leica Microsystems).
Western blot
Proteins were extracted from indicated cells using cell lysis buffer, resolved by SDS–polyacrylamide gels, and then transferred to NC membranes. Primary antibodies (1:1000-1:5000) against phospho-SMAD3 (Cell Signaling Technology, Cat# 9520), SMAD3 (Cell Signaling Technology, Cat# 9523), β-actin (Cell Signaling Technology, Cat#3700), HK2 (Abcam, Cat# ab209847), CTHRC1 (Cell Signaling Technology, Cat# 73930), TGF-β1 (Abcam, Cat# ab215715), TGFBR1 (Abcam, Cat# ab235578), TGFBR2 (Abcam, Cat# ab216483), pan-Kla (PTM BIO, Cat# PTM-1401), H3K18la (PTM BIO, Cat# PTM-1406RM), and H3 (Abcam, Cat# ab1791) were used according to the dilutions recommended by the manufacturer’s instructions. Bound antibody was detected with peroxidase-labeled secondary antibody followed by chemiluminescence with the enhanced chemiluminescence kit.
qRT-PCR
RNA was extracted from the indicated cells. Reverse transcription was performed using a reverse transcription kit to synthesize the first strand cDNA. qRT-PCR assays were performed on a Q7 real-time PCR system (Applied Biosystems) with a 2X SYBR Green mixture. Data were normalized to the expression of ACTB/Actb. Primer sequences are shown in Table S4 (Supplementary Information).
Coimmunoprecipitation
PC9 cells were transfected with the CTHRC1 full-length expression plasmid and subsequently lysed in IP lysis buffer containing protease inhibitors. The lysate was collected, centrifuged at 13,000 g for 10 min at 4 °C, and the supernatant was transferred to a new tube for immunoprecipitation. For immunoprecipitation, anti-CTHRC1 antibody (Abcam, Cat# ab256458) was added to the lysate and incubated overnight at 4 °C, and rabbit IgG was used as a control. Pierce protein A/G magnetic beads were then added to the tubes and incubated for 1 h at room temperature. After washing with the lysis buffer, the immunocomplexes were resuspended in protein loading buffer and used for immunoblotting.
Co-culture immunoprecipitation assay
HEK-293T cells were transfected with the following plasmids: myc-tagged TGFB1 expression plasmid, HA-tagged full-length CTHRC1 expression plasmid, HA-tagged CTHRC1-ΔC expression plasmid, HA-tagged CTHRC1-ΔGXY expression plasmid, FLAG-tagged TGFBR2 expression plasmid and vector control. All plasmids were synthesized in Tsingke biotechnology company and verified by Sanger sequencing. Then the transfected cells were mixed in a 2:2:1 ratio: TGFB1-expressing cells (ligand):CTHRC1-expressing cells (ligand, full-length or mutant):TGFBR2-expressing cells (receptor). After co-culturing for 24 h with or without drugs as indicated, cell lysates were prepared with IP lysis buffer containing protease inhibitors. After centrifugation, the supernatant was collected and immunoprecipitated with anti-FLAG antibody (Abcam, Cat# ab125243) or control IgG, followed by immunoblotting with antibodies against myc (Abcam, Cat# ab9106) and HA (Abcam, Cat# ab9110).
Luciferase reporter assay
PC9 cells were co-transfected with the pGL3-HK2 reporter plasmids containing HK2 promoter or corresponding mutation sites and a phRL-TK-Renella luciferase control vector. CAFs were co-transfected with the pGL3-Cthrc1 reporter plasmid containing Cthrc1 promoter and a phRL-TK-Renella luciferase control vector. All plasmids were synthesized in Tsingke biotechnology company and verified by Sanger sequencing. After 48 h, cells were lysed in 1× passive lysis buffer (Promega) for 15 min and luciferase activity was detected using the Dual-Luciferase Reporter Assay System (Promega, Cat# E1910). Firefly luciferase activity of each sample was normalized to Renilla luciferase activity.
CUT&RUN assay
CUT&RUN was performed using the Hyperactive pG-MNase CUT&RUN Assay Kit (Vazyme Biotech, Cat# HD101-01). PC9 cells or CAFs were first incubated with ConA beads and incubated with anti-SMAD3 or anti-H3K18la antibody overnight at 4 °C. The next day pG-MNase was added to the samples to selectively cleave the DNA at regions close to the bound proteins, thus releasing these specific DNA fragments. Finally, the DNA fragments were released into the supernatant and purified for qPCR amplification. Primer sequences used in the qPCR experiments are shown in Table S4.
Molecular docking and virtual screening
For the molecular docking of protein-protein interactions, the interaction structure between human CTHRC1 (predicted by AlphaFold) and TGFBR2 (PDB: 1m9z) was predicted using ZDOCK 3.0.2. To identify compounds that might inhibit the CTHRC1-TGFBR2 interaction, a virtual screening was performed, where all prepared compounds were initially docked to the active site of CTHRC1 using Standard Precision mode to estimate the binding affinity between the protein and each ligand. Then the top-ranked compounds from the SP mode were subjected to Extra Precision docking to identify the most promising inhibitors.
Statistical analysis
Statistical analyses were carried out using GraphPad Prism software and R. For cell-based experiments, three biological replicates were performed unless otherwise specified. Sample size was chosen based on prior studies and previously published literature. To compare differences between two groups, the Student’s t-test was used. For comparisons involving multiple experimental groups, a one-way ANOVA model was applied. Tumor-growth curves were analyzed by two-way ANOVA test. Survival functions were estimated using the Kaplan-Meier method, and comparisons were made using the log-rank test. Data are reported including estimation of variation within each group. Continuous variables were presented as the mean ± standard deviation (SD). No data were excluded from the analysis of experiments. P values < 0.05 indicated statistical significance (*P < 0.05, **P < 0.01, ***P < 0.001, ****P < 0.0001).
Responses