Carbon emissions from urban takeaway delivery in China

Introduction
The Paris Agreement aims to limit the global temperature rise to either 1.5° or 2° above preindustrial levels. This target necessitates swift reductions in greenhouse gas emissions. The global food production and consumption system is responsible for one-third of global GHG emissions1,2,3, making it a significant industry to consider in achieving this objective. However, current trends in the global food system, such as the increasing popularity of online food delivery consumption, may impede greenhouse gas emissions reduction by the end of the century4.
In recent years, online food delivery has become the popular mode of urban food consumption in China, and Online-to-Offline (O2O) has quickly become a popular business model5,6. The O2O food market is experiencing rapid growth in China, with more than one-fifth of the population using online food delivery7. The adoption rate of online food delivery reached 52.7% in China by the end of December 2021, an increase of 36.20% compared to 16.5% at the end of 2015. This indicates that there is significant potential for growth in the future. China’s online food delivery market is rapidly growing, fueled by the development of three online delivery platforms—Meituan, Eleme, and Baidu—and advancements in e-commerce and mobile technologies8,9,10. Meituan has an increasing market share in the online food delivery industry, with an outstanding competitive advantage. In 2020, Meituan’s market share occupied 69% of China’s food delivery market, representing a 5% increase from 201911.
Despite the attractive potential of the O2O business, the pathways to understanding and reducing carbon emissions in such sectors remain unclear. Previous studies have estimated overall carbon emissions of food delivery in specific cities, but have often relied upon incomplete or limited data to fill or estimate the whole data12. To our knowledge, previous studies have assessed carbon emissions from urban takeaway packaging waste10. However, there has not yet been a detailed national assessment of the carbon emissions of food delivery transport. Therefore, there is an urgent need to assess national city-level carbon emissions generated from takeaway delivery. However, collecting the necessary data can be time-consuming, and incomplete if based on sampling data from each city. To address this gap, a model is necessary to estimate GHG emissions and identify the mechanisms behind urban takeaway delivery transport. Consequently, we have developed a model that integrates multiple sources of data, allowing us to produce the first detailed estimate for the transportation part of takeaway delivery and a comprehensive estimate of carbon emissions from cities’ takeaway delivery systems throughout China. The integration and mining of multiple sources of data provides an effective means of collecting information pertaining to takeaway delivery systems. Our model, which integrates data from multiple sources, is specifically designed to improve the accuracy of estimates for transportation-related carbon emissions from takeaway delivery systems. This is because it provides detailed data at a large spatial scale.
In this paper, we developed a method for estimating food delivery carbon emissions (FDCE) using the IPCC standard emissions factor method, which multiplies activity data with corresponding emission factors13,14. Additionally, we analyzed the factors that influence carbon emissions from urban food delivery by performing correlation statistical tests and sensitivity analyses on data from 2019. We also created a predictive model to estimate annual takeaway order volume (ATOV) and delivery distance per order (DDPO), which we evaluated by performing ten-fold cross-validation. To estimate carbon emissions from food delivery systems in 270 Chinese cities in 2019, we employed an integrated model that combines the machine learning predictive model with the FDCE model (ML-FDCE). We considered and propagated uncertainties throughout our analysis to enhance the reliability and robustness of the aggregated results and their associated uncertainties. Accounting for greenhouse gas (GHG) emissions is essential for promoting sustainability in the O2O food delivery industry. Using the Meituan order dataset and robust modeling for 2019, this study estimated the annual order volume of takeaway delivery and quantified GHG emissions from both transportation and packaging of takeaway deliveries in China from 2014 to 2035. Our projection under current conditions estimates that the annual O2O food deliveries in China will exceed 46.5 billion orders by 2035. Based on our model, we discuss the advantages and disadvantages, as well as the feasibility, of several scenarios. Additionally, we projected future GHG emissions until 2035 under various scenarios and propose effective policy options to mitigate transportation-related GHG emissions.
Results
GHG emissions from Chinese urban takeaway delivery
Employing the IPCC carbon accounting framework, we developed the FDCE model for estimating carbon emissions generated from urban food delivery transport, which includes GHG emissions generated by different types of delivery vehicles. Our FDCE model calculated the total transportation-related carbon emissions from takeaway delivery in 56 cities in 2019. Carbon emissions from food delivery vehicles with various energy types and performance, including electric bikes (EB), electric motorcycles (EM), and fuel motorcycles with different cc levels (FM1: below 50cc, FM2: 50–100cc, FM3: 100–150cc, FM4: 150–250cc, FM5: 250–400cc), were individually calculated. Our estimation indicated that takeaway delivery transportation in the 56 urban centers accounted for approximately 455 kt of CO2-equivalent (CO2e) in GHG emissions in 2019. Additional estimation indicated that, on average, per capita GHG emissions from food delivery are 0.011 kg, while per-order GHG emissions from takeaway delivery are estimated at 0.057 kg across the 56 cities. The calculated results for GHG emissions and order volume are presented below.
The results of our correlation analysis indicate a positive association between GHG emissions and order volume (R = 0.834, p = 1.25E-15), although some cities exhibit an apparent inconsistency in this regard (e.g., Chongqing, Zhongshan). Among the 56 cities examined, those located in South China tend to have higher order volumes and GHG emissions. Specifically, the top 10 cities with the highest order volumes and GHG emissions are Chongqing, Shenzhen, Beijing, Guangzhou, Shanghai, Zhanjiang, Chengdu, Haikou, Dongguan, and Foshan. Furthermore, we found that more economically developed cities tend to have higher levels of takeaway consumption and carbon emissions, with Chongqing, Shenzhen, Beijing, Guangzhou, Shanghai, and Chengdu being examples of this trend. Interestingly, we observed a significant positive correlation (R = 0.625, p = 2.6E-07) between cities’ gross regional product (GRP) and their GHG emissions.
Four of the top five cities with the highest GHG emissions per order are located in southern, rich areas, specifically Zhanjiang, Chongqing, Xiangyang, Zhongshan, and Huizhou. Conversely, the bottom five cities in terms of GHG emissions per order are predominantly low-income and underdeveloped cities, namely Shenyang, Suzhou, Shijiazhuang, Yinchuan, and Zhengzhou. Our analysis reveals an insignificant correlation between GHG emissions per order and the gross regional product (GRP) of the city (R = −0.133, p = 0.326). However, we observed a significant negative correlation between GHG emissions per order and the proportion of electric bikes used for delivery (R = −0.39, p = 2.75E-32) as well as a significant positive correlation with the average delivery distance (R = 0.920, p = 9.374E-24).
Our study reveals that all of the top five cities with the highest GHG emissions per capita are located along the southern coast, namely Zhongshan, Sanya, Zhuhai, Huizhou, and Shenzhen. Conversely, among the bottom five cities in terms of GHG emissions per capita, four are located in northern, less developed regions, specifically Jilin, Tangshan, Weifang, and Shijiazhuang. Analysis results indicate that GHG emissions per capita exhibit a significant negative correlation with the proportion of electric bikes used for delivery (R = −0.448, p = 5.31E-04), but a significant positive correlation with average delivery distance (R = 0.655, p = 4.209E-08). Additionally, we observe a positive correlation between GHG emissions per capita and order volume per capita (R = 0.592, p = 1.534E-06).
Overall, our analysis indicates that order volume is the primary factor influencing GHG emissions. However, we also identified significant variations across cities. Notably, despite ranking 8th in terms of order volume, Chongqing reports higher GHG emissions (No. 1) than Shenzhen (No. 2) and Beijing (No. 3). To investigate the drivers of these discrepancies, we conducted sensitivity analyses of key factors, including order volume, average delivery distance, and the proportion of electric bicycles used for delivery (Fig. 1).

a GHG emission estimate for 56 cities. The orange dots are shown on the right axis and indicate the takeaway order volume in the corresponding city in 2019. Each data is presented as mean values ± SEM based on 95% confidence intervals calculated by two-tailed t-tests (p < 0.05). n = 1000 emission observations based on Monte Carlo simulation. b GHG emissions per capita for 56 cities. c GHG emission estimates per order for 56 cities. d GHG emission maps for 56 cities.
City-level impact factors
The impact of city-level factors on GHG emissions from takeaway delivery transportation was analyzed using our model. We performed sensitivity analyses to describe the impact of takeaway order volume, delivery distance per order, and the proportion of various electric vehicles and fuel motorcycles on carbon emissions (as shown in Fig. 2). Our results show that the ratio of electric bicycles has a substantial and negative impact on GHG emissions from takeaway delivery, with an average coefficient of −2.35. Additionally, order volume and delivery distance per order both have a significantly positive impact on GHG emissions, with an average coefficient of 1.00. In Fig. 2b, c, we found that the ratio of electric bicycles is the critical factor for reducing per-order and per capita GHG emissions from takeaway delivery, with an average coefficient of −2.35. Delivery distance per order is also a key factor for reducing per-order and per capita GHG emissions from urban takeaway delivery, with an average coefficient of 1.00. Based on our analysis, the proportion of electric bikes and delivery distance per order are critical factors that significantly impact GHG emissions in urban takeaway delivery. To further understand the relationship between D, N, and r(EB) and GHG per order, the XGBoost regression model was constructed(R2 = 0.99), and the single-feature dependence relationship(see Fig. 2d–f) and two-feature interactions(see Fig. 2f–h) and their combination were uncovered. The results of the singer-feature analysis show that the average delivery distance has an increasing effect on GHG per order, the electric bicycle ratio has a promoting effect on GHG per order, and the order volume has little effect on GHG per order. The analysis of two-feature interactions shows that (g). when EB is more than 0.8, the delivery distance has a small impact on GHG emissions per order, but when r is less than 0.8, the delivery distance has a significant impact on GHG per order. (h). When D is less than 5, the order volume has no effect on the average delivery distance. However, when D is greater than 5, order volume has a decreasing effect on GHG per order. (i) order volume N has little effect on GHG per order.
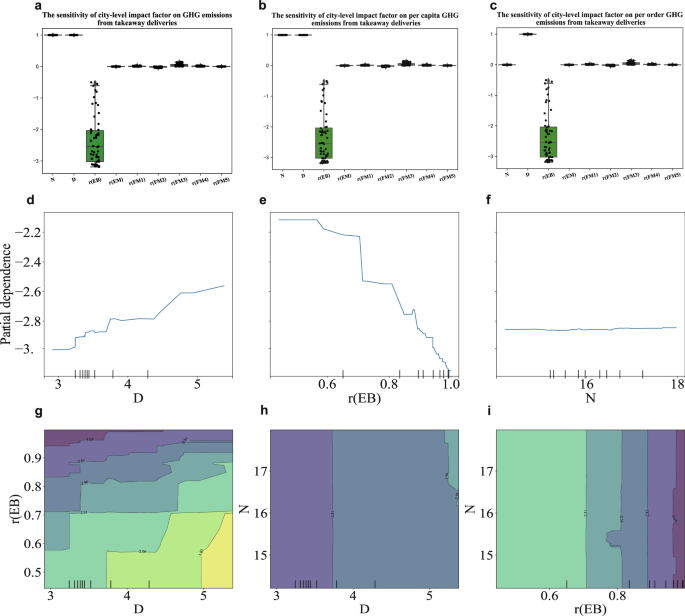
a the influence of city-level factors on GHG emissions. b the influence of city-level factors on GHG emissions per capita. c the influence of city-level factors on GHG emissions per order. d The influence of average delivery distance on GHG emissions per order. e The influence of the electric bicycle ratio on GHG emissions per order. f The influence of annual order volume on GHG emissions per order. N is takeaway order volume. D is the average delivery distance of takeaway. g The interaction between D and EB and their combined impact on GHG per order. h The interaction between D and N and their combined impact on GHG per order. i The interaction between N and EB and their combined impact on GHG per order. EB is the electric bike ratio. EM is the electric motorcycle ratio. The sensitivity coefficient data of a city is expressed as a black dot, and there are sensitivity data for 56 cities in total.
Further estimation of GHG emissions in the takeaway delivery from 270 cities where the primary data are not available
In this work, we developed a combined machine learning model consisting of the FDCE model and a machine learning model (ML-FDCE) to estimate takeaway order volume and GHG emissions from takeaway delivery transport in Chinese cities. We used machine learning methods to predict the city-level annual takeaway order volume (ATOV) and delivery distance per order (DDPO), which were then used as inputs into FDCE models to estimate takeaway delivery carbon emissions. To build the ATOV and DDPO predictive models, we collected data from 270 cities covering 8 dimensions: economy (E), population (P), traffic road (TR), climate (C), area (A), operating status of catering industry (CA), communication facilities (CF), and takeaway search volume (TSV). We performed statistical tests of correlation to screen the input features for the ATOV models (see Supplemental Information Table 1). We then conducted a 10-fold cross-validation on the training set with nine widely used regression algorithms provided by the scikit-learn Python library15 and the eXtreme Gradient Boost package16 to select an ATOV prediction model. XGBoost was ultimately chosen as the optimal ATOV prediction model for subsequent analyses (see Fig. 3a, b) due to its high accuracy and low variance, as evidenced by its SHAP values and feature importance scores (see Fig. 3c, d).
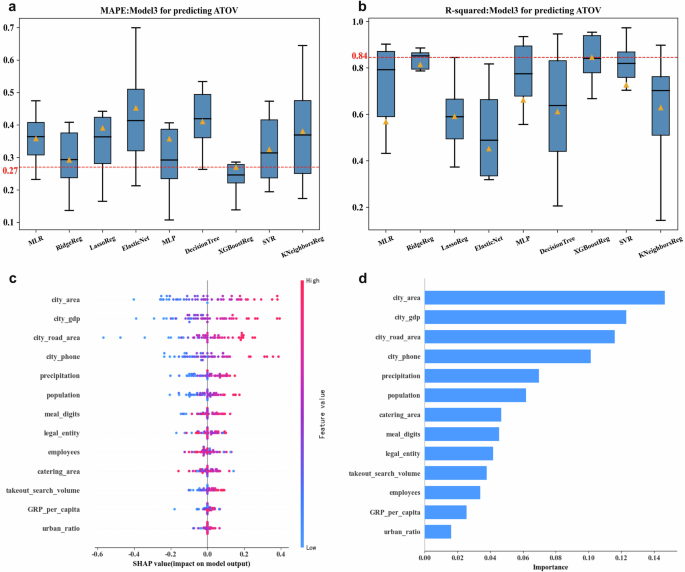
a MAPE of the 8-clock regression model. b R-square of 8 regression models. c SHAP value of factors in the Xgboost regression model. d The importance of factors in the XGBoost regression model. The orange triangle represents the average value of the corresponding index. Boxplots present model performance on the test set in ten-fold cross-validation. The red line shows the average level of model performance metrics for XGBoost.
According to Table 1, incorporating CF, SI, and CI into the model features can significantly enhance the interpretability and mean absolute percentage error (MAPE) of the model. Proposed Model 3 accounts for approximately 10% of the out-of-sample data, explains 84% of the variation in takeaway order volumes within each city, and has a mean absolute percentage error of 0.27, indicating a prediction accuracy of 73%. Regarding DDPO prediction, statistical correlation tests (see Supplementary Table 2) were performed to identify key factors such as model features. Eight machine learning methods were compared to identify the optimal model (i.e., K-Nearest Neighbors Regression with a MAPE of 0.06; see Supplementary Fig. 3 and Table 9) through 10-fold cross-validation. For both ATOV and DDPO models, we compared the performance of eight common machine learning models and performed a Diebold-Mariano test to ensure a significant advantage in the performance of the best model.
Using our trained annual takeaway order volume (ATOV) and delivery distance per order (DDPO) prediction models, we estimated the DDPO and ATOV of 270 cities, respectively (see Supplementary Figs. 12 and 13). We then input these values into the FDCE model to calculate GHG emissions for these cities, as demonstrated in Supplementary Fig. 14.
In terms of the interpretability of the model, Fig. 3c, d shows the importance of the features of the ATOV prediction model (XGBoost). The results show that, in terms of the contribution of a single feature to the prediction model, the urban built-up area has the highest contribution, followed by GDP, road area, mobile phone users, rainfall, a permanent population, catering industry area, number of meals, number of legal persons in the catering industry, search index of takeaway food, number of workers in the catering industry, per capita GDP, urbanization rate. Further, we classify these features into 8 dimensions, which are economy (E), population (P), traffic road (TR), climate (C), area (A), the operating status of the catering industry (CA), communication facilities (CF), and takeaway search volume (TSV). We input variable groups into the prediction model of ATOV in turn to observe the changes in R2 and MAPE of the model, which can reflect the influence of feature groups on the ATOV models (see Table 1). The baseline model, which only included the E, P, A, C, and T feature sets, had an R-square of 0.63 and a MAPE of 0.32. When we added the CF feature, R2 went from 0.63 to 0.81 and MAPE went from 0.32 to 0.29. Further, after adding SI features, R2 increased by 0.01 and MAPE decreased by 0.01. Finally, when CI features were added, R2 increased by 0.02 and MAPE decreased by 0.01. This shows that CF, SI, and CI contribute to the improvement of the interpretability and prediction accuracy of the model. In addition, see Supplementary Note. 8 for further model explanatory analysis using SHAP.
Discussion
In 2019, the urban takeaway delivery industry in Chinese cities generated approximately 1.67 MtCO2e emissions. According to the logistic growth model, annual takeaway consumption is projected to reach a staggering 46.55 million orders by 2035, resulting in an estimated 5.94 MtCO2e from urban takeaway delivery in China alone. Internationally, this exceeds the total annual GHG emissions output of some countries in 2019, such as Uganda and Mali, as reported by the World Bank. In China, it ranks 309th out of 339 Chinese cities in terms of annual GHG emissions. Given that the GHG emissions generated by takeaway delivery hinder the achievement of the 1.5°C degree goal, it is crucial to mitigate these emissions through reasonable policy regulation. Our results reveal that the transport part of takeaway delivery is responsible for 44.67% of the GHG emissions of the takeaway delivery(only in mobility-related transportation and packaging). Package-related GHG emissions make up the bulk of the emissions, accounting for 3.29 MtCO2e, while transportation-related GHG emissions accounted for 2.66 MtCO2e. In this work, we highlight the importance of transport-related carbon emissions from takeaway delivery, as our accounting results account for a larger proportion through detailed calculations of big data of takeaway delivery orders than in previous studies10,17. While package-related carbon emissions have been thoroughly discussed10, transportation-related carbon emissions require further exploration of potential mitigation strategies. The GHG emissions generated from the transportation of urban takeaway delivery accounted for about 0.36–4.82% of the GHG emissions of urban transportation(see Supplementary Fig. 28). This study examines a suite of strategies for reducing transportation-related GHG emissions of takeaway food deliveries through several scenarios that align well with the ongoing efforts to green the O2O food distribution industry. These scenarios include S1: replacing fuel motorcycles with electric motorcycles, S2: replacing fuel motorcycles with electric bikes, S3: fully promoting electric bikes and replacing all delivery vehicles with them, and S4: strengthening road traffic efficiency and merging the takeaway order algorithm by reducing delivery distance by 15% on average. These strategies, particularly S3 and S4 combined, have the potential to accumulate a reduction of 134 million metric tons CO2e. Policy intervention and market access mechanisms driven by enterprise regulation will be required to achieve these emission reductions.
Our findings reveal that in all of the 270 cities analyzed (as depicted in Fig. 4a), S1 reduces an average of 1.19 kilotons (KT) of GHG emissions per city and 321.87 KT in total. Similarly, S2 reduces an average of 1.32 KT of GHG emissions per city and 356.79 KT in total, whereas S3 reduces an average of 2.16 KT of GHG emissions per city and 585.31 KT in total. S4 reduces an average of 0.55 KT of GHG emissions per city and 148.66 KT in total. Notably, some of these mitigation strategies (S1, S2, S3) come at the cost of delivery time, with S1 increasing the delivery time by an average of 0.38 min per order in each city, S2 increasing delivery time by an average of 2.45 min per order, and S3 increasing delivery time by an average of 2.46 min per order. In contrast, S4 not only reduces GHG emissions but also delivery time, with a reduction of 1.43 min per order in each city. Likewise, S5 also reduces delivery time by an average of 0.66 min per order in each city, in addition to GHG emissions reduction of an average of 2.39 KT per city and 646.18 KT in total.
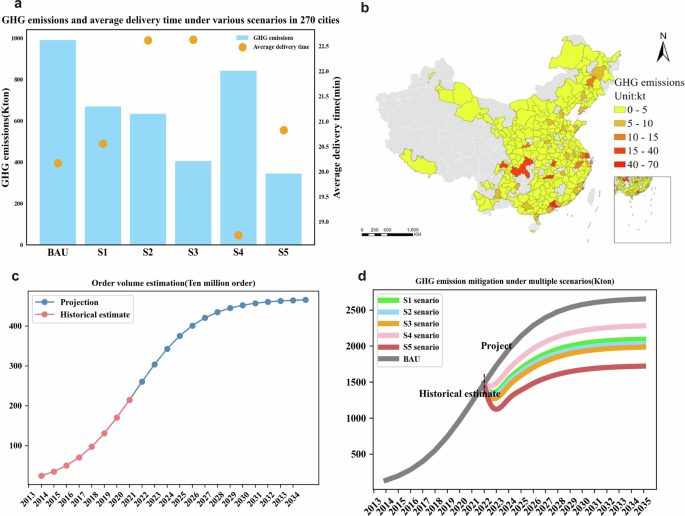
a The comparison of GHG emissions and average delivery times in 56 cities under six scenarios. b the comparison of GHG emissions and average delivery times in 270 cities under six scenarios. c historical estimate and forecast of the total annual order volume of takeaway food in China. d estimates and projections of annual carbon emissions from takeaway deliveries in China under six scenarios.
For all urban takeaway delivery businesses in China, the logistic growth model is utilized (refer to Supplementary Table 3 and Fig. 15) to estimate and predict the future total delivery order volume in China. This model is a justifiable approach to describe volume growth within the growth threshold, like urbanization, logistics, etc18. It is estimated that the total number of urban takeaway orders will reach 548.53 billion from 2023 to 2035, and its corresponding transportation-related carbon emissions will reach 31.27 MtCO2e (see Supplementary Table 5). To investigate the takeaway delivery industry’s progress and its GHG emissions in China, we performed five scenarios simulations (refer to Fig. 4d). Our findings reveal that GHG emissions from the sector could be reduced by adopting a variety of policies. Specifically, between 2023 and 2035, we estimate that they could reduce cumulative GHG emissions by 4.39–10.97 MtCO2e.
The scenario analysis yields several critical policy implications. Firstly, policies related to reducing and switching fuel consumption (S1, S2, S3) have the potential to decrease GHG emissions from takeaway food deliveries, particularly strategy S3 which entirely promotes electric bicycles and prohibits motorcycles. Although it could lengthen the delivery time of each order, it could be effective in reducing GHG emissions. Therefore, the O2O takeaway platform and the city government should collaborate to restrict motorcycle usage for food delivery purposes. Moreover, third-party platforms can stipulate that the delivery vehicles should be electric bikes and set entry-level requirements for the takeaway delivery industry. Secondly, optimizing traffic routes (S4) for O2O food delivery has the potential to synergistically optimize delivery time reduction and GHG emissions mitigation, improving the experiences of both consumers and drivers. The S4 strategy involves reducing the delivery distance for each order by optimizing traffic routes.
In order to simultaneously measure and compare the emission reduction potential of different cities, the reduction amount of carbon emissions per order is used as an indicator to measure the emission reduction potential (see Fig. 5a). From a city-scale perspective, we present carbon mitigation potential plots for 56 cities.
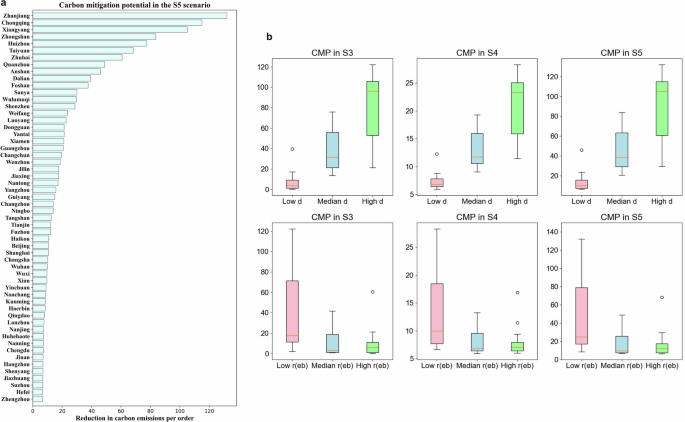
a Carbon mitigation potential (the amount of carbon emission reduction per order) ranked 56 cities. b urban carbon mitigation potential of the two policies and their heterogeneity. Here, we use the K-means clustering method to classify urban per-capita delivery distance (d) and electric bike usage rate [r(eb)] into three groups respectively, and then assess the carbon mitigation potential of the city groups.
From a city-scale perspective, we present carbon mitigation potential maps for 56 cities. The top five cities are Zhanjiang, Chongqing, Xiangyang, Zhongshan, and Huizhou. It can be found that they are among the top five in terms of the proportion of motorcycles that deliver vehicles, as well as the top ten in terms of the delivery distance per order. This suggests that cities with high delivery distances and a high proportion of motorcycles have a large carbon mitigation potential.
From the perspective of carbon mitigation potential based on average distribution distance grouping, we find that cities with higher average delivery distance have higher CMP. Among them, vehicle electrification has a higher CMP (reduced average of 79.03 g in high-d cities), followed by optimizing traffic routes, and the combination of the two strategies can reduce 88.54 g in cities with high delivery distances.
From the analysis of carbon emission reduction potential based on the proportion of trams in distribution vehicles, the carbon emission reduction potential of cities with a higher proportion of trams is higher. Among them, the CMP of vehicle electrification is higher CMP (reduced by 40.38 g in low-r(eb) cities), followed by the optimization of traffic routes, and the combination of the two strategies achieved an average of 47.70 g in cities with a high proportion of electric vehicle.
This study offers a breakthrough estimate and proposes several mitigation strategies for GHG emissions in China’s urban takeaway delivery industry. However, acknowledging some limitations, we outline areas for future research. Firstly, the built environment of a city has a significant impact on the transportation system19. By changing density and accessibility, transit systems could lead to an 8% decrease in vehicle miles traveled(VMT)18. Studies suggest that in terms of both statistical significance and practical importance, land use, and transportation policies have great potential for carbon mitigation. In addition, GHG emission per order is mainly positively correlated with DDPO, which is related to city size, density, and terrain. DDPO is significantly negatively correlated with urban road area(Spearman’s rho = −0.38, p = 0.003). For example, Chongqing is mountainous and the roads are all winding and winding, so the actual delivery route is much longer than the linear distance. Secondly, compared with purchasing food via using cars for individuals or families, takeaway delivery is obviously relatively low-carbon and environmentally friendly. Taking into account economies of scale in takeaway, in the production or cooking process, takeaway food may also be relatively low carbon, rather than cooking food for individuals or families. Therefore, overall, takeaway delivery should be the popular trend of the future for sustainable urban food systems. Still, takeaway delivery needs to further explore ways to ease environmental pressures, including transportation and packaging. Our suggested mitigation strategies cover delivery vehicles and traffic road efficiency, but minimizing and reducing unnecessary delivery of orders may still require future study. Carbon emissions could be reduced through developing appropriate household social responsibility (HSR) initiatives20, such as limiting household takeaway consumption or sharing one delivery for multiple households. Thirdly, the logistic growth model for future takeaway demand can be further refined by considering more factors like urban regional, and demographic differences. Fourthly, our results have demonstrated that machine learning modeling is a promising approach to investigate the GHG emissions in takeaway industries. Using this framework, we have expanded our estimate of takeaway delivery from 56 cities to 270 cities. Although there is still room for improvement in the accuracy of the proposed machine learning framework to predict the GHG of food delivery, the framework is novel and practical when the raw data is not available. Lastly, the environmental impacts of a company might be closely linked to firm-level corporate social responsibility (CSR) efforts21,22. Examining how various CSR initiatives or measures can affect the GHG emissions of the O2O food delivery industry can provide useful insights for firms to develop appropriate CSR strategies.
This paper makes an in-depth analysis of the GHG emissions of takeaway delivery. First, it reveals the key factors of GHG emissions of city-level takeaway delivery, including the share of electric vehicles in distribution vehicles and the average delivery distance, which will help to understand the generation of GHG emissions of takeaway delivery and provide insights for mitigation strategies. Second, detailed multi-source big data was used to evaluate the GHG emissions of food delivery in Chinese cities. Predictive models combining mechanistic modeling and machine learning were proposed, which would be helpful to estimate carbon emissions of city-level takeaway delivery when raw data are unavailable. In addition, the interpretability analysis helps to understand the potential links between takeaway order volume and delivery distance per order and climate-social-economic factors. Thirdly, a scenario analysis of five mitigation strategies for carbon emission reduction was set up to assess the GHG emission reduction potential of takeaway delivery at national and city scales. This would provide valuable insights into actual policy implementation.
Methods
This study constructs an FDCE model to measure carbon emissions and perform policy simulations of urban food delivery in China. FDCE modeling for food delivery operation and carbon emission process is mainly based on the following assumptions: takeaway delivery vehicles mainly include electric bicycles and motorcycles, and motorcycles are divided into electric motorcycles and fuel motorcycles. Through the analysis of delivery vehicles with different parameters and indices, FDCE modeling can simulate the corresponding carbon emissions based on the proposed scenario. Figure 6b shows the complete structure of FDCE modeling.
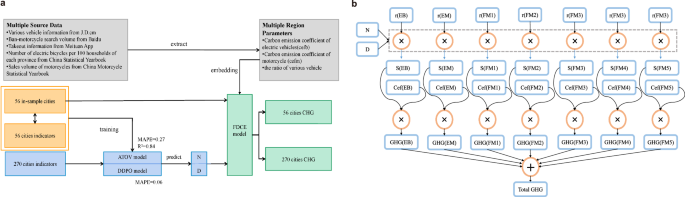
a An overview of models for estimating carbon emissions from urban takeaways. b FDCE(carbon emission model of food delivery). Cef(EB) is the carbon emission factor of the electric bike. EM is an electric motorcycle. FM1 is a fuel motorcycle with an engine displacement range below 50cc. FM2 is a fuel motorcycle with an engine displacement range from 50 to 100 cc. FM3 is a fuel motorcycle with an engine displacement range from 100 to 150 cc. FM4 is a fuel motorcycle with an engine displacement ranging from 150 to 250cc. FM5 is a fuel motorcycle with an engine displacement ranging from 250 to 400 cc. Cef(X) is the carbon emission factor for X(the takeaway delivery vehicle). r(X) is the city-level usage rate of X(delivery vehicle). S(X) is the total driving distance for X(the takeaway delivery vehicle). N is the city-level takeaway order volume. D is the city-level delivery distance per order.
System boundary for GHG emissions from takeaway delivery
In general, the carbon emissions of takeaway delivery systems include food production, transportation, processing, packaging, and waste disposal. In this work, we define the carbon emissions from urban takeaway delivery, only as the GHG emissions generated by actual delivery, including the GHG emissions generated from motorcycles/electric vehicles the energy consumption, and package consumption due to distribution need.
Data and model overview
In this work, the city-level food delivery carbon emission model(FDCE) integrating multi-source data is developed, for the first time, to estimate city-level takeaway delivery carbon emissions at the national scale in China. We collected the parameter information of 960 electric bikes and motorcycles from JD.com, the ban-motorcycle search volume from Baidu, the sales volume of motorcycles with various displacements from the 2019 China Automobile Industry Statistical Yearbook, and the number of electric bikes and motorcycles per 100 urban households from the statistical yearbook.
The FDCE model incorporates relevant parameters extracted from multiple regions and multi-source data for the calculation of carbon emissions. The Meituan takeaway dataset (see supplementary Note.1) comprises data from 56 cities, providing information on the order data and delivery distance per order (DDPO) for each city in 2019. The FDCE model utilizes both the annual takeaway order volume (ATOV) and DDPO of all 56 cities for the calculation of carbon emissions in those cities.
We examined the correlation between DDPO, ATOV, and urban indicators in 56 cities. We selected eight dimensions of city-level indicators, namely population, economic data, area data, climate data, road network data, communication facility data, catering industry operation data, and takeaway search volume. Economic indicators comprise of gross regional product (GRP), while the road indicators include road network density and area. Climate indicators for cities include average annual PM2.5 concentrations, annual rainfall, and average annual temperature. The communications facility indicator is based on the number of mobile phone users. Population data consist of urban permanent population and urbanization rate. Catering industry operating indicators include the number of restaurants, restaurant revenue, legal entities, employees, meal digits, and catering business area. The takeaway search volume is also used as a reference indicator for residents’ tendencies to order takeaway.
The prediction models of annual takeaway order volume (ATOV) and delivery distance per order (DDPO) based on the machine learning approach are constructed. By integrating the machine learning model with the FDCE model (ML-FDCE), the GHG emissions of 270 cities were estimated.
Estimates of motorcycle share at the city level
Here, we measured city-level intensity indicator of ban-motorcycle policy and the share of electric bikes and motorcycles for takeaway deliveries. In view of the traffic safety and different environmental burden of electric bikes and motorcycles, anti-motorcycle policies with different intensities have been implemented to alleviate GHG emissions in cities with different development levels. The search volume and text frequency data are used to characterize human behavior23,24, develop policy indicators (e.g., economic policy uncertainty, EPU)25, and improve forecasting performance26,27,28. The ban-motorcycle search volume was introduced to fill the gap due to the lack of city-level motorcycle proportion data to estimate the city-level usage ratio of electric bikes and motorcycles. By collecting and scoring the ban-motorcycle policies from 51 cities in 2019, the correlation analysis is performed between the scoring results and the ban-motorcycle policy index based on the search volume(see Supplementary Fig. 29). The results show that they have high positive correlation (R = 0.69, p = 1.79E-08) and ranking consistency. The Baidu ban-motorcycle search volume (BMSV) reflects and monitors the intensity of city-level anti-motorcycle policy implementation in cities(see Supplementary Fig. 16). From the map of the city’s ban-motorcycle-ban volume, we found that the regions with restricted motorcycle ban are mainly concentrated on the Pearl River Delta city cluster, the Beijing-Tianjin-Hebei city cluster, the Yangtze River Delta city cluster, and the Chengdu-Chongqing city cluster, which are the regions with relatively developed economy and large population.
In this study, we estimated the city-level usage ratios of electric bikes and motorcycles by combining provincial-level shares of electric and motorcycles with BMSV. This approach downscaled the share of provincial motorcycles to the city level, resulting in a more accurate estimation of city-level motorcycle shares. The estimated vehicle ratios consider the different anti-motorcycle policies implemented by various cities, ensuring consistency in adjusted vehicle shares across cities within the same province.
The ban-motorcycle Search Index (BMSI) was derived by dividing BMSV by the urban resident population.
The normalization of BMSI defines MT. (sigma) is obtained by performing Softmax mapping on the value of MT, which normalized the discrete probability distributions so that values add up to 1.
The estimated motorcycle percentage at the city-level is represented by CMP, which is derived by adjusting the provincial-level motorcycle percentage (PMP) through the incorporation of the ban-motorcycle indicator (σ). Here, ({PM}{P}_{k}) refers to the motorcycle percentage at the provincial-level, while N signifies the number of cities present in the province where city k resides (only 337 cities are taken into consideration in this study).
The usage rates of electric vehicles and motorcycles for all cities included in the study are defined as follows.
Based on analysis of the usage rates of electric vehicles and motorcycles, as recorded in Supplementary Fig. 17, the top five cities in terms of motorcycle usage are Zhanjing(0.556), Chongqing(0.527), Xiangyang(0.497), Zhongshan(0.433), and Huizhou(0.417), while the top five cities in terms of electric vehicle usage are Zhengzhou(0.997), Hefei(0.997), Hangzhou(0.995), Jinan(0.995), and Shijiazhuang(0.994).
Carbon intensity of electric bicycles and motorcycles
In order to estimate the energy consumption and environmental impacts associated with takeaway delivery within the city, we first analyze and model the energy use and performance of electric bicycles and motorcycles. Among the factors which impact the speed and energy efficiency of these vehicles are energy types and performance parameters. Delivery vehicles have been classified into three categories: electric bicycles (EB), electric motorcycles (EM), and fuel motorcycles (FM).
The analysis is based on a variety of vehicles, each with their own unique performance parameters. Included in this group are electric bicycles, designed to restrict speed to below 25 km/h and weight to below 55 kg29, as well as electric motorcycles which weigh above 55 kg30. Additionally, fuel motorcycles are categorized based on their engine displacement, with vehicles falling into FM1 having a displacement below 50cc, those in FM2 falling within the 50 to 100cc range, those in FM3 ranging from 100 to 150cc, those in FM4 ranging from 150 to 250cc, and those in FM5 having a displacement ranging from 250 to 400cc.
Performance parameters for the top 960 electric bicycles, 960 electric motorcycles, and 960 fuel motorcycles (ranked by sales volume) were collected by sorting through relevant products on the JD.com platform.
The data collected from JD.com on electric bikes and motorcycles include battery capacity, driving range, maximum speed, maximum engine power, and vehicle weight. To determine the average energy consumption efficiency of electric delivery vehicles (which includes both electric bicycles and electric motorcycles), the following equations can be used, based on the vehicle’s range (D) and battery storage (Q):
where U is battery voltage, Q is battery storage, E is battery power, D is the range of the vehicle, and (eta) is energy efficiency.
To estimate the fuel consumption of fuel motorcycles per 100 km, we used “The limits and measurement methods of fuel consumption for motorcycles and mopeds” (GB15744-2019)31 and a weighted calculation method (refer to Supplementary Fig. 18). Moreover, the average maximum speed of fuel motorcycles with different displacements was estimated based on data from the JD platform. Detailed results are presented in Table 2.
Using the energy efficiency parameters provided, we have calculated the greenhouse gas emissions per 100 km for different types of vehicles used in food delivery (refer to Supplementary Fig. 19).
Estimate of the various displacement motorcycles usage
To estimate usage ratios for different displacement motorcycles, we collected data on motorcycle sales volume (SV) according to displacement categories from the 2019 China Automobile Industry Statistical Yearbook. The sales volume proportion (SV) of motorcycles with varying displacements serves as a proxy for the usage ratio of the respective motorcycles.
where SV1 is the sales volume of electric motorcycle, SV2 is the sales volume of FM1, SV3 is the sales volume of FM2, SV4 is the sales volume of FM3, SV5 is the sales volume of FM4, SV6 is the sales volume of FM5, rm is the total usage ratio of all motorcycles, ({u}_{i}) is the rate of i-type motorcycle in all motorcycles, ({r}_{{mi}}) is the ratio of i-type motorcycle in all vehicles. For each city, the usage of motorcycles of all types is estimated as above.
Estimate the urban electric bicycle delivery distance and motorcycles delivery distance
In this study, we collected estimated delivery times (EDT) via the Meituan App by searching for food and beverage outlets within a three-kilometer radius of a dynamically changing anchor point within the city limits. EDT provides high spatial-resolution data over a large spatial scale, facilitating subsequent estimation of delivery distance per order (DDPO) at the city level.
Estimated delivery time (EDT) refers to the estimated time for a single delivery, while actual deliveries may be combined with other orders. The combined order algorithm used by the online-to-offline (O2O) platform can significantly enhance delivery efficiency, reducing the average delivery time per order. To examine the effects of merging order deliveries on delivery time per order, we applied the following conversion formula12 to adjust the average delivery time per order.
In the formula below, n represents the average number of orders that share a single delivery, α represents the proportion of orders that share a delivery, and β represents the proportion of single deliveries. For this study, we set the values for α, β, and n to 56.25%, 43.75%, and 3.5, respectively12.
The total delivery time can be calculated as the sum of the electric vehicle delivery time, delivery time for various types of motorcycles, and deliveryman waiting time, according to the following formula.
We can modify the formula by incorporating the usage ratio of various vehicles, annual order volume, and vehicle speed, as illustrated below.
The study utilizes a set of equations to calculate various usage ratios and delivery times for different vehicles. These include ({r}_{e}), the usage ratio of EB; ({r}_{m}), the usage ratio of all motorcycles; ({r}_{{em}}), the usage ratio of electric motorcycles; and ({r}_{m1}) through ({{r}_{m}}_{5}), the usage ratios of FM1 through FM5. Additionally, (N) represents the annual takeaway order volume(ATOV) in 2019. The calculation also involves the total delivery time for different vehicle types, such as ({t}_{e}) for electric bicycles, ({t}_{m1}) for electric motorcycles, ({t}_{m2}) through ({t}_{m6}) for fuel motorcycles of varying engine sizes, and (t) for total delivery time. There is also ({t}_{{wait}}), which represents the waiting time for delivery personnel to pick up goods. The study cites a research report by Zhiyan, which shows an average waiting time of 7.84 min per order and an average time of 2.76 min per order32 for delivering food on foot or waiting for consumers to pick up food. Thus, the wait time totals 10.6 min. The speed for each vehicle is set at 70% of its corresponding maximum, with the related speed uncertainty discussed further in the Uncertainties in Methods section.
In the equations above, ({r}_{e}) is the usage ratio of EB, ({r}_{m}) is the usage ratio of all motorcycles, ({r}_{{em}}) is the usage ratio of electric motorcycles, ({r}_{m1}) is the usage of FM1, ({r}_{m2}) is the usage of FM2, ({r}_{m3}) is the usage of FM3, ({{r}_{m}}_{4}) is the usage of FM4, ({{r}_{m}}_{5}) is the usage of FM5, (N) is annual takeaway order volume (ATOV) in 2019, ({t}_{e}) is total delivery time of electric bicycles, ({t}_{m1}) is total delivery time of electric motorcycles, ({t}_{m2}) is total delivery time of fuel motorcycles (below 50cc), ({t}_{m3}) is total delivery time of fuel motorcycles (51cc–100cc), ({t}_{m4}) is total delivery time of fuel motorcycles (101cc–150cc), ({t}_{m5}) is total delivery time of fuel motorcycles (151cc–250cc), ({t}_{{m}_{6}}) is total delivery time of fuel motorcycles(251cc–400cc), (t) is total delivery time and ({t}_{{wait}}) is the waiting time for delivery personnel to pick up goods. According to the research report of Zhiyan, the average waiting time is 5.88–9.80 min per order, with an average of 7.84 min per order. The average time of delivering food on foot or waiting for consumers to pick up food was 0.80–4.72 min per order, with an average of 2.76 min per order32. Therefore, the wait time totals 10.6 min. The speed for the various vehicles here are set at 70 percent of the corresponding maximum, and related speed uncertainty is assessed below(see Uncertainties in Methods).
By deconstructing formula 6, an estimation of delivery distance per order (DDPO) can be obtained.
An incongruity arises between the estimated delivery time (EDT) and the actual delivery time, leading to mismatches between d and the actual delivery distance per order. In a bid to minimize EDT-induced deviations as much as feasible, we estimated the DDPO range by employing EDT (please see Supplementary Note 2). The ensuing expression is presented below:
The median of the DDPO range estimated by the EDT is utilized as the final DDPO value. This value is fine-tuned to be as accurate as possible.
Furthermore, the total delivery distance traveled by electric vehicles and motorcycles is computed based on the DDPO, annual takeaway order volumes (ATOV), wait time for delivery personnel, and the corresponding vehicle usage ratios:
Estimate of GHG emissions from urban takeaway delivery
The Intergovernmental Panel on Climate Change (IPCC) has developed a unified framework for calculating global greenhouse gas emissions. This framework provides guidelines for determining the emissions resulting from human activities. To calculate these emissions, the following formula can be used:
This study calculates GHG emissions from takeaway food delivery in each city by summing up the emissions from electric bicycles, electric motorcycles, and fuel motorcycles (see Supplementary Note. 4). We then summarize the total emissions for each city.
Where (eta) is emission factors per kilomiters, package-related GHG emissions per order is calculated as 0.070610 (see Supplementary Note 3).
Sensitivity analysis of FDCE model parameters
Sensitivity analysis is performed to determine which model parameters should be the focus. The parameters for sensitivity analysis consist of (N), D, ({r}_{{eb}}), ({r}_{{em}}), ({r}_{{fm}1}), ({r}_{{fm}2}), ({r}_{{fm}3}), ({r}_{{fm}4}),({r}_{{fm}5}).
Sensitivity coefficient(S) is defined as:
Where (Delta {GHG}/{GHG}) is the rate of change of GHG, ({rm{and}}) (Delta x/x) represents the rate of change of uncertainty factors. When (Sleft({GHG},xright) > 0), GHG changes in the same direction as the uncertainty factor. When (Sleft({GHG},xright) < 0), GHG changes in the opposite direction as the uncertainty factor. The sensitivities of the results to these parameters are also evaluated. In addition, Xgboost regression model was constructed to understand the interaction between key factors [i.e. D, N, and r(EB)] and their combined effects, and one-way and two-way partial dependence plot was visualized.
Feature selection of ATOV prediction model
The set of considered features consists of variables related to takeaway consumption and its main drivers: economic factors, city area, population, weather, transport road, communication facility, catering industry operation, and takeaway search volume. The goal of the models was to provide accurate predictions to decision-makers and policy makers. To find suitable model features from the potential factors, correlation statistical tests (see Supplementary Table 1) were performed to screen significant factors. Such an approach is not expected to remove all multi-collinearity, but a tree-based method (XGboost) that is robust to high correlation between variables was subsequently used. The factors considered include the following:
1 Economic indicator. Two macroeconomic features were considered: annual Gross Regional Product (GRP) and annual GRP per capita. Data for the features were obtained from China Urban Statistical Yearbook. For cities, GRP was chosen to represent a city’s economic status due to its higher reliability.
2 Traffic road indicators. Two traffic road features were considered: the city-level annual road network density and road area. Data were obtained from China Urban Statistical Yearbook. For cities, the road network density and road area were chosen to reflect the level of development in urban roads.
3 Climate indicators. Three climatic features were considered: the city-level annual average PM2.5, precipitation, and temperature. The PM2.5 data were obtained from the Atmospheric Composition Analysis Group, Washington University, St. Louis3233. The temperature data were obtained from NOAA’s National Center for Environmental Information, while the rainfall data were obtained from the China National Meteorological Science Data Sharing Service Platform.
4 Catering industry operation indicators. Six catering industry operation features were considered: catering area, the number of restaurants, restaurant income, number of catering seats, the number of catering employees, and the number of legal entities.
5 Population indicators. We considered the city-level population on an annual basis and the urbanization rate as population features. We retrieved the data from the Wind Database.
6 Consumer search behavior. This study examines consumer search behavior in relation to takeaway consumption. Search behavior reflects consumers’ consumption preferences and can therefore be used as an auxiliary index for improving the predictive ability of consumers’ takeaway consumption behavior. The data was collected from the Baidu platform.
7 Communication facility indicator. Given that takeaway orders are predominately placed through mobile phones, the number of mobile phone users is a critical variable to consider when analyzing urban takeaway consumption. The data was retrieved from the China Urban Statistical Yearbook.
8 Area indicator. The size of a city’s built-up area reflects its capacity and the extent of its takeaway industry, with a significant, positive correlation observed between the two. The data was collected from the China Urban Statistical Yearbook.
City-level ATOV prediction models
In this study, we employed eight commonly used machine learning regression models to estimate annual takeaway order volumes. These models achieved a relatively stable level of accuracy, including: Multiple Linear Regression (MLR), Ridge Regression (RidgeReg), ElasticNet, Support Vector Regression (SVReg), Multilayer Perceptron Regression (MPReg), Decision Tree Regression (DecisionTreeReg), KNeighbors Regression (KNeighborsReg), and XGBoost Regression (XGBoostReg)34.
The 10-fold cross-validation method was utilized to assess the accuracy of the algorithm. The data set was divided into ten parts, with nine parts set aside for training data and one part for testing data. We employed grid search to select the parameters in machine learning predictive models.
In this work, the model performance evaluation indicators involved include Mean Absolute Percentage Error) MAPE and R2. MAPE is a measure of the accuracy of prediction models, with lower MAPE values indicating greater accuracy. R2 is a measure of the proportion of variation in the dependent variable that is explained by the independent variable, with a value range of 0 to 1.
Feature selection of DDPO prediction model
The considered features consist of DDPO-related variables screened using a statistical correlation test (refer to Supplementary Table 2 for details), such as Permanent population (Spearman’s rho = −0.27, p = 0.037), road network density (Spearman’s rho = −0.38, p = 0.003), temperature (Spearman’s rho = 0.34, p = 0.009), catering area (Pearson’s r = −0.37, p = 0.004), number of restaurants (Pearson’s r = 0.28, p = 0.030), meal digits (Spearman’s rho = 0.23, p = 0.077), and number of employees (Pearson’s r = 0.37, p = 0.004).
City-level DDPO prediction models
In this paper, eight commonly used machine learning regression models were used to estimate the mean delivery distance for urban takeaway delivery. The models achieved a relatively stable accuracy, that included Multiple Linear Regression (MLR), Ridge Regression (RidgeReg), ElasticNetCV, Support Vector Regression (SVReg), Multilayer Perceptron Regression (MPReg), Decision Tree Regression (DecisionTreeReg), K-Nearest Neighbors Regression (KNeighborsReg), and XGBoost Regression (XGBoostReg). 10-fold cross-validation is a common method used to test the accuracy of the algorithm. The results demonstrate that the model predicted with up to 94% accuracy (i.e., the MAPE is 0.06).
SHAP values
The SHAP(Shapley Additive exPlanations)35,36,37 framework is proposed and designed to interpret predictions made by complex black box machine learning algorithms. To measure the impact of features, we utilize SHAP values. Figure 4b displays a summary of SHAP values regarding feature importance and illustrates how each of these features affects the outputs of the model during simultaneous tests.
Estimating GHG emissions from urban takeaway deliveries
Using city-level takeaway order volume prediction model, DDPO and ATOV prediction model, as well as relevant indicators data for cities, we derive estimates of the annual takeaway order volume (ATOV) and delivery distance per order (DDPO) for urban takeaway delivery. Subsequently, we use our FDCE model to estimate each city’s GHG emissions resulting from takeaway delivery by inputting ATOV and DDPO.
Uncertainties
Key parameters in our study encompass the usage rates for different types of delivery vehicles, the waiting time for delivery personnel, the delivery distance per order, the volume of orders, and the velocity of delivery vehicles in use.
The magnitude of potential bias was analyzed through random sampling within a certain range for key parameters(see Supplementary Table 7). Monte Carlo simulation with 10000 samples was performed to characterize uncertainties associated with these parameters. The average deviation error across all simulations was found to be 13.19%.
To estimate carbon emissions from takeaway delivery in cities outside the sample, we use the ML-FDCE method, which is a combination of the FDCE model and machine learning. The estimation of ATOV and DDPO using the machine learning method leads to additional deviation and uncertainty, which expands the uncertainty of GHG estimation results. To evaluate the uncertainty of carbon emissions estimation from out-of-sample cities using the ML-FDCE method, we combined the MAPE value of the DDPO and ATOV models with the perturbation of other key parameters (see Supplementary Table 8) and then conducted a Monte Carlo simulation. Therefore, the average deviation error in estimating GHG emissions using the ML-FDCE method for takeaway delivery in cities outside the sample is 13.80%.
Scenario analysis
Our analysis using the FDCE model and sensitivity analysis has revealed that the number of orders, delivery distance per order, and proportion of electric vehicles are crucial factors that impact carbon emissions. Accordingly, we set specific model parameters for scenario analysis. In addition, we developed five scenarios to represent relevant strategies for GHG emission mitigation, as shown in Supplementary Table 5. Further details regarding the scenario settings can be found in Table 3.

Responses