Carbon sequestration in earth-based alkali-activated mortar: phase changes and performance after natural exposure

Introduction
Many countries including India, the UK, the USA, and the European Union have pledged to decarbonize their economies in the next 2–3 decades. However, cement and concrete material manufacturing remains one of the hard-to-abate sectors due to rising demands driven by rapid urbanization1. Buildings account for 39% of the global energy-related carbon emissions—28% originating during the operational phase and 11% is accounted for material extraction and construction. Moreover, due to unprecedented urbanization and gradually depleting natural resources, the embodied carbon associated with construction materials may contribute to 50% of the total emission by 20501. Despite the substantial contribution to greenhouse gas emissions, the embodied carbon has been under-addressed in the strategies to reduce building emissions.
As the manufacturing of ordinary Portland cement (OPC) accounts for a major fraction of CO2 emissions associated with cementitious construction materials, a shift to alternative low-carbon binders is necessary. Among non-OPC binders, alkali-activated binders (AAB) have the strongest potential of being applied in the near-term considering their techno-economic feasibility and the wider availability of the precursor minerals. AAB, which generally comprises calcium and alumino-silicate precursors produced as industrial by-products (e.g., ground granulated blast furnace slag (GGBS) and fly ash (FA)), can reduce embodied emissions while offering superior mechanical and durability properties compared to Portland cement-based materials2. Alkali-activated mortars (AAM) or concretes can be produced by mixing AAB with fine or coarse aggregates without requiring any special mixing facility. For instance, Danish et al.3 found that FA–GGBS-based AAM reduces global warming potential, acidification potential, and energy consumption by 29–35%, 4–29%, and 3–18%, respectively, compared to OPC-based mortars. However, the alkali activators and silicate solutions account for a large part of the embodied carbon associated with AAM. For instance, the manufacturing of 1 kg of sodium hydroxide (NaOH) accounts for a CO2 emission of 1.584–1.91 kg5. Luukkonen et al.6 reported that sodium silicate may contribute to 80–90% of the total environmental impacts associated with AAM, depending on the mix design and manufacturing processes. Among the industrial by-products, GGBS and FA are predominantly used as calcium and alumina-silicate precursors, respectively, due to their widescale availability and economic feasibility.
Besides CO2 emission, the construction material industry is also facing an acute shortage of natural sand. A potential way to reduce reliance on natural sand can be achieved by utilizing excavated soil from construction and demolition activities in AAM. Much of the urban constructions in major cities across the world are being done sub-surface, which generates a high amount of excavated soil and rocks7. Lateritic soil, commonly found in the humid and tropical regions of the globe, is rich in non-expansive clays (e.g., kaolinite) and can be used to replace part of natural sand in AAB-based materials. Aluminum and silicon from kaolinite can go into dissolution in a high pH environment due to the addition of an alkaline activator resulting in the formation of zeolitic phases including sodalites and hydrosodalites8,9. The use of lateritic soil in AAM enhances the geopolymerization by supplying aluminum (Al) and silicon (Si) species to the pore solution10. This results in longer Si–O–Al or Si–O–Si chains to form stronger calcium aluminosilicate hydrate (C-A-S-H) or sodium aluminosilicate hydrate (N-A-S-H) structure that provides enhanced mechanical and durability properties10. Alshaeer11 found that NaOH-activated kaolinite-based geopolymers offered dry and wet compressive strengths of 59 and 27 MPa after a two-phase treatment comprising of initial geopolymerization and immersion in an alkaline solution at 80 °C. Although the findings are encouraging, substantial variations in strength between dry and wet conditions indicate high moisture sensitivity, which may make its application challenging in humid conditions. Khalifa et al.9 cautioned that despite the similarity in clay type, the mineralogical compositions may vary which can have an appreciable influence on the strength and moisture sensitivity of alkali-activated materials under different exposure conditions (for instance, exposure to moisture and CO2).
Carbon capture, sequestration, and utilization (CCUS) technologies have received extensive academic and commercial interest in developing low-carbon construction materials12,13,14,15. These techniques allow accelerated carbon curing (ACC, henceforth called carbon curing (CC) in this research) of construction materials using industrial CO2-rich flue gas. In the process of carbon curing, abundant oxides and hydrates of calcium, sodium, and magnesium react with CO2 to precipitate carbonate minerals like calcium and sodium carbonates, locking the environmental CO2 in the material matrix for the service life of the infrastructures. Although CCUS has been extensively investigated for OPC-based materials, systematic study into its effects on micro-structural and engineering properties of soil-based AAM (with kaolinite clay) is limited. Cuccurullo et al.16 found that calcite carbon sequestration-induced precipitation has a stabilizing effect by bonding clay particles and reducing hydraulic conductivity through soil particles. This can be instrumental in lowering moisture sensitivity and enhancing the durability of soil–AAB mixes. During CC of AAM, the C-(A)-S-H and unreacted sodium oxide (Na2O) in the soil–AAM matrix will react with CO2 (concentration varying from 2 to 100%) to precipitate calcium carbonate (CaCO3), sodium bicarbonate (NaHCO3) and sodium carbonate (Na2CO3), which may lead to micro-structural densification. The reaction pathways are shown in Eqs. 1–517,18.
Beltrame et al.19 found that early-stage carbonation at 24-h age of metakaolin-based geopolymer for 6 h enhanced compressive strength by 25%, attributed to the refinement of pore sizes. Similarly, Razeghi et al.20 demonstrated that carbonation curing of alkali-activated slag-stabilized sandy soil at a pressure of 100 kPa and duration of 1 h increased unconfined compressive strength and the carbon sequestration increased with an increase in binder content. However, a detrimental impact of excessive carbonation leading to destabilization of the C(N)-A-S-H gel21,22 has also been reported.
Carbon sequestration potential and its effects on the engineering properties depend on changes in hydration phases and pore distributions. The formation of zeolitic phases due to the dissolution of Al and Si from clay (in soil) can change the phase compositions and the type of calcium carbonate polymorphs after carbon sequestration. Silicon and aluminum from clay (in lateritic soil) can be cross-linked to form more of sodium-alumino-silicate hydrates, which may impart different strength and shrinkage properties when subject to accelerated carbon curing or natural carbonation.
Thus, the research herein is a novel attempt to advance scientific understanding of the role of lateritic soil in carbon sequestration and phase composition of a NaOH-activated GGBS–FA system. This investigation is the first to examine the changes in mechanical strength, porosity, phase composition, and carbon sequestration due to long-term (1 year) exposure of earth-based alkali-activated samples to the outdoor environment. No systematic investigation into the effect of initial carbonation on the long-term performance of AAM could be found. By linking the alteration to the microstructure and pore size distribution to the bulk engineering properties including compressive strength, water-accessible porosity, and shrinkage, the findings will provide a solution to valorize excavated soil in new low-carbon constructions. The study also advances scientific knowledge into the chemical bonds and changes in phase compositions due to carbon curing and natural carbonation of GGBS–FA stabilized lateritic soil. This significantly influences the micro-structural properties and can serve as a basis for optimizing the mix compositions and carbonation process parameters in the future.
This article compares the effects of carbon sequestration and normal curing on the engineering properties of soil-based AAM (clay content of the soil (approx) 42%) including compressive strength, total shrinkage, and water-accessible porosity. Furthermore, thermogravimetric analysis (TGA) and micro-structural investigations are carried out by using 29Si nuclear magnetic resonance (NMR), X-ray diffraction (XRD), and scanning electron microscopy coupled with energy dispersive X-ray spectroscopy (SEM–EDS) to quantify the carbon sequestration potential and changes to the phase compositions.
Results and discussion
Soil properties
The pH, plastic limit (PL), and liquid limit (LL) of the soil evaluated as per IS 2720 part 2623 and IS 2720 part 524, respectively, are presented in Supplementary Table S1. Based on the PL (17%) and LL (32%), the soil is classified as low plastic lateritic clay-based soil (class: CL) according to the Unified Soil Classification System25.
The scanning electron image of the used soil (<75 µm) is shown in Fig. 1. The soil consists of rounded and some irregular particles. Based on energy dispersive X-ray (EDAX) analysis, the carbon content in the soil varied from 0.10 to 0.30 wt%, suggesting the presence of very little organic matter. The Al/Si atomic ratio, which is a critical parameter for geopolymerization of alumino-silicates, is in the range of 1–1.02 (Fig. 1). Based on the oxide composition by X-ray fluorescence spectroscopy (XRF), the soil mainly consisted of alumina (33.90%), silica (53.10%), and iron oxide (9.40%) (Supplementary Table S1). The clay content in the soil, measured by hydrometer analysis (IS 2720 part 4 (1985)26) was found to be 41.90 ± 0.60%. Based on XRD, reported in one of our published studies27, the lateritic clay-based soil primarily consisted of quartz and kaolinite with traces of montmorillonite.

Elemental compositions based on EDAX of Area 1 and Area 2 are shown in the right panel. Aluminium-to-Silicon atomic ratio (Al/Si) are shown.
Hydration of laterite clay-based geopolymer
Faster hydration kinetics should result in higher sequestration due to more available carbonatable hydration products. However, the release of higher heat during the exothermic hydration reaction can also lead to higher shrinkage, leading to more micro-cracking and permeability. This may drive up the extent of carbonation by allowing more ingress of CO2 into the matrix. The hydration kinetics and cumulative heat evolutions for the control and 25S-AAM paste mixes are shown in Fig. 2a. The exothermic peak (peak 1) appears right after the 8 M NaOH addition, which is attributed to the wetting and dissolution of slag28. Thereafter, a second peak (peak 2) appears during the acceleration phase of the reaction. This is attributed to the formation of C-(A)-S-H gels due to the combination of dissolved calcium and silica from the activated GGBS particles28. The bond dissociation energies of Ca–O, Al–O, and Si–O are 464, 512, and 798 kJ/mol, respectively29. Si–O is the predominant bond in FA, and therefore, requires a longer time to be dissociated compared to Ca–O and Al–O bonds in GGBS. The lower magnitude and delayed appearance of peak 2 in 25S-AAM compared to the control paste is ascribed to the reduced mass fraction of GGBS (75/126 = 0.59) compared to 0.75 in the control paste. This slows down the initial dissolution of Ca, Al, and Si, thus resulting in a lower rate of heat release. Reduced heat evolution may be beneficial in controlling the thermal shrinkage and cracks in soil-based alkali-activated materials during site construction, especially in warm climatic zones. However, the cumulative heat evolution after 7 days (168 h) is higher by 16% in 25S-AAM compared to the control. To confirm the effect of soil (<75 µm) on the hydration kinetics of GGBS and FA, respectively, GGBS–soil and FA–soil pastes were prepared and investigated for hydration kinetics (Fig. 2b). The addition of soil substantially enhances the hydration of GGBS, evidenced from 28% higher heat evolution of GGBS–soil paste compared to GGBS paste after 168 h. Furthermore, within the initial 1 h, soil–GGBS shows higher magnitude of peak 2 (Fig. 2b) compared to GGBS paste without a noticeable shift in the position. This demonstrates that fine clay grains can support early-age hydration of GGBS through filler effect and provide surface areas for precipitation of hydration products. However, FA–soil paste shows 22% lower heat evolution at the 168 h mark compared to FA paste. The findings demonstrate that higher hydration in 25S-AAM is contributed by the accelerated slag hydration due to the addition of clay and silt fraction in the soil (<75 µm). This can be explained by the SiO2/Al2O3 and Al2O3/Na2O molar ratios of the different mixes, presented in Table 1. 25S-AAM and GGBS–soil have lower SiO2/Al2O3 ratios (3.37 and 3.25) than the control paste (3.72) and GGBS paste (3.55), respectively, which have been previously reported to accelerate hydration and reduce the setting time30,31. Higher SiO2/Al2O3 slows down the reaction rate during dissolution and polycondensation stage. As SiO2/Al2O3 increases, the silicate species formed due to hydrolysis of SiO2 tend to condense among themselves and form oligomeric silicates. The oligomeric silicates condense with ({rm{Al}}({rm{OH}})_{4}^{-}) to form a 3D network of geopolymer products. However, the reaction rate is limited by condensation between silicate species as this is slower than the rate of condensation between aluminate and silicates32. Furthermore, Silva et al.31 found that Al2O3/Na2O ratios in the range of 0.80–1 are optimal for compressive strength development. 25S-AAM satisfies this range and demonstrates higher hydration within the initial 7-day period, which may positively contribute to the development of early-age strength.
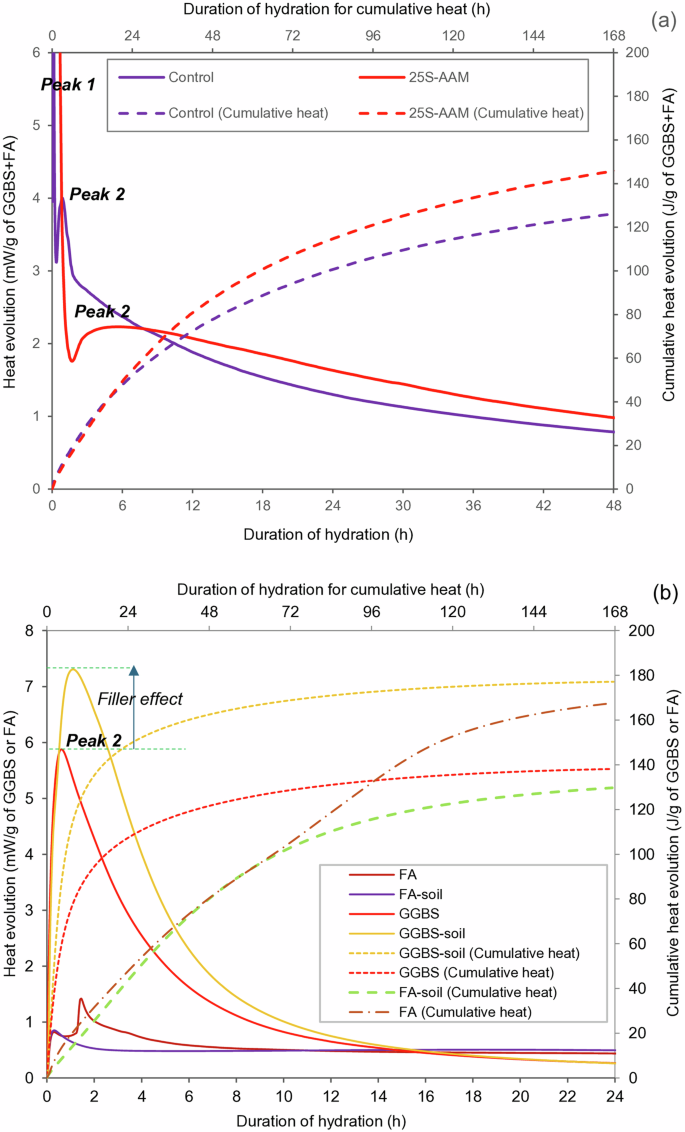
a Control and 25S-AAM, and b FA, GGBS, FA–soil (<75 µm), and GGBS–soil (<75 µm) activated by 8 M NaOH.
Despite an optimal SiO2/Al2O3 ratio (3.67 which is in the range of 3.4–3.831), FA–soil paste shows lower heat evolution compared to FA-paste between the 72 and 168 h mark. Because class F FA contains little calcium and both FA and soil are alumino-silicate compounds, the hydration kinetics will be influenced by the rates of ion dissolution leading to the formation of sodium alumino-silicates (N-A-S-H) and sodalites. It has been reported that much of SiO2 and Al2O3 in the kaolinite-rich soil remain undissolved due to their crystalline nature and limited penetration of NaOH through the lamellar structure of the kaolinite33. Based on isothermal calorimetry of NaOH-activated soil (<75 µm) (refer to Supplementary Fig. S1a), it is confirmed that the reactivity is significantly slower than NaOH-activated FA of similar solution-to-solid ratio. Furthermore, kaolinitic clays contain high internal and external surface areas of negative charge due to the presence of silicon tetrahedra. The silicon tetrahedra contain a net negative charge due to the isomorphous substitution of Si4+ cation by Al3+, which creates a charge deficiency. The net negative planes act as anions and absorb some of the sodium (Na+, from the activator solution) in the inter-layer spaces, thus creating an ionic inter-layer34. During the formation of N-A-S-H by alkali activation of alumino-silicate precursors, sodium acts as a charge balancer for the negative charge of ({rm{AlO}}_{4}^{-}). Lower availability of sodium in charge-balancing capacity will impede the formation of alumino-silicate gels, which explains lower heat evolution in NaOH-activated soil–FA compared to FA paste.
Carbon sequestration
Figure 3a, b shows the TGA and DTG profiles of normally cured (-N) and carbon-cured (-CC) control and 25S-AAM mixes at 1-d (just after carbonation) and 28-d ages, respectively. Control-N and 25S-AAM-N show DTG peaks between 60 and 180 °C, which are associated with the loss of moisture and decomposition of C-(A)-S-H35. In Control-CC and 25S-AAM-CC, the peak intensities in the mentioned temperature range are reduced due to the carbonation-induced drying and decalcification of hydrate gels. Instead, additional mass losses, evident from DTG peaks, are observed in Control-CC and 25S-AAM-CC at 120 °C and 180–184 °C, respectively (Fig. 3a, b), which are ascribed to the dehydration of thermonatrites and prissonite (Na2CO3·CaCO3·2H2O). Due to prolonged natural carbonation, the peaks in the range of 80–180 °C are much lower in magnitude for 393-d old samples (Fig. 3c) compared to those at 28-d age. The findings indicate more severe CO2-induced decalcification of hydrate gels. This can adversely affect the stabilization of clay minerals, which is also supported by XRD and FTIR (discussed later).
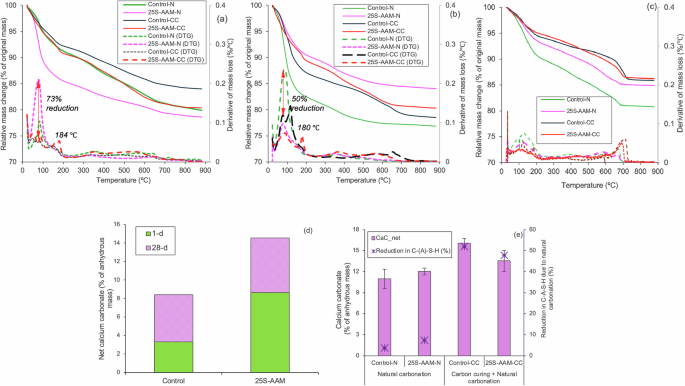
TGA and DTG curves of 25S-AAM and control at a 1-d age (just after carbonation), b 28-d age, and c 393-d age. d Net calcium carbonate precipitation at 1-d and 28-d. e Calcium carbonate and reduction in C-(A)-S-H content due to natural carbonation after 365 days of natural exposure.
Control-CC and 25S-AAM-CC show a broad hump between 450 and 700 °C (Fig. 3a), associated with the decarbonation of semi-crystalline calcium carbonate polymorphs, including vaterite and aragonite36. No peak is observed beyond 700 °C, suggesting minimal precipitation of stable calcite polymorph. A similar trend can be seen in the 393-d old samples (Fig. 3c). The peak intensities in the decarbonation regime are higher in 393-d mixes (Fig. 3c) compared to the 28-d counterparts (Fig. 3b), suggesting substantial carbon sequestration due to exposure to the natural environment.
The net carbonate mineralizations at 1-d and 28-d ages are shown in Fig. 3d. Note that the carbon sequestration quantified using TGA may be slightly underestimated because sodium carbonate also contributes to carbonate mineralization which is not completely accounted for in the calculations. First, the decarbonization of sodium carbonate starts around 550 °C and continues over a wide temperature range37. Second, it is challenging to estimate the distribution of sodium carbonate and calcium carbonate in the carbon-cured mixes. However, in the long term, carbon sequestration will be predominantly contributed by calcium carbonate because much of the sodium carbonates are either washed away or removed as efflorescence from both 25S-AAM-CC and 25S-AAM-N (Supplementary Fig. S1b–d) due to its high solubility (0.34 g/ml at 25 °C). In comparison, the solubility of calcium carbonate is only 0.00013 g/ml at 25 °C. 25S-AAM-N showed a higher mineralization potential (8.65% by mass of anhydrous paste) compared to Control at 1-d age (3.32%), which is attributed to the lower Ca/Si ratio in 25S-AAM-N. The Ca/Si atomic ratio reduces from 0.80–1.31 in Control to 0.43–0.54 in 25S-AAM-N (Supplementary Fig. S2a) due to the reduction in the relative mass of the primary calcium source, GGBS, from 0.75 to 0.59 (Table 1). Gels of lower Ca/Si ratio are more prone to be mineralized to calcium carbonate38, and hence contribute to higher carbon sequestration.
At 393-d age (Fig. 3e), average carbonate mineralizations of Control-N, 11%, and 25S-AAM-N, 12.02%, are substantially higher than 4.60% and 5.60% at 28-d age, indicating a significant natural carbonation of the alkali-activated materials during their service life. Due to prolonged exposure to atmospheric CO2, progressive conversion of C-(A)-S-H gel to mineral carbonates takes place, which is evident from the 3.50% and 7.30% loss in C-(A)-S-H at 393-d age with respect to that at the 28-d age (Fig. 3e). Slightly higher carbonate mineralizations of carbon-cured samples compared to normal cured ones after 393 days (Fig. 3e) suggest that combination of initial carbon curing and natural carbonation result into higher carbonate mineralization and substantial loss in C-(A)-S-H ranging from 48 to 52%. This is expected because initial carbon curing increases the pore volume (calculated based on the BJH model) of size <10 nm by 16% and 42% in the cases of Control-CC and 25S-AAM-CC compared to Control-N and 25S-AAM-N, respectively, at 28-d age. Pores of this size range constitute the gel pores and inter-hydrate pores39. Similarly, small and medium capillary pore volumes (size range of 10–100 nm) at 28-d age are 2.3–3.6 times that of the normally cured counterparts. The initial increase in porosity due to carbon curing allows further penetration of CO2 under natural exposure and triggers more decalcification and conversion of C-(A)-S-H gel to calcium carbonate.
Short-term and longer-term phase and micro-structural changes due to carbonation
The phase compositions in normally cured and carbonated mixes at 1-d, 28-d, and 393-d are shown in Fig. 4a–c. From Fig. 4a, precipitation of zeolite-Y (Faujasite–Na (Fn), Na7Al7Si17O48·32H2O) can be seen in the case of 25S-AAM-N at 1-d age, while this is not noticed in the case of Control-N. The zeolites formed in lateritic clay-based geopolymers can act as a surface for nucleation growth of hydration products enhancing the initial rate of hydration40. The formation of the Na-based zeolitic phase is attributed to the presence of clay in 25S-AAM-N. This is further confirmed by the presence of Fn peak in alkali-activated soil (A-soil-N in Supplementary Fig. S3a), while this is not observed in the case of alkali-activated fly ash (A-FA-N) and GGBS (A-GGBS-N, Supplementary Fig. S3a). 25S-AAM has higher SiO2/Na2O and Al2O3/Na2O ratios compared to the control (Table 1). Higher silica content with respect to sodium favors a higher degree of polymerization. Due to the higher surface area of clay than FA (Supplementary Table S1), some of the silica and alumina from the soil go into dissolution more readily. While silanol (Si–O–H) groups are formed due to the breakage of the silicon tetrahedra by NaOH, kaolinite contains reactive aluminol (Al–O–H) internal surfaces41. Higher availability of aluminate and silicate leads to the formation of zeolitic phases during the early stage of hydration. Due to carbonation (25S-AAM-CC), the Fn peak has disappeared and multiple peaks of thermonatrites (T: Na2CO3·H2O) and prissonites (P: Na2CO3·CaCO3·2H2O) are formed. A similar trend is seen by comparing A-Soil-N and A-soil-CC (Supplementary Fig. S3). This is attributed to two factors. First, due to accelerated carbonation, sodium-based aluminosilicates are converted to carbonate phases including pirssonite (P, Na2CO3·CaCO3·2H2O) and thermonatrites (Na2CO3·H2O) observed in Fig. 4a, b. Second, the unused NaOH is converted to mineral carbonates (Eqs. 2 and 3), including natrite and nahcolite, which also reduces the pH of the pore solution. Reduced pH lowers the concentration of Na+ in the pore solution and slows down the dissolution of alumina and silica, thus resulting in the formation of little or no Na-zeolite in 25S-AAM-CC. Besides sodium carbonate, meta-stable polymorphs of calcium carbonate including aragonite (A), vaterite (V), and some stable polymorph (calcite (C)) are formed. Predominant formation of meta-stable polymorphs due to carbonation of C-(A)-S-H is also confirmed from thermogravimetry. In Fig. 4a, b, the peaks associated with montmorillonite (M) at 19.93° and kaolinite (K) at 20.80° have become distinct in 25S-AAM-CC, indicating lower stabilization compared to 25S-AAM-N. Similar trends are observed by comparing A-Soil-N and A-soil-CC in Supplementary Fig. S3. Clay minerals are wrapped by hydrate gels including C-(A)-S-H and N-(A)-S-H produced as a result of alkali activation (explained through schematics in Fig. 4d). Due to the CO2-triggered decalcification the binder gels become progressively porous allowing further ingress of CO2, which triggers further decalcification of C-(A)-S-H and affects the integrity of the gel wrapping around the clay particles (Fig. 4d). Due to the CO2-induced degradation of the hydrate gels, the clay particles are exposed, which will negatively affect their stabilization. Second, due to the carbonation of slag-rich geopolymers (70% GGBS and 30% FA), the pH and the concentration of alkali cations (Na, Ca, and K) in the pore solution have been reported to reduce drastically (by up to 75%)42. These phenomena will slow down the dissolution and formation of hydration products, which have a negative effect on clay stabilization.
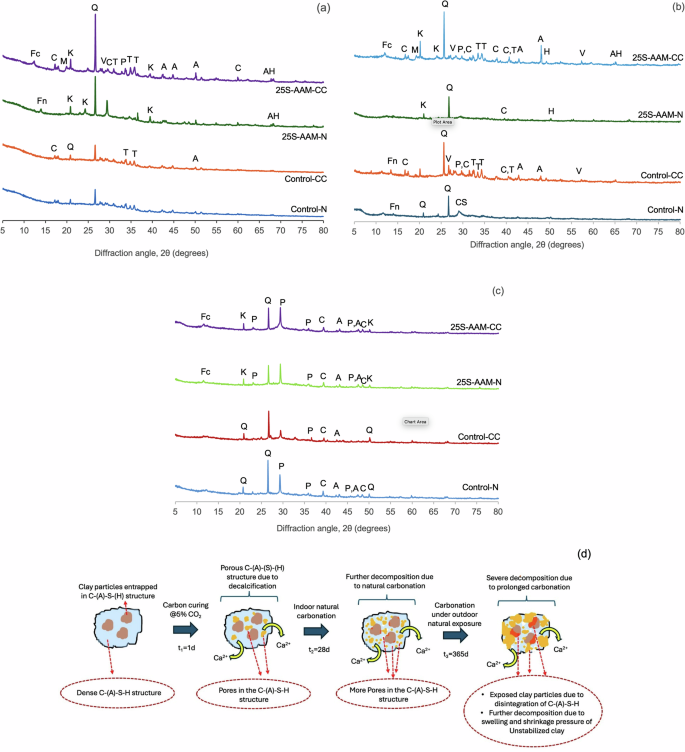
XRD spectra of Control-N, Control-CC, 25S-AAM-N, and 25S-AAM-CC at a 1-d age, b 28-d age, and c 393-d age (Fc: calcium-based Faujasite (Faujasite–Ca); A; Fn: Faujasite–Na (zeolite-Y); Q: Quartz (SiO2); H: hydrosodalite83; T: thermonatrites: Na2CO3·H2O, P: pirssonite (Na2CO3·CaCO3·2H2O); A: aragonite, CaCO3; V: vaterite, CaCO3; C: calcite, CaCO3; M: montmorillonite; K: kaolinite); AH: alumino hydrates; CS: calcium hydroxy silicates. d Schematics showing progressive deterioration of C-(A)-S-H gel and exposed clay particles with time.
After 365 days of outdoor exposure, a stark difference in the phase composition and microstructure compared to 28-d ambient curing conditions can be observed. Due to natural carbonation in the ambient CO2 environment (0.04–0.05%), distinct peaks of aragonite (A) and calcite (C) can be observed in Control-N and 25S-AAM-N (Fig. 4c). This is supported by the SEM micrographs in Fig. 5a, c. At the 28-d mark, precipitation of zeolite crystals (Al3HNa4O13Si3) can be observed in the case of 25S-AAM-N, confirmed by the elemental composition based on EDS (Fig. 5a). In comparison, after 365 days of natural exposure, cubic and rhombohedral crystals of calcium carbonate on the surface of 25S-AAM-N can be noticed (Fig. 5c). Similar precipitations are observed for Control-N too at 365-d mark (Supplementary Fig. S4a).
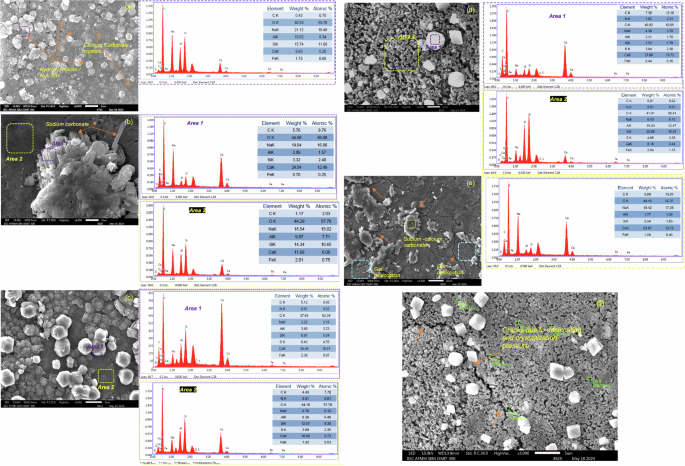
a 25S-AAM-N at 28-d age; b 25S-AAM-C at 28-d age; c 25S-AAM-N after 365-d of outdoor exposure; d 25S-AAM-CC after 365-d of outdoor exposure. EDS spectra of the crystals (Area 1) and the sheet-like hydration products (Area 2) are presented for (b)–(d). e Cracks in the proximity of sodium–calcium carbonate crystals in 25S-AAM at 28-d age. f Micro-cracks and gel degradation in the close vicinity of calcium and pirssonite crystals in 25S-AAM after 365-d of outdoor exposure.
Initial carbon curing has a strong effect on the microstructure after 365 days of natural exposure. Control-CC and 25S-AAM-CC show peaks of prissonite (P), calcite (C), and aragonite (A) with little or no presence of thermonatrites (Na2CO3·H2O) (Fig. 4c) unlike at 28-d age. Figure 5b shows needle-like and rod-shaped crystals on 25S-AAM-CC at the 28-d mark, which is typical of sodium carbonate. These could be an intermix of thermonatrite (Na2CO3·H2O) and pirssonite crystals (Na2CO3·CaCO3·2H2O) based on the presence of sodium, calcium, carbon, and oxygen in the EDS spectra (Area 1). In comparison, mostly rhombohedral and cubic crystals are visible on the surface of 25S-AAM-CC after 365 days, suggesting the presence of calcium carbonate polymorphs (Fig. 5d and Supplementary Fig. S4b). However, the EDS spectra and the elemental composition indicate the presence of sodium (4.38 wt%) along with calcium, carbon, and oxygen (Fig. 5d). It has been earlier reported that sodium can be incorporated into the defect sites of aragonite and calcite, although much easily in the case of aragonite due to its amorphous structure than calcite43,44. Notwithstanding the difficulty in differentiating calcium carbonate polymorphs based on morphology, the XRD spectrum of 25S-AAM-CC indicates a substantial presence of aragonite. The Na+ from the solution may be incorporated into the aragonite structure, which is known to stabilize aragonite and mitigate its transformation into a stable calcite polymorph45. The absence or little presence of sodium carbonates after 365 days can be attributed to two reasons—(i) washing away from the exposed surfaces during rainfall because of its higher solubility in water than calcium carbonate, and (ii) the dissolution of thermonatrites and nahcolite in the presence of Ca2+ (Eqs. 6 and 7), which can be released due to decalcification of C-(A)-S-H (because of prolonged natural carbonation) and hydration of GGBS. This phenomenon leads to internal carbonation, resulting in the precipitation of calcium carbonate46. Nguyen et al.46 observed that the generation of NaOH from pathways in Eqs. 6 and 7 may lead to further hydration and precipitation of less polymerized C-(A)-S-H. The findings indicate that the formation of calcium carbonate will mainly contribute to carbon sequestration as sodium carbonate will not be stable in the long term due to its dissolution and likelihood of erosion by environmental agents.
It is worthwhile to note that 25S-AAM-CC shows a highly porous gel structure after 365 days of natural exposure (Fig. 5d). Similar morphologies are observed at multiple sites (Fig. 5e and Supplementary Fig. S5b). These porous zones in 25S-AAM-CC have substantially lower calcium content (only 8.16 wt%, Fig. 5d) compared to the normally cured counterpart (18.66 wt%, Fig. 5c). At 28-d age, 25S-AAM-CC shows a densified gel structure with calcium content of 11.68 wt% (Fig. 5b), suggesting that substantial degradation of the binder gel through decalcification happened during the natural exposure period. In the cases of both Control and 25S-AAM, natural carbonation during 1 year leads to a reduction in the Ca/Si ratio; however, the Ca/Si ratio of 25S-AAM-CC after 365 days is much lower (0.25–0.30) than that of Control-CC (0.42, Supplementary Fig. S4a). Lower calcium content and high porosity can be attributed to severe decalcification of 25S-AAM-CC after 365 days. Figure 4c shows that sodium–calcium carbonates (pirssonite) are formed in 365-d old 25S-AAM-N and 25S-AAM-CC, evident from the peaks at 23.18°, 36.10°, and 47.70°. Furthermore, cracks in the hydrated gel are observed in close proximity to carbonate crystals at 28-d age and 365-d age of 25S-AAM-CC (Fig. 5e, f). These are desiccation cracks associated with carbonation shrinkage, which increases the permeability of the matrix to CO2. Therefore, the decalcifying effect of natural carbonation during the 365 days is exacerbated, as evident from the higher porosity of the matrix compared to that at the 28-d mark. This is also supported by the 2.2 times increase in pore volume in the size range of 10–100 nm for 25S-AAM-CC at 365-d from the 28-d mark (discussed later). The pore sizes in slag-rich alkali-activated materials typically vary from several nanometers (nm) to 2000 nm with a major fraction below 50 nm47. The crystallization pressure, ({P}_{rm{cr}}), in a cylindrical pore is inversely proportional to the pore radius, (r), which is expressed by Eq. 8 (assuming solid-solution contact angle to be 0 radians)48
where, ({gamma }_{rm{CL}}) is the surface energy of the crystals (sodium–calcium carbonate and calcium carbonates).
Considering the surface energy of aragonite to be 0.28 N/m at 25 °C49, ({P}_{rm{cr}}) due to its growth inside a pore of diameter 50 nm will be 22.40 MPa which will far exceed the tensile strength of a matrix with compressive strength of 22–30 MPa (in the case of 25S-AAM in this study). The tensile stress will be substantially higher for smaller pores. This will lead to the formation of micro-cracks, which can have a detrimental influence on long-term strength. A similar observation was made by Longhi et al.47 due to the formation of sodium carbonate (efflorescence) in geopolymer matrices. Furthermore, Bernal et al.38 reported that precipitation of sodium–calcium carbonate due to the natural carbonation of alkali-activated slag is associated with a high degree of self-desiccation and an increase in porosity. The comparisons indicate that initial carbon curing has a strong influence on the long-term integrity of C-(A)-S-H gel in 25S-AAM. The effect of initial carbonation on the chemical bonding and molecular structure is discussed in the following sections.
FTIR analysis
Figure 6a shows the FTIR spectra of control and 25S-AAM, subject to N and CC, at 1-d and 28-d age. 25S-AAM-N at 28-d age shows a broad hump at 1060 cm−1, which is known to be associated with N-A-S-H50. This hump is absent at 1-d age because N-A-S-H is unstable in the Ca2+-rich environment created by slag dissolution. Slowing down of slag reaction and gradual dissolution of clay and fly ash at later ages lead to delayed N-A-S-H formation.
a alkali-activated materials at 1-d and 28-d subject to normal curing (N) and carbon curing (CC). b Alkali-activated soil at 1-d and 28-d subject to N and CC c Alkali-activated materials after 365 days of natural exposure.
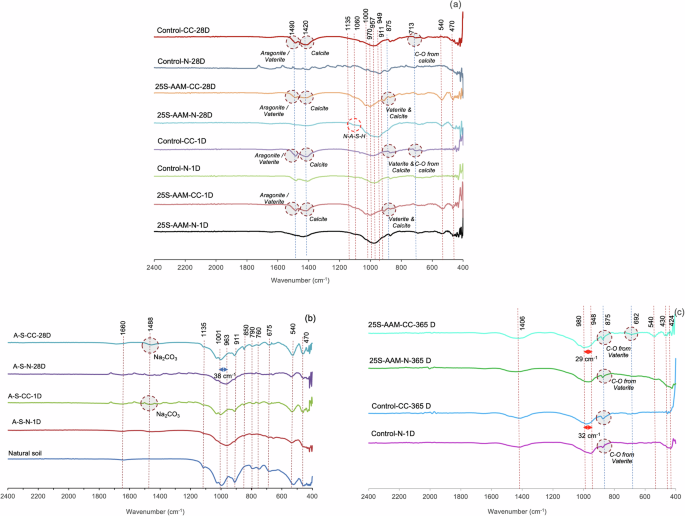
Most of the spectral changes due to carbonation can be observed at wavenumbers of 470 cm−1, 540 cm−1, 713 cm−1, 870 cm−1, 911 cm−1, 949–1000 cm−1, 1007–1135 cm−1, and 1420–1490 cm−1. The bands at the wavenumbers of 470, 540, and 911 cm−1 correspond to the bending and stretching vibrations of Si–O–Si and Si–O–Al bonds, which is mainly attributed to alumino-silicate precursors (for instance, clay) in geopolymer mixes51. 25S-AAM-CC at 1-d and 28-d marks show sharper peaks at the mentioned wavenumbers compared to 25S-AAM-N. A similar trend is also observed for carbonated alkali-activated soil (A-S-CC-1D and A-S-CC-28D, Fig. 6b) compared to the non-carbonated counterparts (A-S-N-1D and A-S-N-28D). This suggests that accelerated carbon curing results in lower stabilization of the alumino-silicate clay minerals, which is also supported by the XRD spectra (Fig. 4a, b) and discussed in later sections. Control-CC shows a narrow peak around 713 cm−1, unlike a broad hump in Control-N, which is ascribed to the formation of calcite52. Visible differences at this band cannot be observed for 25S-AAM-CC compared to 25S-AAM-N, suggesting a low content of calcite in 25S-AAM-CC. The band at 875 cm−1 is associated with overlapped peaks of vaterite, calcite, and sodium carbonates10,52. The hump peaks observed at 1420 cm−1 correspond to ({rm{CO}}_{3}^{2-}) attributed to the vibrational stretching of calcite while the band at 1490 cm−1 (Fig. 6a) corresponds to meta-stable polymorphs including aragonite, and vaterite53,54. The changes in band intensity at 1490 cm−1 are more evident than those at 1420 cm−1 suggesting predominant precipitation of meta-stable calcium carbonate polymorphs. This is also supported by the findings from TGA.
Ul Haq et al.55 reported that the band around 1488 cm−1 is associated with sodium carbonate. Sodium carbonate is expected to form through carbonation of zeolite and N-A-S-H formed as a result of clay and fly ash dissolution. Based on the FTIR spectra of alkali-activated soil (Fig. 6b), a broad hump with a low intensity can be seen. Similarly, the FTIR spectra of alkali-activated FA (solution-to-FA ratio of 1.00), subject to CC (A-FA-CC-1D and A-FA-CC-28D), do not show substantial difference with respect to A-FA-N-1D and A-FA-CC-28D (Supplementary Fig. S7). These indicate that the contribution of zeolitic and N-A-S-H phases to the total mineralization is minimal.
The broad hump between 949–970 cm−1 in 25S-AAM-N and Control-N, which is related to C-(A)-S-H and N-(A)-S-H10, is shifted to higher wavenumbers in 25S-AAM-CC and Control-CC (Fig. 6a). In the case of control mixes, the shifts at 1-d and 28-d vary from 19 to 22 cm−1, whereas in the case of 25S-AAM, the shifts due to carbonation are much higher at 35 and 48 cm−1, respectively. A summary of the shifts between 900 and 1000 cm−1 is presented in Supplementary Fig. S6. This is attributed to the decomposition of additional N-A-S-H and Faujasite (zeolite-Y) formed due to the introduction of clay (from the soil). XRD spectra (Fig. 4a) confirmed the decomposition of Faujasite (2(theta) = 14.58°) due to carbonation of 25S-AAM. This observation is also supported by similar shifts of 37 cm−1 for alkali-activated soil (A-S-CC-1D and A-S-CC-28D) after carbonation (Fig. 6b), which is ascribed to the decomposition of only N-A-S-H and zeolite (as C-(A)-S-H is absent).
After 365 days of natural exposure, Control-N shows a strong band intensity at 430 cm−1 (Si–O–Si and Si–O–Al bonds), suggesting that the fly ash is not completely dissolved. 25S-AAM-CC shows strong peaks at 430 and 540 cm−1, while no peak can be seen for 25S-AAM-N at these wavenumbers. This shows the presence of unstabilized clay after 393 days (28 days of lab curing + 365 days of outdoor exposure) in soil–AAM samples subject to initial carbon curing. Unbound clay in the AAM matrix will cause cyclic swelling and shrinkage due to wetting and drying during natural exposure. This phenomenon is known to cause internal stress, that may contribute to cracks and porous microstructure in 25S-AAM-CC at 365 days (Fig. 5d, e and Supplementary Fig. S5). Pores will provide pathways for the ingress of CO2 from the natural environment, leading to decalcification and severe desiccation. This is evident from the substantially higher volume of medium and capillary pores in 25S-AAM-CC than in 25S-AAM-N, which is discussed later in the article. 25S-AAM-CC shows a sharp peak at 692 cm−1, while all the mixes show broad hump centered around 1406 cm−1. Peaks and humps at these wavenumbers suggest the presence of pirssonite (sodium–calcium carbonate), which is reported to have a highly distorted structure56. 25S-AAM-CC and Control-CC show a broader and deeper band at 1406 cm−1 compared to 25S-AAM-N and Control-N, respectively, suggesting that initial carbonation has a strong influence on the precipitation of sodium–calcium carbonates during natural exposure.
29Si NMR
Figure 7a, b compares the 29Si NMR spectra of normally cured (-N) and carbonated (-CC) control and 25S-AAM at 1-d age (just after carbonation). The deconvoluted spectra are provided in Fig. 8. The relative area-based quantification was conducted and the mean chain length (MCL) was computed using Eq. 9 ((I) denotes peak intensity).
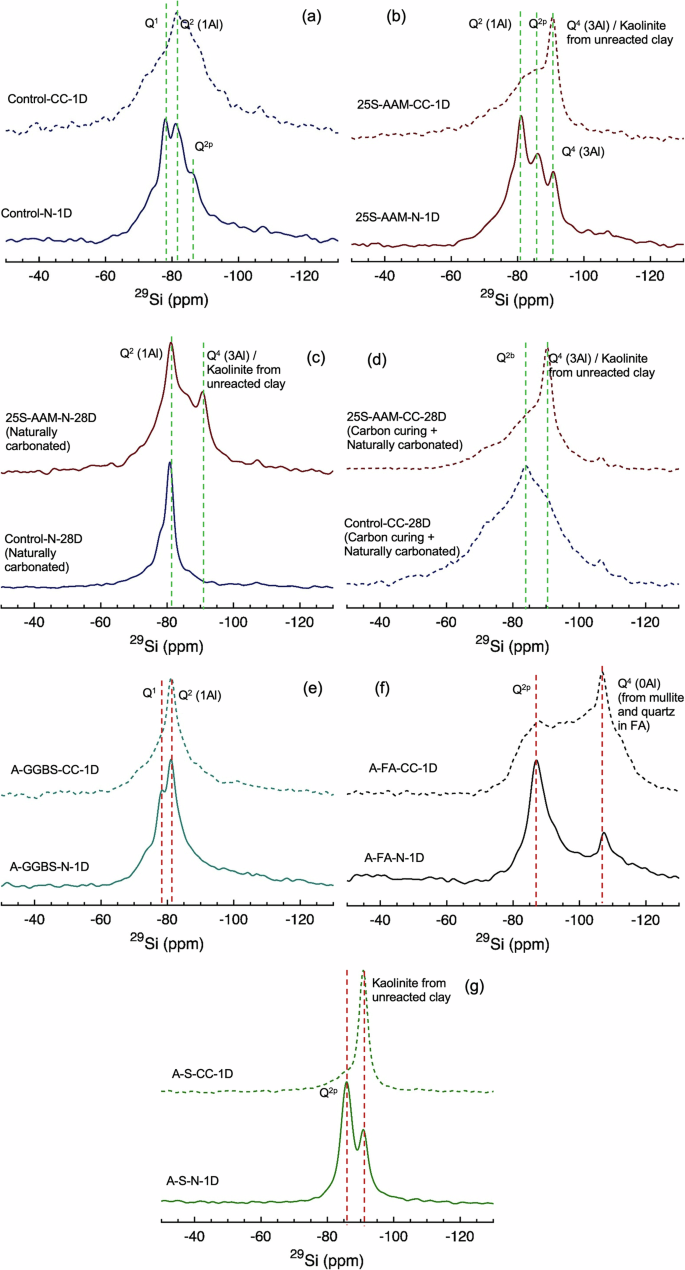
a Control-N and Control-CC at 1-d age (just after carbonation); b 25S-AAM-N and 25S-AAM-CC at 1-d age; c Control-N and 25S-AAM-N at 28-d age; d Control-CC and 25S-AAM-CC at 28-d age; e alkali-activated GGBS (A-GGBS): AGGBS-N and A-GGBS-CC at 1-d age (just after carbonation); f alkali-activated fly ash (A-FA): A-FA-N and A-FA-CC at 1-d age; g alkali-activated soil <75 µm (A-S): A-S-N and A-S-CC at 1-d age.
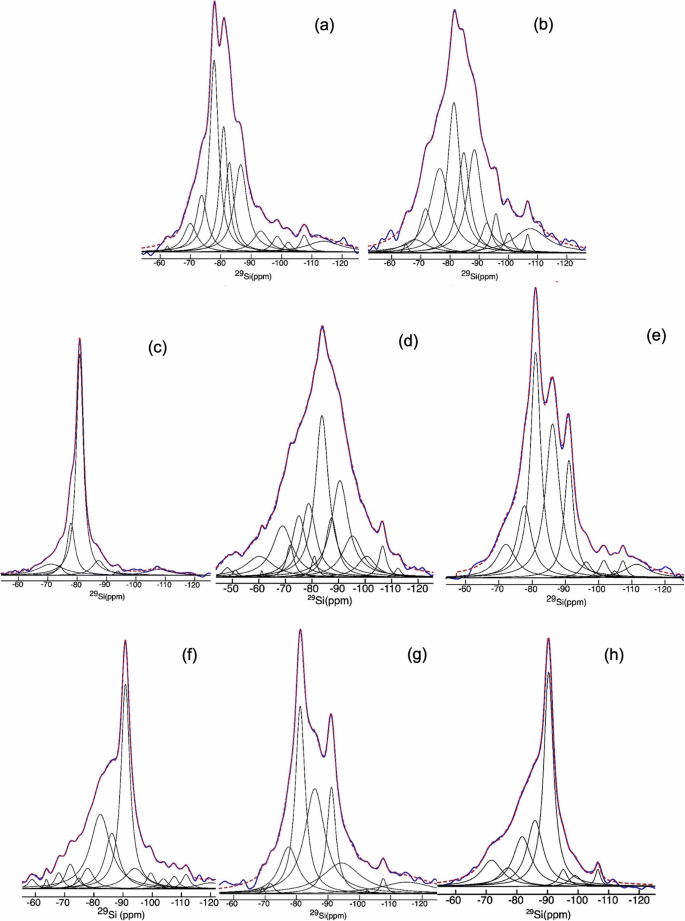
a 1-day aged Control-N paste, b 1-day aged Control-CC paste, c Control-N paste at 28-d age, d Control-CC paste at 28-d age, e 25S-AAM-N at 1-day age, f 25S-AAM-CC at 1-d age, g 25S-AAM-N at 28-d age, and h 25S-AAM-CC at 28-d age. In each case, the fit (dashed red) is the sum of the deconvoluted peaks.
In Control-N-1D the peaks at −78 and −82 ppm are attributed to the Q1 Si sites located at the end of the C-A-S-H chain46 and Q2 (1Al) sites, typical of an Al-substituted C-S-H (C-A-S-H) with a tobermorite-like structure. The Q1 silica sites in C-S-H can be bonded either to Si or Al with charge-balancing ions including Ca2+, Na+, and H+. The low-intensity broad peak at −86 ppm is assigned to silicate (Q2p) in a cross-linked calcium–sodium aluminosilicate hydrate (C-(N)-A-S-H) gel that generally forms in high Al systems.57 Moreover, the (Q2p) is most prominent in alkali-activated FA (A-FA-N-1D, Fig. 7f) and almost non-existent in alkali (NaOH)-activated slag (A-GGBS-N-1D, Fig. 7e) because the FA used in this research contains 25.40% Al compared to 16.60% in the case of GGBS (Supplementary Table S1). The presence of 13–26% Na (atomic weight) in the gel structure of Control-N at 1-d age is detected from the EDS spectrum (Supplementary Fig. S2a). After carbonation the Control and A-GGBS show Q1 to Q2 conversion and a spectral broadening as shown in Figs. 7a, e and 8b. The increased Q2/Q1 ratio in Control upon carbonation (Table 2) agrees well with earlier studies58 that attributed this increment to decalcification and formation of a polymerized silica phase. This has resulted in an increase in the MCL after carbonation (Control-CC) compared to the normally cured samples.
In comparison to Control-N, 25S-AAM-N contains three distinct peaks at −81, −86, and −92 ppm, which correspond to Q1(1Al), Q2p, and Q4(3Al), respectively59. The peak intensities for Q1(1Al), Q2p are higher than those observed for Control-N, while Q4(3Al) is not observed for Control-N. This indicates a higher formation of a highly cross-linked C-(N)-A-S-H gel due to the presence of clay (alumino-silicates) in 25S-AAM-N. More cross-linking also increases the MCL of 25S-AAM-N to 8.80 compared to 4.73 of Control-N (Table 2). It shall be noted that clay (soil < 75 µm) and FA are present in 25S-AAM-N at similar dosages (Table 2); however, due to the higher surface area of clay, more alumina is expected to go into dissolution. Second, a lower Ca/Si ratio, as in the case of 25S-AAM-N compared to Control-N, promotes more cross-linking of Al into the C-N-A-S-H gel structure60. This is confirmed by the higher Al/Si atomic ratio (0.77–0.80) in the case of 25S-AAM-N compared to Control-N (Al/Si = 0.47–0.66, Supplementary Fig. S2). NMR spectrum of alkali-activated soil (A-S-N-1D) also shows a high-intensity Q2p peak at −86 ppm suggesting the formation of sodium-based alumino-silicate hydrates (N-A-S-H like zeolitic products) within the initial 1 day of activation (Fig. 7g). After carbon curing, both of the Q2 peaks combine and transform into a broad hump, while the intensity of Q4(3Al) is substantially increased. This can be due to two overlapping phenomena:
-
(i)
Higher presence of unbound clay particles (kaolinite) due to decalcification of binder gels. This phenomenon is supported by the absence of the Q2p from N-A-S-H-like phases and a substantial increment in the kaolinite clay peak intensity at −90.76 ppm61 in carbonated alkali-activated soil (A-S-CC-1D)62. A similar trend is repeated in carbonated alkali-activated fly ash too. Q2 peak at −86 ppm transforms into a broader hump, while the Q4(0Al) associated with mullite and quartz from the raw fly ash (Supplementary Fig. S8) increases in intensity.
-
(ii)
There is a possibility of higher cross-polymerization of Al (from clay) into the C-N-A-S-H structure to balance the charge after decalcification and reduction in Ca/Si ratio59. This has resulted in a longer MCL of 25S-AAM-CC compared to 25S-AAM-N (Table 2). However, for MCL > 20, the uncertainty is quite high due to the correspondingly small magnitude of Q1.63
In summary, Control-CC-1D shows lower disorder compared to 25S-AAM-CC-1D where both Q2(1Al) and Q2p are highly disordered evidenced by the transformation into a broad hump. This indicates that carbon curing has a more dominant influence on the molecular structure of 25S-AAM compared to the control, attributed to its lower Ca/Si ratio.
After 28 days of hydration, the dominant presence of Q2(1Al) and substantial decrement in Q1 is seen in the case Control-N as shown in Fig. 7c and the deconvoluted spectrum in Fig. 8c. This indicates the formation of more linear polymeric chain as reflected in the increase of MCL from 1-d to 28-d age (Table 2), suggesting the formation of more polymerized C-A-S-H with hydration duration. In comparison, 25S-AAM-N shows two sharp peaks corresponding to Q2(1Al) and Q4(3Al), respectively (Fig. 7c). Q4(3Al) is expected because of the formation of more cross-linked N-A-S-H and C-(N)-A-S-H gels. This is also supported by the precipitation of C-(N)-A-S-H in 25S-AAM-N at 28-d age (Fig. 5a). Control-CC-28D does not show a remarkable change compared to Control-CC-1D, except the intensity of the Q2 centered around −88 ppm is reduced (Fig. 8c, d). This suggests that natural carbonation has caused decalcification of the C-(A)-S-H structure in Control-CC, which is also supported by the additional 5.20% carbonate mineralization from 1-d to 28-d mark (Fig. 3c). Similarly, in the case of 25S-AAM-CC-28D, the Q2b (−82 ppm) has reduced in intensity compared to that in 25S-AAM-CC-1D, which can be seen by comparing Fig. 8f, h. Change in the C-(A)-S-H structure due to natural carbonation is expected to affect strength development, which is discussed in the next section.
Interestingly, the initial accelerated carbon curing has a significant influence on the change in bond structure during later age natural carbonation. For instance, 25S-AAM-N and Control-N show a reduction in Q0 from 1-d to 28-d (Table 2), while the Q0 increases from 1-d to 28-d in Control-CC and 25S-AAM-CC at 28-d mark compared to 1-d. Q0 is associated with unbonded silicon, which may originate from raw FA or clay (in soil). This indicates that the initial carbon curing prevents the formation of silica-incorporated hydrate gels, which can be ascribed to slower dissolution of silica (from FA or clay) due to carbonation of NaOH and consequent reduction in the pH.
Effect of Soil addition on compressive strength and porosity
The wet compressive strength and moisture sensitivity (based on the ratio of wet strength and dry strength, RMS, Eq. 13 in “Methods” section) of Control and 25S-AAM mixes, subject to different curing conditions, are presented in Fig. 9a, b. 25S-AAM-N shows 110% and 57% higher strength compared to Control at 1-d and 3-d marks, which are statistically significant (p < 0.05 at 95% confidence interval). The strength gained by 25S-AAM-N at the 3-d mark (23.20 MPa) is statistically similar to that of Control-N at the 7-d mark (24.51 MPa). This will be beneficial to reduce the deployment time of construction products made with 25S-AAM-N (e.g., tiles, blocks, and panels), which will boost productivity and minimize inventory costs. Twenty-eight days strength of 25S-AAM is higher by 10% compared to Control although the difference is not statistically significant. The improvement in strength at 1-d and 3-d marks is due to the densification of the matrix by clay particles, which is supported by statistically higher ultrasonic pulse velocity (UPV) (Fig. 9d) of 25S-AAM-N compared to the Control-N. The densification is ascribed to two reasons—(i) the accelerating effect of clay on the hydration kinetics of AAM (Fig. 2a), and (ii) the filler effect of clay particles, which boosts slag hydration (Fig. 2b). Despite the initial positive effect on strength development, wet compressive strengths and moisture sensitivity of 25S-AAM-N and Control-N are similar at 28-d age. The sorptivity and UPV of these two mixes are similar (Fig. 9c, d). Although clay particles act as the source of alumina and silica for precipitation of zeolitic and N-A-S-H phases, the addition of soil increases the total water-accessible porosity by 36% compared to Control-N (Fig. 9e). Furthermore, the total pore volume of 25S-AAM-N is also increased by 177% than Control-N (Fig. 10a). Based on Fig. 10b, it can be seen that the pore volume below 10 nm is similar for 25S-AAM-N and Control-N, while the pore volume in the size range of 10–100 nm in 25S-AAM-N is 3.8 times that of Control-N. The bulk of the pores in slag-rich alkali-activated materials is in the size range of 5–100 nm at 28-d age62,64, and therefore, an increase in the pore volume in this range will adversely affect strength development. This may be caused by the presence of unstabilized clay particles, which is evident from the strong peaks of kaolinite (K) in the XRD spectra of 25S-AAM-N at 28-d age (Fig. 4b). Therefore, the positive filler effect of clay particles is offset by the increase in porosity of the matrix, resulting in similar wet compressive strength of 25S-AAM-N and the control.
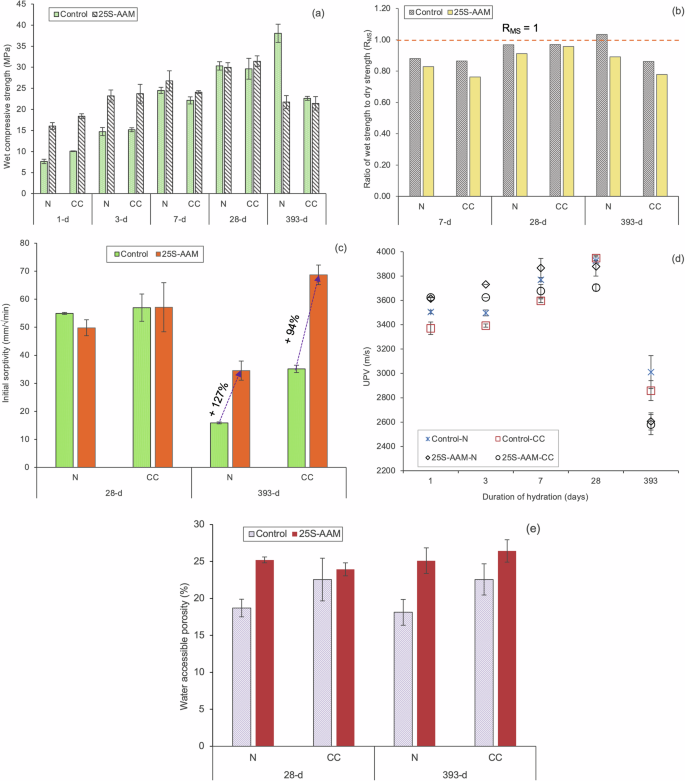
a Wet compressive strength of the tested mixes at 1-d, 3-d, 7-d, 28-d, and 365-d ages. b Moisture sensitivity calculated by the ratio between wet and dry compressive strength at 7-d, 28-d, and 365-d ages. c Initial sorptivity of the tested mixes at 28-d and 393-d age. d UPV (m/s) through the normal and carbonated mixes. e Water-accessible porosity of the mixes after 28 days and 393 days.
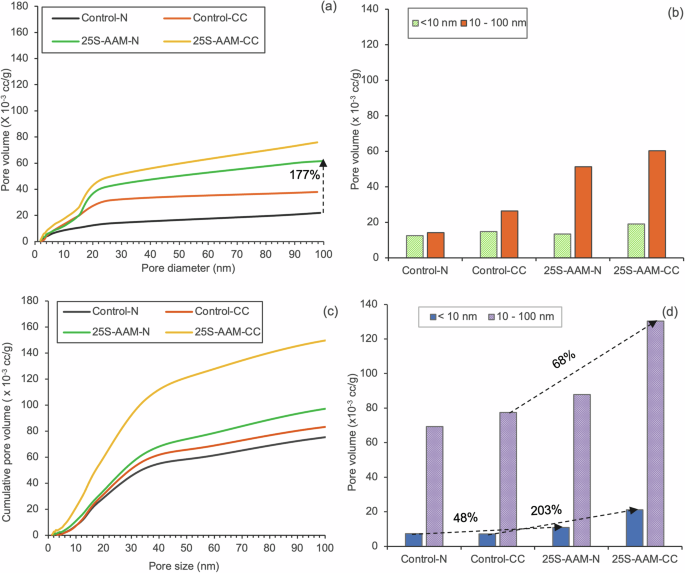
Pore volume of the tested mixes at a 28-d age; c 393-d age. Pore volume below 10 nm and in the range of 10–100 nm at b 28-d age and d 393-d age.
After 365 days of natural exposure (393-d age), Control-N shows RMS of 1.03 and an increment in wet compressive strength by 24% compared to that at 28-d age. In comparison, the wet compressive strength of 25S-AAM-N is reduced by 44% compared to Control-N. This is attributed to the higher porosity created by the unstabilized clay particles (evident from sharp peaks of kaolinite in 25S-AAM-N in Fig. 4c) and the internal stresses induced due to their volumetric fluctuations. This is also reflected in 127% higher initial sorptivity (Fig. 9c), 14% reduction in UPV (Fig. 9d), 38% higher water-accessible porosity (Fig. 9e), and 32% higher pore volume (Fig. 10c) of 25S-AAM-N compared to Control-N at 393-d mark. It is interesting to note that although the pore volume in the pore size range of 10–100 nm is increased by 71% from 28-d to 393-d in 25S-AAM-N, the sorptivity is reduced by 40%. A similar trend can be observed for Control-N as well. Sorptivity is controlled by the capillary water absorption by the small and medium capillary pores and has implications on water seepage in structures. Reduction in sorptivity can be attributed to the precipitation of zeolitic crystals including Calcium–Faujasite (hydrated calcium–sodium–alumino–silicate) minerals as a layer on the exposed surface (Fig. 11). EDS spectra confirm two areas (1 and 2) that the small crystals constitute sodium, aluminum and calcium and oxygen as the major elements, although they are intermixed with calcium carbonate and pirssonite. XRD spectra (Fig. 4c) also confirm the presence of Calcium–Faujasite (Fc) in the 393-d old 25S-AAM-N. The deposition of Ca–Faujasite covers crack surfaces (marked by saffron arrows in Fig. 11a), which will reduce the accessibility of water during sorptivity investigations. Faujasites are mesoporous, and the cationic sites act as adsorption centers for gas molecules65. This may lead to an overestimation of the actual pore volume in the AAM matrix, and therefore it is recommended that multiple techniques be used to arrive at a reliable evaluation of the connected porosity.
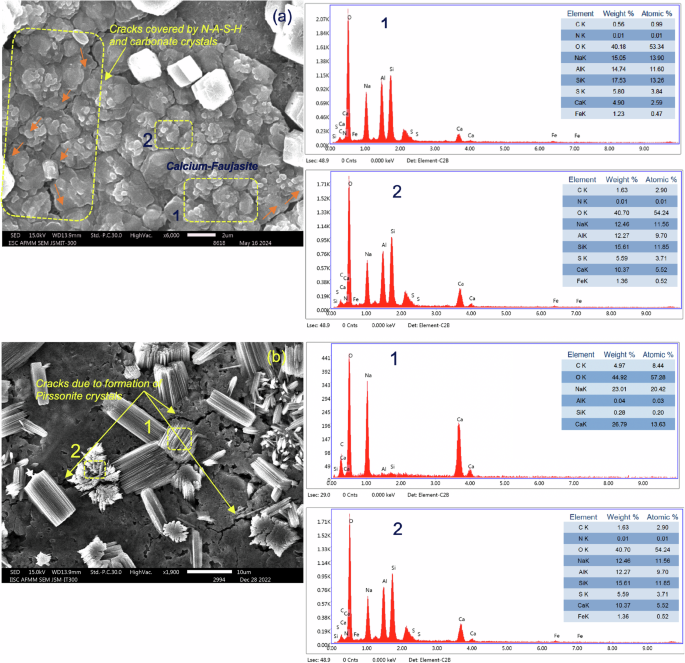
a. Ca–Faujasite observed in 25S-AAM-N after 365 days of natural exposure. The crack paths being covered by the Ca–Faujasite crystals are marked with saffron arrows. b Cracks around pirssonite crystals in 25S-AAM-CC at 28-d age.
Effect of initial carbon curing on strength
Carbon curing leads to 32% and 13% higher wet compressive strength of Control-CC and 25S-AAM-CC at 1-d compared to the normally cured counterparts (Fig. 9a). The improvement is attributed to the packing effect of carbonate crystals, which densifies the AAM matrix. However, the 28-d strengths and moisture sensitivity do not show any improvement due to carbon curing (Fig. 9b). This is attributed to two reasons—(i) lower binding and stabilization action due to decalcification of the hydrate gels, evidenced by 29Si NMR and XRD. Q2b peak in 25S-AAM-CC has disappeared at 28-d age while it is present in 25S-AAM-N. This suggests the disintegration of the C-(A)-S-H structure. Second, resurgence of montmorillonite and kaolinite peaks are observed in 25S-AAM-CC compared to 25S-AAM-N at 28-d age (Fig. 4b), suggesting poor clay stabilization, and (ii) Second, 68% and 24% increase in pore volume in the size range of 10–100 nm are found for Control-CC and 25S-AAM-CC compared to the normally cured (-N) counterparts (Fig. 10b). Figure 11b shows the growth of pirssonite and vaterite crystals out from the matrix, which is confirmed by the EDS analysis. Development of micro-cracks around the crystals can be observed, which is likely due to the expansive stresses caused by crystal growth during accelerated carbonation. After 28 days of hydration, the cracks remain unhealed. Presence of these cracks will increase the porosity of the matrix, thus limiting the late age strength development.
At 393-d age, 25S-AAM-CC and Control-CC show similar wet compressive strength, while the moisture sensitivity of 25S-AAM-CC is higher (({R}_{rm{MS}}=0.77)) compared to Control-CC (({R}_{rm{MS}}=0.86)). This is because of the presence of unstabilized clay in 25S-AAM-CC (evident from the Si–O–Al and Si–O–Si band at 540 cm−1, Fig. 6c), which is not the case for Control-CC. Furthermore, 25S-AAM-CC has 94% higher sorptivity than Control-CC (Fig. 7c) and 68% higher pore volume in the size range of 10–100 nm. This indicates higher moisture transport through 25S-AAM-CC that will destabilize the unbound and unstabilized clay particles in the matrix. The volume of pore below 10 nm in 25S-AAM-CC is also 3 times higher than that of Control-CC (Fig. 10d), indicating higher porosity of the hydrate gels. This aligns with the micro-structural observations where 25S-AAM-CC shows a highly porous gel structure and micro-cracks (Fig. 5d, f).
Effect of soil on total shrinkage
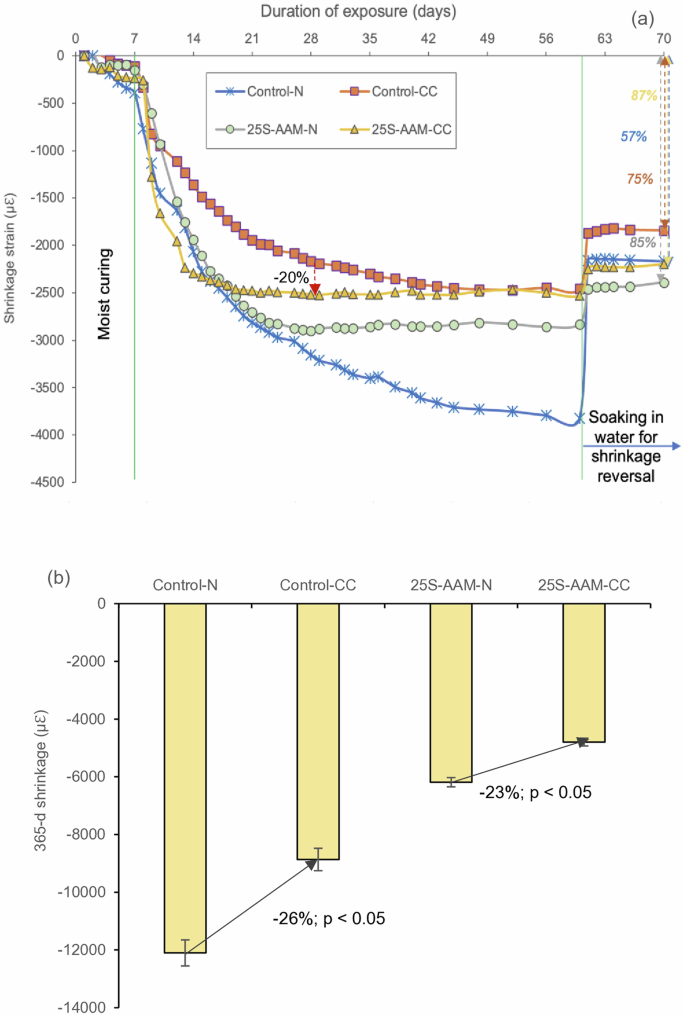
Figure 12a shows the total shrinkage strain (average of 4 specimens) in Control and 25S-AAM during a 60-d monitoring period. Standard deviations are not plotted as the coefficient of variation was within 5% for all the mixes. Due to the initial 7-d moist curing (100% RH), all the samples show relatively low shrinkage during this period. Once the dry exposure regime begins (30 °C, 65% RH), both the control and 25S-AAM show a steep increase in shrinkage. Control-N and 25S-AAM-N show similar shrinkage up to the 21-d mark and thereafter, 25S-AAM-N shrinks at a much slower rate than Control-N. The shrinkage strain at the 60-d mark is 25% lower in 25S-AAM-N compared to Control-N.
a Shrinkage strains in normal and carbonated control and 25S-AAM during 60-d period followed by reversible shrinkage due to water soaking. b 365-d shrinkage due to exposure to the outdoor environment for 365 days (1 year).
NMR investigations (Fig. 7) show that C-(A)-S-H is the main hydrate gel in Control-N. C-(A)-S-H behaves as granular particles with micro-defects. Due to drying at a relatively high humidity (>50% RH), the particles are compacted and rearranged under capillary pressure. As a result, the refinement of porosity takes place, leading to higher shrinkage66. Although clay promotes the formation of cross-linked N-A-S-H-like structures (Q4(3Al) sites at −90.76 ppm in Fig. 8g), stability of N-A-S-H gel during the early stages is poor in the Ca2+-rich environment created due to the dissolution of slag. Although a small amount of silica and alumina are dissolved from the fly ash and clay fractions, they tend to form C-A-S-H50. This is also confirmed from the FTIR spectra (Fig. 6a) and SEM images of 25S-AAM-N at 1-d and 7-d, where the presence of a sheet-like gel structure typical of C-(A)-S-H can be observed (Supplementary Fig. S9a, b). Only a small amount of N-A-S-H is formed after 7 days. Therefore, the shrinkage kinetics are similar for Control and 25S-AAM-N during the initial stages of hydration. However, at 28-d age, copious precipitation of N-A-S-H crystals throughout the 25S-AAM-N matrix can be observed (Supplementary Fig. S9c, d and FTIR spectra in Fig. 6a). Based on the EDS analysis (number of sampled crystals is 8), the Ca/Si and Al/Si ratios of these crystals are 0.48 and 0.74, respectively (Fig. 12). The Al/Si ratio is higher than that of fly ash (Al/Si = 0.25), but lower than that of soil <75 µm (Al/Si of 1–1.02, Fig. 1). This means that besides FA, the clay in soil has gone into dissolution, thus yielding N-A-S-H and zeolitic products at a later age. N-A-S-H is reported to behave as a “true gel”, having a better filling effect and adhesion compared to C-A-S-H67. These may be the reasons for the reduction in shrinkage in 25S-AAM-N, although no clear correlation between the structure of N-A-S-H and volumetric stability is established in the literature. In comparison, Control-N also shows precipitation of discrete particles (Supplementary Fig. S10 and inset of Fig. 13). However, the Ca/Si ratio (1–1.10) is significantly higher than that of 25S-AAM-N (p = 0.001 < 0.050, hence statistically significant), while the Al/Si ratio is significantly lower (Fig. 13) thus indicating lower cross-linking and density. The Na content in the particles in Control-N is only 3.83–7% (atomic), which is much lower than 13.30–19.48% for 25S-AAM-N. Ca/Si ratio of 1–1.10 indicates semi-amorphous C-(A)-S-H with incorporation of sodium in the molecular structure68. Structurally, it is closer to tobermorite-like C-A-S-H and therefore, suffers from higher shrinkage due to rearrangement of particles and porosity.
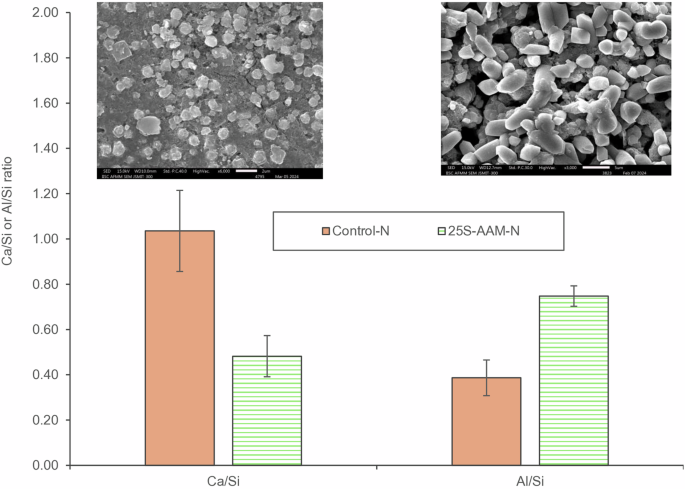
Ca/Si and Al/Si ratios of crystal deposits in Control-N and 25S-AAM-N at 28-d age.
Second, it is well established that the dominant driving force for shrinkage in slag-rich alkali-activated materials is the capillary stress due to meniscus formation66,69. Based on the capillary stress theory (Eq. 8), the capillary stress, ({P}_{rm{cr}}), is inversely proportional to the meniscus radius in the pores. Therefore, at a constant humidity and temperature, the finer the pore structure, the higher will be the shrinkage of slag-rich alkali-activated materials62. Based on the volume distribution of pores, determined by the Barrett–Joyner–Halenda model, the median pore sizes in Control-N and 25S-AAM-N are 8.35 and 16.36 nm, respectively, at 28-d age. Considering ({gamma }_{rm{CL}}) of 0.71 for ion-rich pore solution70, the ({P}_{rm{cr}}) of Control-N and 25S-AAM-N will be 33.29 and 17.60 MPa, respectively. Reduced capillary stress will exert lesser tension in the matrix and reduce the total shrinkage.
The irreversibility of shrinkage is higher in 25S-AAM-N (85%) compared to Control-N (57%). During soaking, the water can penetrate into the pores and the layers of C-(A)-S-H, which will reverse the capillary tension in the unsaturated pores and establish disjoining pressure between the solid particles. However, permanent changes due to rearrangement within the C-A-S-H cannot be reversed leading to a large fraction of irreversible shrinkage in alkali-activated materials. Unlike C-A-S-H, N-A-S-H, which is one of the primary hydration products in 25S-AAM-N, does not have a constant gel porosity and causes shrinkage primarily due to structural rearrangement during polymerization rather than self-desiccation71. Therefore, replenishment of the moisture through soaking has little impact on reversing the drying shrinkage. Similarly, carbonation leads to permanent alteration to the gel structure and porosity, including incorporation formation of N-A-S-H and C-N-A-S-H products. Much of the alkali near the carbonated surfaces are converted to mineral carbonates, for example, thermonatrites and prissonites. These alterations are associated with the change in molar volumes which cannot be reversed by supplying additional moisture. This explains why Control-CC and 25S-AAM-CC show higher irreversible shrinkages (85–87%) compared to their normally cured counterparts.
Effect of accelerated and natural carbonation on shrinkage
Based on Fig. 12a, it can be observed that carbon curing reduces the total shrinkage of the control and 25S-AAM-N mixes at 60-d age. This suggests that carbonation causes net expansion of the mixes with respect to the normally cured counterparts. Similar findings have been reported by Ye and Radlinska69—natural carbonation of alkali-activated slag exposed to the ambient environment leads to slight expansion. Due to the presence of alkali in pore solution, the Ca/Si ratio of the C-(A)-S-H gel in alkali-activated materials tends to be relatively low compared to C-(A)-S-H in Portland cement-based materials. It is because the alkali cations compete with Ca2+ in order to compensate the negative charge of deprotonated silicate chains69. Just before carbonation, the Ca/Si ratios for C-(A)-S-H gel in the control and 25S-AAM pastes are in the ranges of 0.80–1.31 and 0.43–0.54, respectively (Supplementary Fig. S2a, b). 25S-AAM-N shows a lower ratio due to the sourcing of additional silica from clay (soil < 75 µm) and the reduction in slag content in the paste mixes. A lower Ca/Si ratio makes C-(A)-S-H more thermodynamically susceptible to carbonation and produces mineral carbonates. The growth of the mineral carbonates within the refined pore structure of the control and 25S-AAM generates significant expansive stress and offsets the drying shrinkage due to meniscus formation and particle rearrangement. Thermogravimetry investigations confirm higher carbonate mineralization in 25S-AAM-CC at 1-d and 28-d age compared to Control-CC (Fig. 3c), which explains a 20% reduction in shrinkage after 28 days of hydration. Furthermore, N-A-S-H particles and rod-like structures of carbonate minerals (Fig. 11b) may act as micro-reinforcements in the material matrix, and restrain shrinkage. However, this needs to be confirmed through further investigations.
After 365 days of natural exposure, 25S-AAM-N and 25S-AAM-CC show 49% and 46% lower shrinkages compared to Control-N and Control-CC respectively (Fig. 12b). This is attributed to more complete carbonation of the gel in 25S-AAM evident from the 48% and 203% increase in pore volume below the size of 10 nm (Fig. 10d). Furthermore, the findings from NMR indicates that due to the decalcification of C-A-S-H via natural carbonation, more zeolite and N-A-S-H like phases (Q4(3Al) in Fig. 7d) are formed especially in the presence of clay (from the soil). This is also captured in the XRD spectra (peaks for Faujasite in Fig. 4c) and SEM micrograph in Fig. 11a. These phases are known to efficiently fill pores and cracks, which can reduce the capillary tension and mitigate shrinkage in long term.
The research explored the influence the role of lateritic soil and carbon sequestration on hydration kinetics, chemical structure, and engineering performances of alkali-activated GGBS–FA materials. The findings from this research provide critical insight into the effects of clay (in soil) and prolonged natural carbonation (for 1 year) on the changes in the binder gel structure, pore size distributions, and their consequent influences on strength development, shrinkage, and water sorptivity. Based on the findings, carbon sequestration through accelerated carbonation is not recommended for alkali-activated materials containing non-expansive clays (for instance, kaolinite in this research). The micro-structural changes due to initial carbonation have detrimental effects on the engineering properties of such materials especially under outdoor exposure. Future research may examine the application prospects of carbon sequestering earth-based materials in the indoor environment (e.g., wall tiles, wall panels, etc.). In this research, only NaOH is used as the activator. It is worthwhile to investigate the effect of sodium silicate and other waste-derived silicate activators on carbon sequestration and engineering performance after long-term natural exposure. Silicate activators are known to refine the pore size distribution and contribute to mechanical strength, which may offset the detrimental effect due to carbonation. Another relevant area of investigation could be optimizing the clay-to-binder ratio for earth-based AAM (EAAM) subject to normal curing and carbon sequestration. This is because optimized binder for a certain type and dosage of clay will reduce the volumetric instability of EAAM under natural environment and improve their carbonation resistance.
Methods
Materials
The primary binders used in this investigation comprised GGBS and class F FA. The GGBS was collected from Jindal Southwest, India, and FA was collected from a local power plant in the southern state of Karnataka, India. The oxide composition of GGBS and FA, determined by XRF, is presented in Supplementary Table S1. The total SiO2, Al2O3, and Fe2O3 content in the FA is >90% and the sulfate content is <5%; thus, it can be classified as class F according to ASTM C61872. Locally available manufactured sand (M-sand) conforming to ASTM C3373 was used as fine aggregate74. The alkali activator used for the preparation of AAM was a NaOH solution of 8 mol/L (M) concentration. The solution was prepared by dissolving NaOH pellets (purity of 98%) in deionized (DI) water and was allowed to cool down to room temperature before being used for the mortar preparations. The soil was obtained from an excavation site at a depth of 2 m from the top layer. The specific gravity of the M-sand and soil, measured as per ASTM D85475, is 2.66 and 2.62, respectively.
Mix proportions and curing conditions
Two mortar mixes were investigated in this research (Table 3). The control mortar (Control) comprised GGBS and FA in the mass ratio of 3:1. The ratio of aggregate (M-sand) to (GGBS + FA) was 2:1 by mass. In the soil–AAB mix (25S-AAM), 25% of M-sand was replaced by excavated lateritic soil. The solution to (GGBS + FA) was maintained at 0.74 by mass for both the mixes. In this research, only NaOH was used as the alkali activator without any sodium silicate. This was because of two reasons. First, among all constituents in a geopolymer mix sodium silicate has the highest contribution to environmental impacts and embodied carbon76. Second, it was reported that the carbon sequestration in geopolymer is negatively impacted by the presence of sodium silicate due to the formation of a dense calcium silicate hydrate (C-S-H) matrix36. The mixing and casting protocols are described in Supplementary Section S1.1. Flow values of each mortar mix within 5 min of mix preparations were measured according to ASTM C143777.
Two curing conditions were investigated in this study—normal curing (N) and accelerated carbon curing (CC). In normal curing conditions, mortars and pastes were demoulded and stored in an environmental chamber at constant temperature and humidity (30 °C and 65% R.H.) till the age of testing. During carbon curing, mortars, and pastes, demoulded after 22–23 h, were exposed to 5% CO2 for 4 h in a carbon dioxide incubator. After carbonation, the samples were placed in the environmental chamber till the testing age. Carbon curing was performed at an initial temperature of 30 °C and constant humidity was fixed at 65 ± 2%. The CO2 concentration and duration were selected based on the findings from past research78,79. For instance, Gluth et al. (RILEM Technical Committee 247-DTA)79 and Gomes78 noted that exposure to 1% CO2 induced strong micro-structural changes in geopolymers for short carbonation durations (2–8 weeks of exposure). Carbonation in slag-rich alkali-activated materials was associated with the conversion of C-(A)-S-H (main binder phase) to calcium carbonate and silica gel, unlike OPC-based materials where substantial carbonation of portlandite takes place. Therefore, high CO2 concentration or prolonged exposure duration tends to cause excessive decalcification of C-(A)-S-H in alkali-activated materials, leading to loss in structural integrity and mechanical strength.
After an initial 28 days (28-d) of curing in the lab, the mortar cubes and pastes were exposed to the outdoor environment (temperature variation of 19–37 °C, and humidity variation of 70–100%) for another 365 days (total age of 28 + 365 = 393 days). The samples were placed on stainless steel grids, left uncovered and directly exposed to all the environmental agents (rain, wind, sunlight, etc.). On four different occasions of rainfall 2–3 months apart, the rainwater was collected in glass beakers placed in the vicinity of the samples. The pH of the water was found to be in the range of 6.80–8.
Micro-structural analysis, phase composition, and hydration kinetics
Representative pastes corresponding to each mortar were prepared for micro-structural analysis. Pastes contained a mix of GGBS, FA, and soil < 75 µm (clay and silt in soil) where applicable. For instance, for the control mix, 100 g of precursors (GGBS and FA) was activated by 74 g of NaOH. For 25S-AAM, 100 g of precursor was added to (0.52 × 0.25 × 2 × 100) = 26 g of clay and silt (fraction of soil <75 µm, which is 52% by wt. of soil based on sieve analysis), thoroughly mixed in dry condition, and then 74 g of 8 M NaOH (s/b = 0.74, Table 3) was added to the mixture. The hydration process of the geopolymer pastes was stopped using isopropanol, followed by drying at a temperature of 60 °C for 3 h. Then, the hardened samples are crushed and sieved through a 75 µm sieve to obtain powder samples for phase composition and thermal analysis. Phase composition due to carbon sequestration was investigated using XRD, Fourier transform infrared (FTIR) spectroscopy, and nuclear magnetic resonance spectroscopy (NMR). NMR spectroscopy on 29Si MAS NMR spectra was collected at 79.47 MHz on a JEOL JNM-ECX400II 9.4 T spectrometer using a 4 mm probe at a spinning speed of 10 kHz. The samples were loaded in a 4 mm zirconia rotor with a vessel cap. A single 90° excitation pulse of length 3.3 μs, with a 5-s relaxation delay, was passed. Carbonate mineralization in the prepared samples was examined using TGA. The methods for XRD, FTIR, and TGA are presented in Supplementary Section S1.2.
Hardened paste samples, normally cured and carbon cured, of thickness ~1 mm were imaged using scanning electron microscopy (SEM). The elemental compositions were obtained using energy dispersive spectroscopy (EDS) fitted with the SEM. Before imaging, the samples were sputter-coated with gold.
The carbonate mineralization (({CaC}), wt% of GGBS + FA) was calculated based on the mass loss in the decarbonation range of 530–900 °C36 (Eq. 10).
where, ({M}_{450}) and ({M}_{900}), are the masses at 450 and 900 °C, respectively. ({M}_{a}) is the anhydrous mass of the alkali-activated paste at 900 °C17. ({{w}_{f}}_{i}) and (Delta {m}_{i}) are the weight fractions and mass losses of the solids (soil < 75 µm, GGBS, and FA) in the mentioned temperature range.
The net ({CaC}) due to accelerated carbonation was calculated using Eq. 11.
The normalized mass loss in the temperature range of 100–250 °C was used to estimate the C-(A)-S-H content (Eq. 12)35. However, the exact quantity of precipitated C-(A)-S-H cannot be ascertained due to the lack of a definitive stoichiometry.
({Ca}{C}_{rm{CC}}) ({rm{and}}) ({Ca}{C}_{rm{N}}) are the amount of carbonate minerals formed in normally cured (N) and carbonated samples (CC). The carbonate mineralization was determined at 1-d age (just after carbonation) and after 365-day exposure to the natural environment. This was done to investigate any possible change to the sequestered carbonate minerals during outdoor exposure which may trigger natural carbonation and surface weathering of the exposed samples.
Hydration kinetics and porosity analysis
Hydration kinetics of Control and 25S-AAM were investigated using an eight-channel isothermal calorimeter (TAM Air from TA instruments, USA) maintained at 25 °C, which represents the average local temperature. The evolved heat due to hydration was continuously recorded as power output (mW) from the calorimeter every 180 s, which was normalized with respect to the mass of the binder (GGBS + FA). The cumulative heat evolutions (J/g of GGBS + FA) were calculated.
Pores in alkali-activated materials are mostly in the mesoporous region, and the size distributions are altered after carbonation. This may influence total shrinkage and mechanical strength. The pore size distribution of the normally cured and carbonated pastes at 28-d age and 393-d age, respectively, were determined using nitrogen adsorption at 77.4 K. Before sorption, the pastes were vacuum dried for 3 h at 25 °C as recommended by Kurihara and Maruyama80. The pore volumes were computed using Barrett–Joyner–Halenda (BJH) model.
Compressive strength, water-accessible porosity, and capillary absorption
Compressive strength was determined using 50 mm × 50 mm × 50 mm cubes after 1 day, 3 days, 7 days, 28 days, and 393 days. At 7-d, 28-d, and 393-d marks, compressive strengths in wet and dry conditions were measured because stabilized earth materials are sensitive to moisture exposure. Before testing mortar cubes were immersed in water for 48 h, while the rest of the cubes at the same age were dried in a ventilated oven at 60 °C to constant mass. The moisture sensitivity of compressive strength can be represented by ({R}_{rm{MS}}) (Eq. 13).
({sigma }_{rm{w}}) and ({sigma }_{rm{d}}) are the compressive strengths (MPa) under wet and dry conditions, respectively. Three to four samples per mix subject to each curing condition were tested.
Capillary absorption of the prepared mixes at 28-d and 393-d ages was determined according to ASTM C1403. Based on the absorption per unit exposed area, the initial sorptivities, which is influenced by capillary suction of small and medium capillary pores, were computed. Water-accessible porosities of the normally cured and carbonated mixes were determined according to ASTM C64281 at 28-d age and 393-d age, respectively. Four samples (n = 4) per mix were tested.
Total shrinkage
Total shrinkage was monitored using 25 mm (w) × 25 mm (h) × 285 mm (l) prisms according to ASTM C59682. Normally cured and carbonated samples were moist cured for the initial 7 days, followed by storage in a stability chamber maintained at 30 ± 1 °C and humidity 65 ± 2% for the next 53 days. Moisture exposure due to rainfall and high humidity can recover part of the shrinkage experienced by building materials. After 60 days, the shrinkage samples were immersed in water (pH(approx)8) and the length change was recorded during 10 days of immersion. Five samples per mix for each curing condition were examined. A separate regime was followed to assess the impact of natural exposure on shrinkage. After 28 days of curing at 30 ± 1 °C and humidity 65 ± 2%, three to four samples were exposed to the outdoor environment for the next 365 days (total age of 393 days). On the 393rd day, the length of the outdoor-exposed samples was recorded and the shrinkage was computed.


Responses