Cardiometabolic disease risk in gorillas is associated with altered gut microbial metabolism

Introduction
Cardiovascular disease is a major cause of death in western lowland gorillas (Gorilla gorilla gorilla) in zoo-settings1,2,3,4. In humans, congestive heart failure, also a leading cause of mortality, is mainly a vascular disease (atherosclerosis) related to diet and sedentarism5. In gorillas, fibrosing cardiomyopathy leads to cardiac disease primarily in adult males, with stiffening of heart muscles leaving the heart unable to effectively contract1,6,7. However, disease etiology in gorillas remains unknown. Recent microbiome associations have pointed to protein-rich diets and microbiome-associated metabolites that lead to atherothrombosis and cardiovascular disease risk in humans8,9,10. For example, the conversion of dietary phosphatidylcholine and L-carnitine into trimethylamine (TMA) by the human gut microbiome leads to the formation of circulating TMA-oxide (TMAO), which induces atherosclerosis development10,11.
However, studies revealing associations between gut microbial metabolism and cardiometabolic health in nonhuman primates remain limited. The only available study performed in gorillas with heart disease (n = 4), points to some taxonomic markers that distinguish affected from unaffected lowland gorillas12. Still, the metabolic and functional significance of alterations at the taxonomic level remains unclear. In the absence of functional data specific to the gut microbiomes of gorillas with cardiac disease and given recent evidence in humans showing altered microbial function in those with heart pathologies, we sought to investigate whether microbial and metabolic markers can differentiate affected gorillas and predict cardiac disease risk.
To this end, our study employed a multi-OMIC approach, including 16S rRNA, and shotgun metagenomics sequencing data, in tandem with Nuclear Magnetic Resonance (NMR)-based metabolomics (Fig. 1a) in fecal samples from zoo-housed adult western lowland gorillas in Europe and the U.S. diagnosed with Cardiometabolic disease (CMD) status was assessed through routine examinations only in U.S. zoos, as these examinations are not routinely conducted in Europe. Baseline comparisons were made with wild individuals from the Dzanga Sangha Protected Areas, Central African Republic, across two seasons of variable dietary intake.

a Experimental design, and timeline. A total of 350 fecal samples from 93 western adult lowland gorillas, including zoo-housed gorillas from the U.S. with classification as either cardiometabolic disease (CMD) affected or unaffected, gorillas from European zoos, and wild gorillas in wet and dry seasons. Analysis consisted in gut microbial profiling using 16S rRNA gene Miseq sequencing (V4 region), shotgun metagenomics sequencing, pathway prediction, and fecal metabolite mapping via 1H NMR. b world map of sample collection sites. Wild individuals were from the habituated groups in the Dzanga Sangha Protected Areas, Central African Republic, whereas zoo-housed individuals were from eleven U.S. based zoos and five European zoos. c Boxplot showing 16S taxonomic richness (rarified ASVs) between the different groups. d Boxplot showing 16S taxonomic diversity using the Simpson’s diversity index. e Bray-Curtis-based principal coordinate analysis showing different bacterial community composition in fecal samples of all gorillas analyzed at the ASV level. Box plots on top show differences in ordination scores. f Principal component analysis biplot showing metabolomic composition in fecal samples of all gorillas analyzed. In (f), ellipses the 95% confidence intervals for each group in multivariate space. The boxplots in (c, d, f) show the median as center line, box sizes indicate the lower (Q1) and upper (Q3) quartiles, whiskers indicate extreme values within 1.5× the interquartile range and dots beyond the whiskers indicate outliers. Different letters above the box plots indicate significant differences (q < 0.05) between groups, as determined by Kruskal–Wallis one-way analysis of variance followed by Dunn’s test. Exact individual P values are available in Supplementary Table 1.
To assess baseline ecological or environmental factors potentially associated with CMD status, we first examined microbial and metabolomic differences between all gorillas in European and U.S zoos, and gorillas in free-range or wild conditions in Central Africa. These analyses confirmed a substantial effect of environmental setting in microbial and metabolomic profiles, highlighting increased bacterial diversity and abundance of diet-derived metabolites associated with zoo-housing conditions. Subsequently, we investigated specific microbial and metabolomic markers associated with CMD status in U.S. zoo-housed gorillas, which was the primary scope of this work. These analyses revealed that gorillas with CMD can be accurately distinguished by the increased abundance of specific gut bacterial taxa but also by decreased abundance of specific microbial metabolites and pathways associated with the processing of dietary protein and carbohydrates, which are found in higher abundance unaffected counterparts. By identifying specific microbial biomarkers, metabolites and pathways associated with CMD in zoo-housed apes, this study aims at enhancing our understanding of this common primate disease. Furthermore, we propose that this study provides critical information that contributes to maintaining healthy western lowland gorilla populations in zoos, strengthening conservation strategies for this critically endangered species.
Results
First, we generated information covering 580 bacterial amplicon sequence variants (16S rRNA) and 21 fecal metabolites from 350 gorilla fecal samples collected from wild and zoo-housed gorillas (See Fig. 1a, b and Supplementary Fig. 1 for details). This dataset was generated from 57 zoo-housed adult western lowland gorillas in the U.S. across 11 zoos that underwent repeated sampling across four weeks, with some exceptions (214 fecal samples). Twenty of these U.S. gorillas (73 samples) were diagnosed with cardiometabolic disease (CMD), widely spread across most U.S. zoos. CMD status was determined by veterinarians at each zoo, following clear, established protocols used in the United States, according to Boyd et al. (2020)13. We classified the remaining U.S. zoo-housed gorillas as unaffected. Seventeen individuals (67 samples) were included for gorillas in individual zoos across Europe, also sampled across four weeks for most individuals; however, one individual from an European zoo (four samples) had to be excluded for fecal metabolomic analyses due to insufficient material. European zoos do not assess for CMD status; thus, cardiometabolic health in these individuals was unknown, and hence, we could not make any CMD-based analyses with samples from Europe.
All zoo-housed gorillas were under nutritional recommendations of the AZA Nutrition Advisory Group14 and EAZA Nutrition Group15. Although all the zoo-housed subjects were under the same nutritional regime, the analysis of qualitative data provided by the zookeepers revealed that European and U.S. dietary patterns differ significantly across various food macro classes. For example, in Europe, unique dietary items include greens like cabbage (chinese, savoy), Lettuce (chinese or unspecified), and herbs like parsley and chives. Vegetables such as sweet corn, kohlrabi, and jerusalem artichoke are also more common in Europe, along with fruits like lemons and pomegranates, root vegetables like beets and parsnips, and specific foods like puffed rice and browser pellets. Conversely, the US diet includes items such as kale, iceberg lettuce, green beans, rutabaga, jicama, and a wider variety of berries and tropical fruits like mangoes and blueberries. Nuts like sunflower seeds and almonds, along with commercial foods like Mazuri® biscuits and Centrum Silver™ supplements, are also commonly fed to gorillas in the U.S. No differences in food items provided by zookeepers in U.S. zoos were reported between CMD-affected and unaffected gorillas, most of which are housed in the same zoos. Dietary data provided by zoos is only qualitative, actual individual consumption data, in terms of quantities, was not collected as this determination is not part of the standard operating procedures of the zoos included in this study (See Supplementary Table 1 for zoo dietary info).
This study also included 19 wild individuals from four social groups at the Dzanga Sangha Protected Areas, Central African Republic. While most zoo-housed gorillas in the U.S. and Europe, were sampled across four time points, generally on a weekly basis, wild gorilla samples were collected twice—once during the wet season (33 samples), when they consume a high-energy diet rich in ripe fruits, and once during the dry season (36 samples), when highly fibrous herbs, leaves and other low energy foods are emphasized16 (see Fig. 1a, b and Supplementary Fig. 1 for sampling details).
Gut microbiome composition reflects differences between wild, U.S., and EU zoos
Analyses of alpha and beta diversity based on 16S rRNA gene MiSeq -V4 sequencing, revealed significant microbiome differences between zoo-housed gorillas in Europe and the U.S., and wild gorillas. These differences were evident in terms of microbiome richness (number of amplicon-sequence variants-ASVs (rarefied reads), Kruskal-Wallis test P = 2.10 × 10⁻¹³) and diversity (Simpson’s diversity Index, Kruskal-Wallis test, P = 7.14 × 10⁻¹¹ for all comparisons) (Fig. 1c–d). Specifically, we show lower bacterial diversity in all wild samples regardless of season, compared with zoo-housed gorillas across Europe and the U.S., regardless of health status.
Greater diversity in zoo-housed great apes (gorillas and chimpanzees), in contrast with wild individuals, has been observed in other datasets17, which generates questions regarding microbial selection pressures in both zoo and wild settings. Statistical comparisons including all wild and zoo-housed gorillas revealed no significant differences in alpha diversity between CMD affected and unaffected U.S. zoo-housed gorillas in terms of richness or evenness (Dunn’s test: P > 0.05, Fig. 1c). Remarkably, however, all zoo-housed gorillas in the U.S., regardless of health status, showed higher diversity when compared with gorillas from European zoos (Simpson’s diversity index, Dunn’s test: P = 0.002 and P ≤ 0.0001 for comparisons with CMD affected and unaffected gorillas respectively, Fig. 1d). Indeed, alpha diversity patterns in gorillas from European zoos were similar to those seen in free-range individuals. P values for global test and pairwise comparisons can be seen in Supplementary Table 2.
Significant differences in bacterial community composition between gorillas in zoo or wild settings were evident in multivariate ordination (Principal coordinates), and were captured via permutational multivariate analysis of variance (PERMANOVA, R2 = 0.244, P = 0.001 controlling for wild social group and zoo membership) and confirmed by testing differences in ordination scores along Principal Coordinate (PCo) axes one and two (Dunn’s test, P < 0.05, box plots appended to Fig. 1e). However, the largest effect was attributed to individual gorilla identity, given our repeated sampling (R2 = 0.46, P = 0.001). Minor but significant effects were also observed for age (R2 = 0.004; P = 0.001), sex (R2 = 0.032, P = 0.001), interactions between group and sex and interactions between group and individual. Detailed statistics of these effects can be seen in Supplementary Table 3.
These analyses mainly revealed two highly separated clusters composed by wild and U.S. zoo individuals (regardless of health status or season), with gorillas in European zoos in a midpoint of that gradient, sharing more similarity, to some extent, with the wild individuals. The existence of the widely discriminating wild and zoo-housed clusters indicates that potential compositional differences in the context of CMD were confounded by the strong effect of environmental setting in shaping beta diversity.
The strong effect of individual gorilla on microbiome composition, given weekly fecal collection is noteworthy. This individualized nature of the gut microbiome has been widely reported in humans18; but in gorillas as well, also denoting a strong influence of individualized microbiome patterns within specific zoo setting19. To assess the effect of ecological setting, independent from individual gorilla, we ran a parallel PERMANOVA controlling for individual repeated sampling (via the strata function), showing that the wild and zoo-setting effect still persisted (R2 = 0.24, P = 0.001). This parallel model also indicated a moderate effect of wild social group and zoo membership (R2 = 0.219, P = 0.001). Age, sex and their interactions with group of interest and wild social group or zoo membership also showed minor but significant effects (see Supplementary Table 4 for specific stats).
To produce a stronger model, given significant differences in sample sizes (degrees of freedom), we determined unbiased effect sizes. This unbiased estimation of effect sizes still shows that, regardless of the composition of an individual’s gorilla gut microbiome, zoo or wild setting still drove most of the microbiome variation (ω2 = 0.059, P = 0.001). This unbiased PERMANOVA model also indicated a minor, but significant effect of age (ω2 = 0.03, P = 0.001), but not of sex (P = 1). Variance and effect sizes for group of interest, sex, age, wild social group or zoo membership and their interactions, for both PERMANOVA and its unbiased model, when controlling for repeated individual sampling, can be seen in Supplementary Table 4.
The fecal metabolome also follows environmental setting differences
The 21 NMR-fecal metabolites identified belonged to broad categories showing active metabolism of amino acids, short-chain fatty acids (SCFAs), phenolic compounds and organic acids. Fecal metabolome profiles largely followed the patterns observed with the 16S rRNA data, in terms of environmental setting differences (U.S zoo-housed, Europe zoo-housed, wild African gorillas). For example, the fecal metabolome reflected dissimilarities between wild and zoo-housed gorillas, accounting for 56.7% of the cumulative variance explained by component one (38.9%) and two (17.8%) in a principal component analysis (PCA) (Fig. 1f). Just as with microbial composition, samples from European zoos lay in the midpoint of the two extremes composed by U.S. and wild gorillas. PCA loadings showed that zoo-housed gorillas in the U.S. exhibit higher amounts of all amino acids, SCFAs and the organic acid phenylacetate (Fig. 1f, Supplementary Fig. 2, Supplementary Table 5). In contrast, 3-(3-hydroxyphenyl) propionic acid, methanol, formate and ethanal were predominant in feces from wild gorillas (Fig. 1f, Supplementary Fig. 2, Supplementary Table 5).
Remarkably, the abundance of some of these metabolites in European zoo-housed gorillas reflected, to some extent, the patterns observed in wild individuals. In essence, the magnitude of change detected was lower than that seen when comparing U.S. zoo-housed and wild gorillas. For example, fecal acetate, a SCFA that would denote high fermentative activity in the colon, is highest in gorillas from U.S. zoos and significantly lower in both wild and European zoo-based individuals (Supplementary Fig. 2, Supplementary Table 5). The same patterns were observed with other metabolites such as the amino acids alanine, lysine, aspartate, methionine, tyrosine, phenylalanine, as well as the branched chain fatty acids valerate and isovalerate, and the compound p-cresol, observations that denote active colonic fermentation of dietary protein in zoo-housed individuals, particularly in U.S. settings20,21 (Supplementary Fig. 2, Supplementary Table 5). These observations corroborate a nutrient-rich and active colonic fermentation environment in zoo settings, but specifically in U.S. individuals. Still, potential distinctions between gorillas with CMD, and unaffected counterparts are obscured by the significant effect driven by free range or zoo environments.
Specific taxa, pathways and metabolites distinguished zoo-housed gorillas with CMD
Because of the strong effect of environmental setting on gut microbiome composition, that is, the two extreme clusters driven by zoo-housing or wild conditions (Fig. 1e), we explored whether potential differences driven by CMD status in U.S. gorillas could be masked by such environment-driven ordination. Therefore, we selected all samples from affected and unaffected U.S. gorillas and determined differences in alpha and beta diversity based on 16S rRNA data. These analyses indicated that CMD affected gorillas tended to have lower microbiome richness (number of rarefied ASVs, Wilcoxon rank sum test, P = 0.06), and lower diversity according to the Simpson index (P = 0.08, Supplementary Fig. 3a–b). Moreover, although clustering by CMD status was not completely clear according to PCoA (Supplementary Fig. 3c), PERMANOVA indicated significant but minor compositional differences between affected and unaffected individuals (R2 = 0.009, P = 0.006).
Therefore, we aimed at uncovering gut microbial biomarkers distinguishing CMD with increased resolution via shotgun metagenomics sequencing; to that end, we selected a subset of U.S. samples reflecting high compositional differences according to CMD status, and based on 16S rRNA- Bray-Curtis, PCoA ordination scores (Supplementary Fig. 4). This selection resulted in 75 samples from 20 U.S.-based adult western lowland gorillas, 33 of which were from 9 CMD affected individuals and 42 samples from 11 unaffected individuals (Fig. 1a and Supplementary Fig. 1). 16S rRNA analyses in the subset of samples selected revealed that the tendency for lower alpha diversity in CMD affected gorillas is maintained (Rarefied number of ASVs, p = 0.08), while clustering or discrimination between CMD affected and unaffected samples was increased (R2 = 0.06, P < 0.001, Supplementary Fig. 5).
High-depth shotgun sequencing (8–10 million reads per sample) in these subset of samples covered 8831 identified metagenomic taxa and 369 predicted microbial pathways. Taxon-based, shotgun comparative analyses of selected CMD versus unaffected gorillas, revealed that affected individuals showed significantly lower taxonomic diversity (Simpson’s diversity index, Wilcoxon rank sum test: P = 4.377 × 10⁻²) despite no differences detected in taxonomic richness (species rarified, Wilcoxon rank sum test: P = 0.1) (Fig. 2a, b).
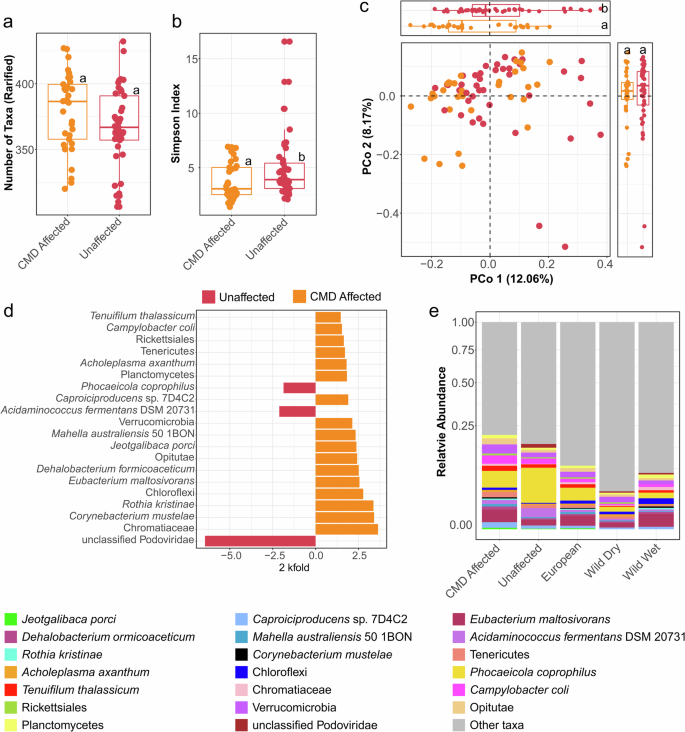
a Boxplot showing shotgun metagenomic species richness rarified between CMD affected and unaffected group. b Boxplot showing shotgun metagenomic taxonomic diversity using the Simpson’s diversity index. c Bray-Curtis-based principal coordinate analysis showing different bacterial community composition in fecal samples of CMD affected and unaffected group. Box plots on top show differences in ordination scores. d Bar chart of the 20 highest log2 fold change (FC) scored taxa selected based on significant indicator species (IndVal) and MaAslin2, with false discovery rate (FDR) threshold=0.05 comparing unaffected and CMD affected individuals. e Stacked bars showing the relative abundance of these taxa, with key color read from left to right. The box plots in (a, b) show the median as center line, box sizes indicate the lower (Q1) and upper (Q3) quartiles, whiskers indicate extreme values within 1.5× the interquartile range and dots beyond the whiskers indicate outliers. Different letters above the box plots indicate significant differences (q < 0.05) between groups, as determined by Kruskal–Wallis one-way analysis of variance followed by Dunn’s test.
Bray-Curtis PCoA showed significant taxon-based metagenomic differences based on CMD status, which was confirmed via PERMANOVA (R2 = 0.042, P < 0.001 controlling for zoo membership). Compositional microbiome differences between CMD affected and unaffected individuals were also confirmed by comparing ordination scores along component one of the PCoA (Wilcoxon rank sum test, PCo 1 P = 0.02, PCo 2 P > 0.05, box plot appended to Fig. 2c). This model did not find a significant effect of sex or age and their interactions, but showed that individual gorilla ID still contributes to the largest variation (R2 = 0.54, P < 0.001). An unbiased PERMANOVA model to determine effect sizes (ω2) of each variable shows that although the individual effect size of health status increases (ω2 = 0.19, P = 0.001), individual gorilla ID remains the strongest determinant of microbiome composition (ω2 = 0.45, P = 0.002). This unbiased model also shows a minor, but significant effect size of age (ω2 = 0.01, P = 0.01). All statistical metrics for the PERMANOVA models and their unbiased estimators can be seen in Supplementary Table 6.
A combined biomarker detection strategy based on indicator species analyses (IndVal)22 and Multivariable Association Discovery in Population-scale Meta-omics Studies (MaAsLin2)23 (Indval >0.4, fold change (FC) score> 3.0, q ≤ 0.01) identified Chromatiaceae, Corynebacterium mustelae, and Rothia kristinae as the best distinguishing taxonomic features in CMD affected individuals. We showed similar trends with Eubacterium maltosivorans, Campylobacter coli, and unknown Verrucomicrobia. On the other hand, unclassified Podoviridae, Acidaminococcus fermentans DSM 20731, and Phocaeicola coprophilus were the best discriminators of unaffected gorillas. Figure 2d, e shows differential fold changes and relative abundance of these taxa.
To determine how CMD-related taxa varied in European and wild gorillas during wet and dry season, we performed shotgun sequencing in randomly selected samples from these groups, resulting in 21 samples from 7 gorillas in European zoos, and 11 samples from 6 wild individuals collected during wet and dry seasons (Fig. 1a, Supplementary Fig. 1). Boxplots in Supplementary Fig. 6 and related P values in Supplementary Table 7 show distribution of CMD associated metagenomic taxa across all interest groups, also pointing that the abundance of taxa discriminating CMD affected vs. unaffected gorillas, for most cases, was higher in U.S. compared with European or wild samples. These taxonomic distinctions may support differential dietary exposures characterizing these two groups (Supplementary Table 1).
We used the 29 metagenomic taxa identified as potential CMD biomarkers in U.S. individuals, to build a 10 k-fold cross-validated, partial least squares-discriminant analysis (PLS-DA) model predictive of health status. We repeated a validation method, based on randomly selecting 70% of the samples for training, and using 30% of the remaining samples for validation testing 10 times, showing clear capabilities in predicting health status. Specifically, the machine learning model based on metagenomic taxa predicted health status with an average accuracy of 91.02%, balanced error rate of 14.58%, specificity of 91.60%, sensitivity of 90.31%, precision 73.89%, and F1 score 80.35% (AUC = 0.96, Supplementary Fig. 7). Additional validation using leave-one-out cross-validation (LOOCV) is reported in Supplementary Table 8.
We used HUMAnN 3.0 to assess the functional potential of the metagenomic sequence reads. Both pathway richness (Number of pathways, rarified, Wilcoxon rank sum test: P = 0.004) and diversity (Simpson’s diversity index, Wilcoxon rank sum test: P = 0.048) were significantly lower in affected individuals (Fig. 3a, b). Bray-Curtis PCoA ordination of pathways also showed significant stratification of samples based on CMD status (Fig. 3c), which was confirmed via PERMANOVA (R2 = 0.054, P = 1.00 × 10⁻⁴). Age (R2 = 0.06, P = 0.001) and sex (R2 = 0.02, P = 0.03) also had minor but significant effects, but individual gorilla ID still explains the greatest variation in microbial functional pathways between CMD affected and unaffected gorillas (R2 = 0.4, P = 0.001). Functional microbiome differences between CMD-affected and unaffected individuals were confirmed by comparing ordination scores along components one and two of the PCoA in Fig. 3c (Wilcoxon rank sum test, PCo1 P = 0.008, PCo2 P = 0.008, boxplots appended to Fig. 3c).
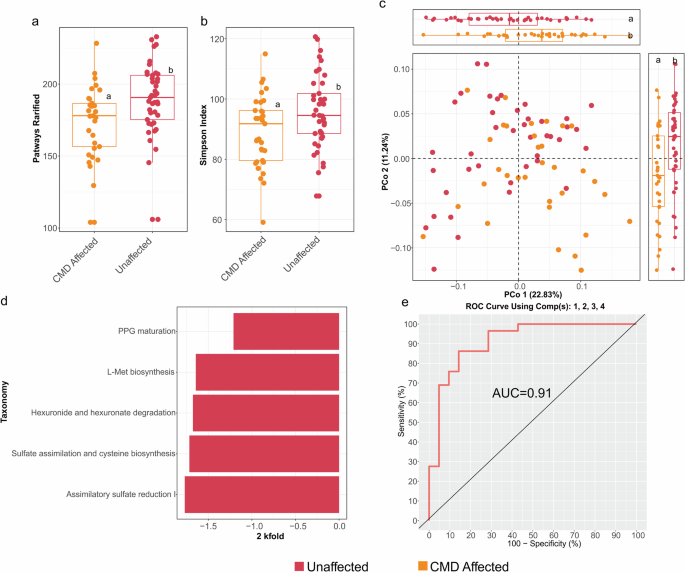
a Boxplot showing richness (rarified) of predicted metagenomic pathways between CMD affected and unaffected groups. b Boxplot showing predicted pathway diversity using the Simpson’s diversity index. c Bray-Curtis-based principal coordinate analysis based on pathway presence and abundance in fecal samples of CMD affected and unaffected groups. Box plots on top show differences in ordination scores. Different letters above the box plots indicate significant differences (q < 0.05) between groups, as determined by Kruskal–Wallis one-way analysis of variance followed by Dunn’s test. d Bar chart of the log2 fold change (FC) of discriminant pathways selected based on significant indicator value (IndVal), and MaAsLin2, with false discovery rate (FDR) threshold = 0.05, comparing unaffected and CMD affected individuals. e ROC curve showing the predictive power of the selected discriminant pathways for classification of CMD and unaffected individuals. L-Met biosynthesis: L−methionine biosynthesis by sulfhydrylation, PPG maturation: peptidoglycan maturation meso−diaminopimelate, CMD cardiometabolic disease.
The unbiased PERMANOVA analyses, corroborate a significant effect of health status on microbial functions (ω2 = 0.040, P = 0.001), as well an effect of age (ω2 = 0.074, P = 0.001) and individual gorilla ID (ω2 = 0.038, P = 0.001), but not of sex. All statistical metrics for the PERMANOVA models and their unbiased estimators for the pathways data can be seen in Supplementary Table 9.
To detected discriminant microbial pathways discriminating CMD affected and unaffected gorillas, we also used a combined biomarker detection strategy (Indval>0.4, MaAsLin fold change (FC) score>1.0, q < 0.05) as with the metagenomic taxa. These analyses showed significant depletion of assimilatory sulfate reduction I (SO4 reduction I), superpathway of hexuronide and hexuronate degradation, superpathway of sulfate assimilation and cysteine biosynthesis, superpathway of L−methionine biosynthesis by sulfhydrylation (L-met biosynthesis) and peptidoglycan maturation meso−diaminopimelate (PPG maturation) (Fig. 3d) in CMD affected gorillas. There were no significantly enriched pathways associated with CMD (Fig. 3d). Health status prediction models using the selected predicted pathways scored an average accuracy of 75.13% and balanced error rate of 22.44%, specificity of 92.06%, sensitivity of 52.50%, precision 82.5% and F1 score of 67.05% (AUC = 0.91, Fig. 3e). Supplementary Table 8 reports further validation using LOOCV.
PCA on the whole fecal metabolome showed no clear distinctions based on health status in U.S. zoo-housed gorillas (Fig. 4a); however, pairwise comparisons based on individual metabolites showed that five out of twenty-one identified metabolites were significantly different between CMD affected and unaffected individuals. These markers mainly revealed lower abundance of methionine, lysine, propionate and butyrate in gorillas affected with CMD, who in turn, showed higher abundance of ethyl acetate (q < 0.05, Fig. 4b, Supplementary Table 10). We repeated a PLS-DA model created from a 10 k-fold cross validation method 10 times for prediction accuracy of health status in U.S. zoo-housed gorillas based on these discriminant metabolites. The prediction method was done by randomly selecting 70% of the samples for training, using the 30% of the remaining samples for validation and repeated 10 times. This metabolite-based model predicted disease status with average accuracy of 79.96%, balanced error rate of 45.22%, specificity of 83.36%, sensitivity of 41.32%, precision of 15.16% and F1 score of 21.05% (AUC = 0.69, Fig. 4c). Supplementary Table 8 reports on further validation using LOOCV.
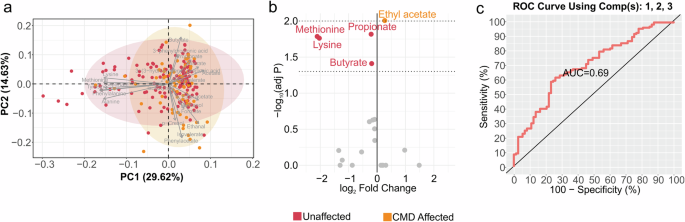
a Principal component analysis of fecal metabolites in unaffected and CMD affected individuals. b Volcano plot significantly showing discriminant metabolites between unaffected and CMD affected individuals. c ROC curve from the PLS-DA model implemented using the selected metabolites, and predicting CMD status. CMD cardiometabolic disease. Exact individual P values are available in Supplementary Table 9.
Integrated metaOMIC analyses predicted cardiometabolic disease with decreased error rate
Based on the detection of compositional and functional biomarkers potentially distinguishing CMD in U.S. zoo-housed gorillas, we applied an integrative, multiOMIC predictive model using k-fold cross validation, with 10 iterations. This model, which considered the three datasets combined, showed average cross-validation accuracy of 90.98%, balanced error rate of 14.35%, specificity of 91.85%, sensitivity of 88.03%, precision of 74.72% and F1 score of 80.0%. Indeed, the AUC for the predictive power of each dataset, in association with the remaining two, increased overall prediction accuracy compared with when datasets were used alone. For example, the AUC for metagenomic taxa, metagenomic pathways and metabolites, when considering the remaining two datasets were 0.95 (Fig. 5a), 0.84 (Fig. 5b) and 0.83, (Fig. 5c), respectively.

ROC curve for shotgun metagenomic identified taxonomy markers (a), pathway abundance (b) and metabolomics markers (c) comparing CMD and unaffected individuals within multi-block PLS-DA models. d Correlation circle plot showing the association of significant indicators between unaffected and affected groups from metabolomics, taxonomic, and functional pathways. The closer two variables are to each other the stronger is the association between them as indicators of health status. e Inter-omics matrix scatter plot displaying the first component in each of the three omics datasets (upper diagonal plot) and the Pearson’s correlation for each dataset (bottom diagonal plot). AUC area under the curve, CMD cardiometabolic disease. All associations P < 0.05.
We used a multi-block partial least-squares analysis (multi-block PLS-DA) to indicate significant associations between the pathways, taxa and metabolites involved in our classification models. For instance, the production of propionate and butyrate corresponded with the abundance of genes involved sulfate assimilation and cysteine biosynthesis, assimilatory sulfate reduction I, L-methionine biosynthesis (L-met biosynthesis) and degradation of hexoses. Abundances of lysine and methionine corresponded with the processing pathways for peptidoglycan (PPG maturation) and the abundance of Acidaminococcus fermentans DSM 20731, all of which characterized unaffected gorillas. All of these markers, more prevalent in unaffected individuals, confirmed a depletion in the abundance of genes and metabolites involved in the metabolism of sulfur-containing amino acids and short chain fatty acids in gorillas diagnosed with CMD (Fig. 5d). The multi-block discriminant analysis corroborated significant associations between the metagenomic taxa, metagenomic pathways and metabolomic data, along with a significant predictive power of the multiOMIC associations in discriminating samples based on CMD status (Fig. 5e, all correlations 0.45–0.62, P < 0.01).
Discussion
We examined the composition and function of the microbiome of zoo-housed and wild western lowland gorilla cohorts to study associations between gut microbiome composition and function and cardiometabolic disease (CMD). Outside of the expected microbiome differences between zoo-housed and wild cohorts, which have been widely reported17,24, these microbiome and metabolome data revealed significant differences between CMD affected and unaffected gorillas. The purpose of including wild samples, despite the known differences between zoo-housed and wild gorillas, was to establish a baseline measurement of gut microbial diversity and function that would allow us to better understand ecological correlates of CMD in gorillas.
Zoo-housing induces a rich gut microbiome and metabolome in gorillas
One of the most remarkable characteristics of zoo-housed gorillas, regardless of health status, was the high gut microbial diversity and a gut metabolic environment more associated with increased fermentation of simple carbohydrates and in particular, dietary protein, mainly in U.S. individuals. This observation may reflect, to some extent, the dietary qualitative data provided by U.S. zoos (Supplementary Table 1). This included a great variety of ripe fruits, cereal, zoo-biscuits, low-fiber greens and vegetables, protein-dense foods such as peanuts, walnuts, sunflower seeds, protein shakes, lentils and yogurt and miscellaneous foods such as eggs, bread, honey, popcorn, and sugary rice bars among many others in a very eclectic diet. Based on metabolome distinctions with wild individuals, and previous reports of higher microbiome diversity in zoo-housed compared with free-range gorillas17,25, we can speculate that U.S. zoo settings may provide an environmental and nutritional niche that amplifies compositional and functional microbial diversity. Zoo diets may also result in a metabolically-rich gut where short chain and branched chain fatty acids predominate as products of active amino acid and sugar fermentation. It is likely that the metabolite richness observed in zoo settings is associated with the metabolism of less fibrous and more easily fermentable foods.
For example, although these data cannot show that U.S. zoo-housed gorillas actually consume less fiber, the qualitative dietary differences presented in Supplementary Table 1, do indicate differential exposure to fibrous foods between U.S. European and wild gorillas. Furthermore, the complete absence of metabolites such as 3-(3-hydroxyphenyl) propionic acid in U.S. gorillas, compared with wild individuals, may denote lack of highly lignified fibers in their diets. This metabolite is one of the main end products of the degradation of hydroxycinnamic acids (e.g., ferulic and caffeic acid), abundant in the hemicellulose and cellulose cell walls of fibrous plant materials26. The degradation of high cellulose substrates is also associated with production of formate, ethanal and methanol27,28, metabolites that were also depleted in zoo-housed gorillas, particularly in U.S. settings. Indeed, fecal methanol can be derived from methoxylated carbohydrates, such as pectin or lignin29,30,31. The higher presence of formate, ethanal and methanol in gorillas from European zoos, along with the lower abundance of acetate, propionate, and butyrate they showed, in levels that resemble those seen in wild individuals, may indicate more emphasis on highly lignified or pectin-rich diets in European settings. Still, the gut microbiome of affected gorillas showed unique taxonomic and functional profiles in association with impaired fermentation capacity.
CMD is associated with abundance of potentially inflammatory bacteria and lower SCFA production
Here, we report gut biomarkers that may help in identifying the etiology of CMD gorillas, possibly showing parallels with heart disease in humans. For instance, it is remarkable that, compared with unaffected individuals, the fecal microbiome of CMD affected individuals showed lower taxonomic and functional diversity, along with decreased fecal levels of butyrate and propionate. This observation may denote altered or reduced capacity for the microbial metabolism of dietary carbohydrates and proteins, contrary to what we observed in unaffected U.S. zoo-housed gorillas. Reduced microbial diversity and different microbiome profiles have previously been reported in humans with heart failure32. Additionally, and in line with these results, low microbiome diversity in heart disease in humans can coincide with lower capacity to produce short chain fatty acids, and particularly butyrate33,34,35. Previous reports have also suggested that reduced fecal butyrate in patients with heart failure is associated with low fiber intake33, in line with the absence of metabolites associated with the processing of highly lignified plants as aforementioned for U.S. zoo-housed gorillas. Moreover, depletion of the microbial superpathway of hexuronide and hexuronate degradation in gorillas with CMD may indicate that these gorillas’ microbiomes are not as efficient in fermenting sugars as their unaffected counterparts. Depletion of this pathway in the gut microbiome has been recently associated with low SCFA production in diseases associated with gut and systemic inflammation36,37.
In humans, propionate, which was also depleted in CMD subjects compared with unaffected individuals, has been shown to play a protective role from cardiac hypertrophy, fibrosis and hypertension38. The roles of propionate and butyrate as inducers of insulin sensitivity (through agonism with the hormones peptide YY and GLP-1) are widely known39,40. This is an interesting observation given that adiposity, along with high leptin and low adiponectin have been associated with CMD in gorillas1. Indeed, previous studies have demonstrated that both obesity and insulin resistance occur in zoo-housed gorillas41, and that butyrate and propionate can activate adiponectin to alleviate insulin resistance42,43. Among the taxonomic markers distinguishing unaffected zoo-housed gorillas and in concordance with our multi-OMIC association analysis, Phocaeicola coprophilus and Acidaminococcus fermentans are reported to efficiently produce propionate and butyrate by metabolizing sugars, but specially amino acids particularly in the former44,45. These observations shed light on a potential role of impaired gut butyrate and propionate production in gorillas with CMD, showing possible parallels with the disease as observed in humans with myocardial fibrosis46.
In this regard, the increased abundance of the typical enteric pathogen, Campylobacter coli, in gorillas with CMD is noteworthy. Capacity to induce intestinal damage has been observed in animal models of Campylobacter infection47; in turn, intestinal barrier dysfunction has been linked to cardiovascular disease in humans48,49. In this scenario, the lipopolysaccharide (LPS) endotoxin encoded by enteric pathogens such as Campylobacter would induce bacterial translocation from gut to systemic circulation with subsequent release of proinflammatory cytokines, which has been observed in human chronic heart failure50,51. Remarkably, LPS has been proven to enhance collagen production by fibroblasts52,53, the main hallmark of the kind of CMD seen in gorillas1. Infections with enteric pathogens such as Campylobacter are also reported to lead to cardiovascular complications via hemolytic uremic syndrome54,55. Importantly, the role that butyrate has on inhibiting the growth of potential enteric pathogens that cause inflammation has been highlighted before56. In light of the role that SCFAs, and butyrate in particular, have on protecting intestinal barrier integrity57, it can be hypothesized that altered intestinal integrity triggered by potential gut pathogens, in tandem with reduced capacity to produce butyrate and propionate, may be another potential mechanistic parallel characterizing CMD in both humans and gorillas51.
Hypotheses of a potentially dysregulated or pro-inflammatory intestinal environment in gorillas with CMD, besides increased presence of Campylobacter coli, can be pursued along with analyzing other taxonomic markers. For instance, although we did not find the genus Treponema to be enriched in gorillas with CMD as reported previously12, there were several rare taxa characterizing the CMD group and that have been associated with adverse health outcomes. Such is the case of Chromaticeae, a representative of the Gammaproteobacteria previously linked to intestinal inflammation, hypercholesterolemia, and metabolic syndrome58,59,60. Other taxa characterizing the CMD group, and also not typically reported to be part of the core gut microbiome in wild gorillas, have been linked to sepsis (Corynebacterium mustelae)61 and obesity-related asthma (Dehalobacterium formicoaceticum)62. Opitutae, another rare taxon more abundant in gorillas with CMD, has been seen to increase in the gut of black howler monkeys living in forest fragments, who also exhibit low butyrate production capacity and high abundance of bacterial genes potentially associated with intestinal inflammation (hydrogen sulfide production)63. The high abundance of Verrucomicrobia observed in CMD gorillas is noteworthy, given reports of increases in the proportion of members of this phylum (e.g., A. muciniphila) in conditions where the intestinal mucus layer is eroded, leading to systemic inflammation64,65,66. However, contrary to what has been reported in humans67, higher abundance of systemic inflammatory markers such as TNF-α does not predict CMD in gorillas68.
The abundance of other rare taxa characterizing gorillas with CMD is hard to explain (e.g., Acholeplasma, Planctomycetes, Chloroflexi, Caprociproducens, Jeotgalibaca, Mahella, Rickettsiales, Rothia and Tenuifolium), beyond the associations previously stated. However, it is interesting that several of these taxa are also abundant in the gut of wild gorillas during the wet season (see Fig. 2e and Supplementary Fig. 6), where in theory, emphasis is made on foraging for ripe fruits with high sugar content69. This observation generates questions regarding the intersections between consumption of energy dense diets, the proliferation of potentially pathogenic bacteria and a compromised intestinal barrier integrity as potentially convergent triggers of CMD in zoo settings.
Gorillas with CMD show different gut metabolism of amino acids
In humans, one of the main mechanisms by which gut microbes affect CMD risk involves intake of high protein foods rich in phosphatidylcholine and L-carnitine, and subsequent gut bacterial conversion to trimethylamine (TMA). TMA is further transformed by the host into TMA-oxide (TMAO), which induces cholesterol accumulation and atherosclerosis development10,11. Although CMD in gorillas has not been related to atherosclerosis1, TMA-O has been involved in the myocardial fibrosis that typically characterizes apes via inflammation70,71. Interestingly, TMA production capacity from L-carnitine has been identified in typical enteric pathogens of the Proteobacteria phylum such as Campylobacter72,73, one of the main taxonomic markers of gorillas with CMD as shown here. However, these data provide no evidence that microbial TMA may be potentially associated with CMD in gorillas. In theory, the observed predominance of Eubacterium maltosivorans in gorillas with CMD could prevent the formation of TMA by demethylating carnitine as it has been proposed recently74.
Instead, one of the main gut metabolic signatures of gorillas with CMD was the lower abundance of the sulfur-containing amino acid methionine and cysteine, and the microbial pathways associated with their generation, namely L−methionine biosynthesis by sulfhydrylation (L-met biosynthesis), sulfate assimilation and cysteine biosynthesis, and assimilatory sulfate reduction. Collectively, these markers would indicate that fecal bacterial communities in gorillas with CMD have lower capacity to synthesize methionine and cysteine75. The role of sulfur-containing amino acids in heart disease, as produced by fecal bacteria, is hard to assess, given that the colon is not an active site for amino acid absorption.
However, impaired methionine and cysteine metabolism in human subjects with cardiovascular disease and cardiac fibrosis has been reported previously76,77, including a predicted inability to synthesize methionine or cysteine from homocysteine by the fecal microbiome78. In this process, systemic homocysteine accumulation would result in a risk factor for heart disease. Although these data cannot prove that an inability to synthesize methionine at gut level would result in greater homocysteine levels in circulation, work with germ-free animal models has shown that intestinal levels of methionine correlate, inversely, with the levels of homocysteine in serum. This means that the gut microbiome can actively contribute to the systemic metabolism and turnover of methionine and homocysteine79.
Remarkably, all fecal amino acids were depleted in gorillas with CMD. The reasons for this depletion are not immediately clear, but their low abundance in the distal gut may signal less availability, as substrates, for SCFA generation. This is because, although carbohydrates are the main substrates for SCFA synthesis in the gut, undigested amino acids and protein can also be a significant substrate for the generation of SCFAs80. For example, lysin, which was detected in higher abundances in unaffected gorillas can serve as a substrate for butyrate production81. In this regard and as mentioned previously, it is interesting that our meta-OMIC, multi-block discriminant analysis shows high correspondence between all amino acids and Acidaminococcus fermentans, a bacterium significantly depleted in CMD subjects and that uses amino acids as a sole energy source or fermentation substrate to mainly produce butyrate and propionate45, both depleted in gorillas with CMD. Conversely, amino acid depletion in CMD gorillas could also signify active conversion to other metabolites with potential proinflammatory roles in the gut and systemically, such as hydrogen sulfide, ammonia, or p-cresol. However, we detected no CMD-specific profiles regarding these byproducts. Given that gut amino acid homeostasis may be a potential promising biomarker with diagnostic and prognostic values for heart failure82, the significance of fecal markers that denote impaired metabolism of amino acids in gorillas with CMD needs to be assessed from a systemic perspective.
Strength and limitations of the study
Although our results support that fecal biomarkers can be used in tandem to predict CMD health status in zoo-housed gorillas, our data has specific limiting factors that future studies should account for. One example is the limited number of zoo-housed individuals we could sample, including those with diagnosed cardiometabolic disease. Increasing the number of individuals would increase statistical power and improve depth for machine learning training analyses. Another limitation related to the sample size is the application of the machine learning prediction models. Although we performed both k-fold and leave one out cross validation (LOO) models for verifying accuracy, LOO accuracy needs to be interpreted carefully because each individual has four samples from different time points. However, because population sizes within each cohort were relatively small for these kinds of analyses, the LOO model is more appropriate in this case since it uses more training samples in each iteration, compared, for instance, with k-fold cross validation83. Given a more robust population size, an alternative model can focus on double blind testing to confirm that our model is not biased by repeated sampling input.
Likewise, testing the model on a bigger population of undiagnosed, non-U.S. individuals would help identify if this prediction model is applicable to other zoo environments. Unfortunately, this procedure cannot be done in European zoos since they do not routinely record cardiometabolic data due to concerns of health risk from anesthesia. Therefore, although attempting double-blind testing using European zoo-housed gorillas was beyond the scope of this study, we acknowledge that the fact that some of the European zoo-housed gorillas may also be afflicted by CMD is a limitation of the study. Another important limitation focuses on the dietary information collected by collaborating zoos. The exact amounts of foods individual gorillas consumed is not recorded routinely by zoo staff due to logistic limitations. This knowledge would allow a fourth quantifiable variable that could be used to assess gorilla CMD from a dietary standpoint and improve the predictive power of machine learning algorithms.
Despite all these limitations, ours is the most powered study conducted so far on the microbiome of gorillas diagnosed with cardiometabolic issues, including wild and zoo-housed gorillas. Additionally, while the use of machine learning for understanding gut microbiome and metabolomic markers of heart disease has been substantially explored in humans84,85, these analyses have not been applied to assess microbiome-based disease risk in non-human primates. Thus, these data constitute a breakthrough probe into the capabilities of machine learning prediction for assessing cardiometabolic disease in apes. Moreover, these data allow for a better understanding of the core causes of CMD in western lowland gorillas, who have significantly different biochemical designs in terms of cardiometabolic system, compared with humans. However, relative to one existing report on the taxonomic composition of the gut microbiome of gorillas with CMD (n = 4)11, we take a step further by mapping functional associations between the microbiome and its metabolites in a greater number of individuals to better understand the role of the gut microbiome in impacting cardiometabolic disease in apes. Finally, although past studies compared the fecal microbiomes zoo-housed and wild great apes2,17, this is the first study focusing on multiOMIC markers of disease in non-human primates at national and continental scales.
Potential implications to understand heart disease in human and zoo-housed nonhuman primate populations
Here, we report fecal microbiome and metabolome markers that distinguish gorillas with CMD from unaffected individuals in U.S. zoos. These markers show a substantial deviation from baseline values characterized in wild individuals and gorillas from other zoo populations with unknown CMD status, particularly in Europe. Given the highly fermentative gut environment that characterized zoo-housed gorillas, especially in U.S. settings, and the lack of metabolic markers associated with the processing of highly lignified or fibrous plant materials in this population, parallels can be drawn on the ecological and evolutionary factors believed to trigger diseases in humans. In this analogy, deviations from baseline diets concordant with a primordial, evolutionary niche are hypothesized to have happened too fast, leaving our genomes poorly adapted to these rapid dietary changes and leading to the so-called disease of civilization, which includes CMD86,87.
The gut microbiome and metabolic markers associated with lifestyle dietary changes in humans have been widely characterized, as being likely triggered by diets high in saturated fats, sodium, protein, simple, readily fermented carbohydrates and low in micronutrients (polyphenols and vitamins)88,89. These data point to similar distinguishing features in zoo-housed gorillas in contrast with wild individuals, which would put diet at the center stage of CMD etiology as the leading mortality cause in zoo settings1. However, since not all zoo-housed gorillas develop the disease, the data provided herein needs to be further tested to dissect other factors, including behavioral, social, environmental, infectious or genetic and their relative contribution to CMD progression in each individual.
Moving forward, and highlighting some of the main findings reported here, further work is needed on exploring a possible link between impaired production of butyrate and propionate, systemic metabolic homeostasis (leptin and adiponectin levels), markers of intestinal integrity (permeability or intestinal damage) and both pro and anti-inflammatory cytokines in gorillas with CMD. These markers acquire significant importance due to parallels with heart diseases in humans. Some of these factors, particularly cholesterol balance or TNF-α have been explored previously in gorillas, however, they show opposite patterns to what humans with heart disease exhibit1,68.
Studying the environmental factors (diet, setting) that trigger the abundance of gut bacteria with potential inflammatory roles in gorillas with CMD could be a relevant area of exploration, given preliminary associations between enteric pathogens, intestinal permeability, energy-dense diets and heart disease reported in humans across different studies. Zoos already make significant efforts to guarantee the welfare of zoo-housed apes, including testing diets that resemble those seen in the wild and that have the potential to modulate the gut microbiome in zoo settings41. Likewise, dietary correlates of heart disease, including the role of gut microbes, have been substantially studied in humans, including the study of intestinal barrier dysfunction as a therapeutic target for heart disease. However, studies that directly assess and incorporate markers of intestinal integrity, enteric pathogens and microbiome function in tandem with the characterization of systemic health in zoo-housed great apes are lacking. Hence, these data open the door to consider more inclusive studies that highlight taxonomic and functional features in the gut microbiome and markers of intestinal integrity that can be targeted to better understand and treat the disease in apes. The human and nonhuman primate parallels that we discuss corroborate critical associations between lifestyle, diet and disease, placing gorillas as an interesting evolutionary and ecological model to characterize cardiometabolic diseases from a gut microbiome perspective.
Methods
Study subjects
The study took place between June 2019 and October 2020. We included 93 adult western lowland gorillas from which fecal samples were collected multiple times resulting in a total of 350. We collected four samples from each individual weekly, unless specified in Supplementary Fig. 1; two samples per individual from wild seasonal samples, unless specified in Supplementary Fig. 1. The wild individuals were from three habituated groups inhabiting Dzanga Ndoki National Park, Central African Republic. We collected fecal samples from 19 gorillas during the wet season (yielding a total of 33 samples) and the dry season (resulting in 36 samples), consisting of 8 males and 11 females. Zoo-housed individuals were housed in 11 U.S. zoos and 5 European zoos. All zoo-housed animals were born in zoos, except one individual in Dvůr Králové Zoo born in the wild. We collected fecal samples from 57 gorillas across various zoos in the United States, yielding a total of 214 fecal samples. In total, U.S. gorillas that were diagnosed with CMD by their respective zoos were composed of 20 individuals (73 fecal samples collected), consisting of 17 males and 3 females with an age range of 13 and 58 years. The number of unaffected U.S. gorillas was 37 (141 fecal samples collected) consisting of 21 males and 16 females with an age range from 15 to 56 years. We sampled 17 gorillas from European zoos, consisting of 6 males and 11 females with an age range from 8 to 47 years. The diagnoses were done by veterinarians at each U.S. zoo, following clear, established protocols used in the United States according to Boyd et al. (2020)13. Figure 1a, b and Supplementary Figure 1 provide comprehensive details about the characteristics of the study subjects, including the timing of sampling and the samples analyzed for both compositional and functional microbial marker analyses. The animals were managed under similar husbandry protocols including a diet of commercially available fresh vegetables and fruits, and available biscuits formulated to meet the nutritional needs of apes. Alfalfa and browse were offered as dietary enrichment. The diets met the nutritional recommendations of the AZA Nutrition Advisory Group14 and EAZA Nutrition Group15. Among the subjects recruited through U.S. based zoos, the health status concerning cardiometabolic disease was assessed using Cardiac ultrasonography via transthoracic echocardiogram and was performed using standard protocols1. These procedures are not regularly performed in European zoos due to the need for anesthesia.
Sample collection
We collected the samples non-invasively approximately 30 min after defecation, and we immediately preserved about 2.5 g of fecal samples from the core of the bolus in 2.5 ml of ethanol (96% v/v, Fisher Scientific) and stored them at ambient temperature until shipment. Although this method presents some limitations for fecal microbiome integrity and metabolome degradation, it is feasible for field studies and recommended to be efficacious in preserving the fecal microbiome and metabolome compared to the gold standard for microbiome preservation (immediate freezing at −20 °C or below90,91,92). This method has been successfully applied in multiple studies in the field, including our own93,94,95. We kept the samples at –80 °C prior to analysis. We collected four samples from each individual weekly, unless specified in Supplementary Fig. 1; two samples per individual from wild seasonal samples, unless specified in Supplementary Fig. 1. We recorded sex, zoo or group, and age if applicable for each individual. The effect of age was analyzed by separating individuals into three groups. One group designated as adults who are between 12 to 40 years old, another group designated as geriatric who are individuals 40 or older and another group designated as young who are individuals 12 and younger.
Total DNA extractions
We used the DNeasy PowerSoil Pro Kit (Qiagen) according to the manufacturer’s instructions to isolate the total DNA at the University of Minnesota, Twin Cities. We assessed the quality and quantity of the extracted DNA by NanoDrop™ 2000c spectrophotometer (ThermoFisher Scientific).
Amplicon taxa profiling
We applied pair-end sequence on all samples by the Illumina-MiSeq platform using primers 515 F GTGCCAGCMGCCGCGGTAA forward and 806 R GGACTACHVHHHTWTCTAAT to amplify the V4 region of the 16S rRNA gene. Total number of forward and reverse reads was 32,047,808, with 91,565 reads per sample on average. We removed sequencing primers, low-quality reads, and short read sequences using the cutadapt unix tool, removing forward and reverse reads with an average quality lower than 30%, and removing untrimmed reads. We paired forward and reverse reads using bbmap using default parameters. After quality filtering the total number of high quality forward and reverse reads was 21,996,528, with 62,847 reads per sample on average. We then imported matching reads and demultiplexed within QIIME2™ (v.2020.8, ref. 96). We processed the ensuing demultiplexed fastq files by the DADA2 qiime2 plugin pipeline (v.2020.8.0, ref. 97) for sequence grouping. We taxonomically classified sequences to species level using the greengenes2 database (v.2022.10, ref. 98) within QIIME 2™. The total number of ASVs was 7,086,133 and ASVs per sample was 20,246 on average.
Metagenomic shotgun profiling
Shotgun metagenomics profiling was performed on fecal samples from 32 gorillas, resulting in a total of 102 samples. The subset of samples selected for U.S. gorillas was based on those from CMD affected and unaffected individuals showing maximum dissimilarity in 16S rRNA, Bray-Curtis distances along axis one and two of a PCoA (Supplementary Fig. 1). Samples from European Zoo-housed gorillas and from wild gorillas in wet dry seasons subjected to metagenomics analyses were randomly selected. We performed library prep using Illumina Nextera XT (Illumina) and sample sequencing using the Illumina NovaSeq platform (Illumina) totaling on average 5.3 million reads per sample. Using the Kneaddata unix tool (v.0.10.0, ref. 99). We removed adapters and low quality reads using default parameters. We set trimmomatic parameters within kneaddata to SLIDINGWINDOW:4:20 MINLEN:90. We performed taxonomic assignment by using the computational tool Kraken2 (v.2.0.8, ref. 100) using the standard NCBI RefSeq complete database embedded within kraken,which includes bacteria, viral, plasmid, and Univec_Core taxonomic information. The average number of taxonomic reads was about 4.7 million reads per sample. Using at taxonomic level read counts, we then removed read counts that were unidentifiable to Domain level. Including unidentified reads accounting for on average 75.46% of reads per sample. At level Root reads, accounting for on average 2.37% of reads per sample. At level Cellular organisms reads, accounting for on average 3.60% of reads per sample. We also calculated the predicted pathway abundance using HUMAnN 3.0 with default parameters using the Chocophlan nucleotide database and Uniref protein database (ref. 101). Counts were normalized to read per millions (RPMs) from course per kilobytes (CPK).
Fecal metabolome profiling
We used untargeted 1H NMR metabolomics for metabolite profiling. We thawed and vortexed the samples (28 × g, 10 s, room temp.); then, we placed 150–200 mL aliquots in 1.5 mL microcentrifuge tubes and diluted at a 1:5 ratio (w/v) with ultrapure water followed by vortexing (28 × g, 10 s, room temp.) and centrifugation (24,5000 × g, 10 min, room temp.). We transferred each 576 μL of the resulting supernatant to another 1.5 mL microcentrifuge tube, and 64 μL of phosphate-buffered saline (PBS, 1.5 M K2HPO4 / 1.5 M NaH2PO4, 5 mM 3-(trimethylsilyl)-2,2,3,3-tetradeuteropropionic-d4 acid (TSP) in D2O, 0.2% NaN3, pH 7.4) solution was added and then centrifuged (24,5000 ×g, 10 min). We transferred the resulting supernatant (500–550 μL) to a 5 mm NMR tube (Norrell) and introduced it into the NMR spectrometer for analysis. We recorded 1H NMR spectra on a 500.23 MHz Bruker Avance III spectrometer at a temperature of 298 K, equipped with a BBFO SmartProbe™ with Z-axis gradients and autosampler (Bruker Biospin GmbH). We used a standard Bruker “noesypr1d” (90°-t1-90°-dmix-90°-FID) pulse sequence to suppress signals from water molecules, where t1 is a 4 μs delay time and the mixing time of 0.1 s. Acquisition parameters for the spectra were 128 scans, a 16 ppm spectral width collected into 64 K data points, an acquisition time of 4 s, and an interscan relaxation delay of 5 s. We run automatic routine including tuning, 3D shimming, 90° pulse calibration and automatic receiver gain setting prior to each sample. We zero-filled, manually phased, and baseline corrected the free induction decay obtained to 65k, Fourier-transformed, using Whittaker smoother algorithm in MestreNova NMR Suite software package (v.11, Mestrelab Research). We identified and quantified the metabolites from the corrected spectra via the library ChenomxNMR Suite (v.8.6, Chenomx Inc.). Due to the unknown dilution ratio of ethanol in the fecal samples, we normalized the concentrations by the total sum of the metabolites.
Statistical analyses
All statistical analyses were conducted in the R statistical interface v 4.3.3102. Alpha diversity metrics of 16 rRNA amplicon sequence data (ASVs rarified, and Simpson’s diversity indices) were analyzed using Kruskal–Wallis one-way analysis of variance followed by Dunn’s test R package dunn.test (v 1.3.6, ref. 103) for pair-wise comparisons corrected with Bonferroni method for multiple comparisons. Beta diversity was assessed using Bray-Curtis distance matrices coupled with Principal Coordinates analysis (PCoA) to establish compositional differences between cohorts, as calculated using the vegan v2.6_4 package104. Compositional differences in multivariate space were further assessed by comparing PCoA scores along axis one and two among groups, via using Kruskal–Wallis one-way analysis of variance followed by Dunn’s test for paired comparisons, corrected with the Bonferroni method. Differences in Bray-Curtis dissimilarities between groups were also assessed by applying permutational multivariate analyses of variance (PERMANOVA) using the adonis2 function of the Vegan R package103. This procedure was done by restricting permutations for wild group membership and zoo location using the function strata within adonis2, the purpose was to get a better understanding on the specific effects of cohort groups on microbiome composition while controlling for these factors. In addition, age and sex were also incorporated into the PERMANOVA models. To assess unbiased estimators of effect sizes (Omega squared, ω2) for each of the different variables of interest, a cumulative effect size model was applied using the function adonis_OmegaSq from the R MicEco package v0.9.15105. Statistical analysis of shotgun metagenomics data for alpha and beta diversity metrics was performed as stated above. Exact effect sizes and individual P values for both amplicon and shotgun metagenomics data are available in Supplementary Tables 3, 4, 6.
To get a better understanding of which specific taxa are the key contributors to the differences we observed in alpha and beta diversity, we applied a three-method statistical filter accounting for locality, sex, and diet biases. First, we applied an indicator species analysis that selected taxa with an indicator value greater than 0.5 (P value < 0.05). We then used microbiome multivariable association with linear models (MaAsLin2) to filter out indicator species that were not significant contributors based on MaAsLin2’s linear modeling. MaAsLin2 filtering was done based on a false discovery rate (FDR) adjusted P value lower than 0.05. Finally, we applied a 2 k-fold analysis on the shotgun metagenomics taxa. Only taxa from the 2 k-fold validation procedure that had an FDR-adjusted P value lower than 0.05 were kept. After applying these three filters 29 taxa were identified. The top 20 taxa were further investigated using Kruskal–Wallis one-way analysis of variance followed by Dunn’s test for paired comparisons corrected via Bonferroni. Exact individual P values are available in Supplementary Table 5. Wilcoxon rank sum test was used for pair-wise comparisons. We then applied the same methodology on the predicted pathway abundances generated from the shotgun metagenomics data. This procedure identified five pathways that were indicators of health status. PERMANOVA exact effect sizes and individual P values are available in Supplementary Table 6.
We evaluated the normalized abundances of fecal metabolites by PCA as exploratory analysis to evaluate the differences between the five different groups. Prior to conducting PCA, we verified that our metabolomics data met the key assumptions, including linearity (assessed by considering the nature of the variables and their relationships), and mean-centering and scaling (autoscaling was applied). We further tested each metabolite using Kruskal–Wallis one-way analysis of variance followed by Dunn’s test for paired comparisons corrected with Bonferroni method for multiple comparisons or Wilcoxon rank sum test for pair-wise comparisons. We corrected P values for multiple comparison testing with the Bonferroni method (q < 0.05). Exact individual P values are available in Supplementary Tables 5, 10. This procedure identified five fecal metabolites that were indicators of health status.
To establish machine learning and prediction capabilities we applied PLS-DA and multi-block PLS-DA on the U.S. cohorts from either the 29 taxa established, five predicted pathways, the five metabolites, or as a combined set as indicators of CMD affected and unaffected cohorts using the R package MixOmics (v6.20.0, ref. 106). We evaluated model performance by AUC plot along with an average specificity, sensitivity, accuracy, precision, recall, and balanced error rate. To create the AUC we applied a 10 k-fold cross validation repeated 10 times using the Mixomics perf function. Then using the Mixomics auroc function we created the AUC with the overall lowest error rate. We created a custom-written model, selecting a random set of 70% of the gorillas for each cohort for training the model, and the remaining 30% for testing. We then applied the predict function from the labdsv r package (v2.1-0) to create a machine learning model to construct an error rate confusion matrix. We repeated this procedure 10 times to account for potential sampling bias. We averaged the accuracy, balanced error rate, sensitivity, specificity, precision, recall, and F1 scores from each iteration. We further evaluated the models using LOOCV, which is a well-established validation method robust against low sample sizes83.


Responses