Cas12a-knock-in mice for multiplexed genome editing, disease modelling and immune-cell engineering

Main
CRISPR (for ‘clustered regularly interspaced short palindromic repeats’) offers multiple capabilities in endogenous gene editing1. CRISPR technology uses programmable RNA to direct endonuclease activity, which provides remarkable precision and simplicity to target any DNA or RNA sequences2,3,4,5. The generation of Cas9 knock-in mice have enabled in vivo cancer modelling and pooled genetic screening in primary immune cells, which has led to numerous discoveries of key tumour-growth drivers and immune regulators6,7. Although Cas9 has been widely used since the inception of the CRISPR editing era, the emergence of Cas12a presents distinct advantages, particularly in multiplexed gene editing8,9. Apart from its DNase activity, Cas12a possesses RNase activity that allows for the generation of mature CRISPR RNAs (crRNAs) from an array of concatenated crRNAs by cleaving RNAs at the direct repeat (DR) consensus sequences8,9. This capability of multiplexed gene perturbation renders it an ideal candidate for elucidating intricate gene interactions, such as epistasis, redundancy, synergy and antagonism10.
However, the large size of the Cas12a (1,200–1,500 amino acids long) family of proteins poses a substantial obstacle in terms of the delivery and stable expression of the CRISPR–Cas12a system by viral vectors, especially in primary cells6,11,12. Thus, we reasoned that developing Cas12a-knock-in mice would streamline the process of primary-cell genome engineering and Cas12a-based CRISPR screening.
The Lachnospiraceae bacterium (Lb) variant of Cas12a (LbCas12a) can perturb multiple genes simultaneously or sequentially in cancer cell lines13,14. The LbCas12a enzyme along with adeno-associated virus (AAV) vectors is utilized for efficiently knocking in chimeric antigen receptors into the genomic loci of human primary T cells while simultaneously knocking out putative checkpoint inhibitors15. An engineered version of AsCas12a, enAsCas12a (with substitutions E174R/S542R/K548R), and its high-fidelity version, enAsCas12a-HF1 (with substitutions E174R/N282A/S542R/K548R), were demonstrated to have expanded PAM sequence and enhanced multiplexed gene editing efficiency16. Therefore, developing mouse lines with stable Cas12a knock-in holds promising potential for efficient in vivo and ex vivo multiplexed genome engineering, particularly in primary mouse cells.
Here we describe the generation of both Cre-dependent conditional and constitutive Rosa26 locus knock-in mice, with both LbCas12a and enAsCas12a-HF1 transgenes, respectively. While Cas12a protein expression was efficiently detected in different major organs, those mice with Cas12a KI and constitutive expression of Cas12a proteins do not show observable toxicities. With LbCas12a mice, we demonstrated gene editing across multiple primary immune cell types, including primary CD4+ and CD8+ T cells, B cells and bone-marrow-derived dendritic cells (BMDCs), showing both DNA-level gene editing and protein-level reduction. With enAsCas12a-HF1 mice (denoted as enAsCas12a mice below), besides ex vivo multiplexed gene perturbation in primary immune cells, we also demonstrated gene editing with multiple delivery vehicles, including lipid nanoparticle (LNP)-RNA, AAV and retroviral vectors. By delivering crRNAs using LNP into the constitutive enAsCas12a mice, we achieved functional knockout of the transthyretin (TTR) protein, a misfolded form of which leads to life-threatening transthyretin amyloidosis17. We demonstrated efficient quadruplex gene knockout in vivo using a single AAV vector simultaneously targeting murine Trp53, Apc, Pten and Rb1, resulting in rapid induction of salivary gland squamous cell carcinoma (SCC) and lung adenocarcinoma (LUAD). Finally, we demonstrated the modularity of LSL-enAsCas12a mice by integrating with a CRISPR activation (CRISPRa) transgenic mouse line (dCas9-SPH)18 to establish a simultaneous dual-gene activation and knockout (DAKO) system.
Results
Generation of conditional and constitutive Cas12a-knock-in mice
LbCas12a and AsCas12a have been the most widely applied species among the Cas12a family. Thus, we developed both LbCas12a and enAsCas12a knock-in (KI) mice with the goal of improving the efficiency and simplicity of multiplexed gene editing in primary cells. For both the LbCas12a and enAsCas12a strains, we first cloned the codon-optimized transgene into the Ai9 Rosa26-targeting construct19 to direct recombination between exon 1 and exon 2 of the Rosa26 locus (Fig. 1a). Cas12a expression is driven by a CAG promoter but interrupted by a downstream LoxP-3xPolyA-Stop-LoxP (LSL) cassette, which allows tissue-specific genome engineering20 (Fig. 1a). It was postulated that the suboptimal gene editing efficiency of Cas12a, compared with Cas9, was in part due to the presence of two nuclear export sequences in its conserved RuvC-II domain21. Multiple studies showed that increasing the number of SV40 nuclear localization signals (NLSs) on Cas12a augments its endonuclease activity in both zebra fish and mammalian cells21,22. A combination of different types of NLS was shown to outperform that with the same type of NLS while minimizing the off-target potential23. Furthermore, the position of these NLSs on the protein had a drastic impact on nuclear localization24. Taking these factors into consideration, we placed the SV40 NLS on the N-terminus and the nucleoplasmin NLS on the C-terminus of the LbCas12a, while for enAsCas12a mice, we put the Egl-13 NLS instead on the N-terminus and an extra c-Myc NLS signal on the C-terminus of enAsCas12a-HF1 to attain better editing efficiency from Cas12a getting closer proximity to genomic DNA. Affinity tag 3xHA was fused to the C-terminus of LbCas12a, and Myc tag was fused to the C-terminus of enAsCas12a-HF1. Those tags are immediately followed by a 2A self-cleavage peptide and subsequent fluorescent marker, enhanced GFP (eGFP). The affinity tag and eGFP allow detection of LbCas12a and enAsCas12a by standard molecular and cellular approaches such as western blot and fluorescence microscopy (Fig. 1a). The genotype and its heterozygosity of the mice were verified by polymerase chain reaction (PCR) using two pairs of primers (Supplementary Fig. 1a,b).

a, Schematic of the LSL-LbCas12a and LSL-enAsCas12a-HF1 Rosa26-targeting constructs for the two conditional transgenic lines. The backbone is Ai9 Rosa26-targeting vector. LbCas12a, labelled with HA tag and eGFP, is expressed under a CAG promoter. LoxP-(Stop)3XPolyA-LoxP (LSL) allows Cre-dependent conditional expression of LbCas12a protein. LSL-enAsCas12a mice follow the similar design, but are labeled with Myc Tag and use Egl-13 NLS instead of SV40 NLS on the N-terminus. Partial element created in BioRender. Chen, S. (2025) https://BioRender.com/y08x327. b, Generation of the constitutively active LbCas12a and enAsCas12a transgenic mouse line by crossing the corresponding conditional mouse line with the CMV-Cre mouse line. The LSL cassette was excised by Cre, leading to constitutive expression of LbCas12a or enAsCas12a protein. Partial element created in BioRender. Chen, S. (2025) https://BioRender.com/b54g776. c, Widefield fluorescence microscopy illustrating the expression of enAsCas12a-HF1-eGFP protein only in constitutive enAsCas12a mouse, but not in conditional LSL-enAsCas12a mouse or parental C57BL/6 mouse. d, Western blot showing the expression of enAsCas12a-HF1-MycTag protein in enAsCas12a mouse. enAsCas12a-HF1-MycTag protein was not detected in the protein lysate from LSL-enAsCas12a-HF1 and C57BL/6 mouse. Anti-MycTag antibody was used to detect enAsCas12a-HF1 protein and GAPDH was used as the internal control. e, IVIS spectrum imaging of GFP radiance from major organs in LSL-enAsCas12a mice, enAsCas12a-heterozygote mice and enAsCas12a-homozygote mice. Major organs include liver, spleen, kidney, heart, lung and brain. f, Quantification of IVIS GFP radiance. Two-way analysis of variance (ANOVA) with Dunnett’s multiple comparisons test was used to assess significance. For all groups, N = 3 biological replicates. The dash line represents the average background expression from the LSL-enAsCas12a control mice (2.64 × 10⁹). g, Left: white blood cell (WBC) count for constitutive enAsCas12a mice, LbCas12a mice and C57BL/6 control mice. Middle left: red blood cell (RBC) count for constitutive enAsCas12a mice, LbCas12a mice and C57BL/6 control mice. Middle right and right: comparison of lymphocytes/monocytes differential between constitutive enAsCas12a mice, LbCas12a mice and C57BL/6 control mice. One-way ANOVA with Tukey’s multiple comparisons test was used to assess significance. For bar plot, data are shown as mean ± s.e.m. For C57BL/6, N = 7 biological replicates. For enAsCas12a, N = 6 biological replicates. For LbCas12a, N = 6 biological replicates. Exact P values are labelled. h, Quantification of splenic immune cell percentage by flow cytometry. Two-way ANOVA with Tukey’s multiple comparisons test was used to assess significance. All bar plots shown as mean ± s.e.m. Exact P values are labelled.
Source data
To generate constitutively active LbCas12a and enAsCas12a mouse lines, both LSL-LbCas12a and LSL-enAsCas12a mice were crossed with CMV-Cre mice (Methods and Fig. 1b). We were able to detect the GFP expression from primary ear fibroblasts isolated from the enAsCas12a mice (Fig. 1c). LbCas12a and enAsCas12a proteins were also detected by western blot on the protein lysate from the primary fibroblast (Fig. 1d and Supplementary Fig. 1c). No enAsCas12a was detected in LSL-enAsCas12a mice, suggesting a tight expression control by the LSL allele (Fig. 1d). In addition, we characterized the expression level of Cas12a proteins across different organs by quantifying the GFP signal using the IVIS spectrum (Fig. 1e,f and Supplementary Fig. 1d,e). We noted that the expression level varies across different organs, with the highest GFP signal detected in the brain for both enAsCas12a and LbCas12a mice. Western blot results aligned well with the IVIS imaging, showing a higher expression level in the brain, liver and lung compared with the spleen, kidney and heart (Supplementary Fig. 1f,g). Anti-eGFP antibodies detected signals in both 25 kDa and 130–250 kDa ranges, which correspond to the size of free eGFP and enAsCas12a-eGFP fusion protein (Supplementary Fig. 1h). This explained the two bands that we observed in detecting enAsCas12a with anti-MycTag antibodies (Fig. 1d).
In contrast to Cas9, Cas12a family proteins were reported to have a unique ‘trans-cleavage’ activity, by which Cas12a indiscriminately degrades single-stranded DNA upon activation by RNA-guided DNA binding25. Thus, it is critical to characterize the impact of constitutive and prolonged Cas12a expression on the physiological traits or pathological effects of the knock-in mice. Complete blood count (CBC) analysis demonstrated negligible differences in representative values such as white blood cell count and lymphocytes/monocytes differential, with slightly lower red blood cell count in enAsCas12a mice in this cohort (Fig. 1g). The constitutive enAsCas12a and LbCas12a mice did not show any noticeable difference from wild-type (WT) mice in terms of fertility and morphology, and were able to breed to and maintain homozygosity.
To facilitate the future application of the knock-in mice, we further characterized the knock-in mouse strains. The GFP signal level of splenocytes corresponded well with the copy number of enAsCas12a transgene (Supplementary Fig. 1i,j), while LSL-enAsCas12a, enAsCas12a-heterozygote and homozygote mice did not show any differences in lymphocytes composition, including CD3+ T cells, CD4+ T cells, CD8+ T cells and CD19+ B cells differentials (Fig. 1h). No difference in lymphocytes composition was observed between LbCas12a and LSL-LbCas12a mice as well (Supplementary Fig. 1k). While the lymphocytes from LSL-enAsCas12a mice showed no detectable enAsCas12a-GFP expression above background in flow cytometry, we observed a comparable enAsCas12a-GFP expression level among four different sub-types of lymphocytes (CD3+ T cells, CD4+ T cells, CD8+ T cells and CD19+ B cells) in the constitutive enAsCas12a mice (Supplementary Fig. 1l). Although whole-genome sequencing (WGS) did show INDEL variants across genome, no structural variant was called with confidence in LbCas12a and enAsCas12a mice (Supplementary Fig. 1m). The similarity in distribution of INDEL variants between LbCas12a and enAsCas12a mice suggested that they were likely originated from crossing with the CMV-Cre mice (Supplementary Fig. 1m). Groups of LbCas12a mice and enAsCas12a mice, with a batch of background strain C57BL/6J mice, were submitted for comprehensive phenotypic analysis (necropsy, CBC and detailed microscopic exam of all tissues). LbCas12a and enAsCas12a mice were evaluated blindly for gross and microscopic pathologic changes compared with C57BL/6J mice. No substantial gross, CBC (Fig. 1g and Supplementary Datasets) or microscopic findings were identified for constitutive LbCas12a and enAsCas12a mice by review of haematoxylin and eosin (H&E)-stained sections of tissues, comparing with the background strain C57BL/6J mice (Supplementary Fig. 2a).
Overall, these data demonstrated the successful generation of two conditional LSL-Cas12a lines and two constitutive Cas12a mouse lines, and the prolonged and constitutive expression of either LbCas12a or enAsCas12a protein did not cause detectable toxicity.
LbCas12a mice enabled multiplexed gene knockout in primary immune cells
Current Cas12a-crRNA design algorithms are based on either minimizing off-target scores (RGEN)26 or designed specifically for the AsCas12a (CRISPick)10,27, with no dedicated algorithms for LbCas12a. Thus, we generated a stable LbCas12a-expressing KPD cell line (a non-small cell lung cancer cell line with mutations in Kras, p53 and Dicer1 as previously described13,14) to functionally test guides designed by different algorithms (Supplementary Fig. 3a). Notably, we found that the Broad CRISPick algorithm, although developed for AsCas12a, improved LbCas12a crRNA functionality. By filtering CRISPick-designed crRNAs with 40% or greater in their ‘Target cut%’ parameter, the average cutting efficiency for crRNAs increased 2.49-fold, which resulted in 35 out of 48 crRNAs (72.9%) demonstrating successful gene editing (Supplementary Fig. 3b,c). The average cutting efficiency for crRNAs after filtering is 21.3%, while that of crRNAs before filtering is only 8.6% (P = 0.0002, s.d. of ‘no selection’ = 5.17, s.d. of ‘best cutters’ = 16.64) (Supplementary Fig. 3c). These data demonstrated that the CRISPick AsCas12a algorithm, when filtering by the ‘Target cut%’ score, can be a good predictor for in vitro LbCas12a gene editing efficiency.
To demonstrate the capability of LbCas12a mice for efficient genome engineering, we tested gene editing in various primary immune cells (BMDCs, CD4+ T cells, CD8+ T cells and B cells) from constitutive LbCas12a mice. To facilitate efficient gene editing in immune cells, we developed a retroviral guide delivery system, with mScarlet fluorescent protein as the transgene reporter (Supplementary Fig. 3d). We verified transduction efficiency by mScarlet expression and gene knockout efficiency 5 days post transduction. With this system, we achieved efficient single-gene knockout in BMDCs, CD8+ T, CD4+ T and B cells as demonstrated by the protein-level knockout using flow cytometry (Fig. 2a). We noted that editing efficiency varies between different crRNAs targeting the same gene (Fig. 2b–d and Supplementary Fig. 3e–i). DNA-level gene editing was confirmed using the T7EI surveyor assay and next-generation sequencing (NGS). Both T7EI surveyor and NGS data aligned well with the flow cytometry analysis (Supplementary Figs. 4a–d and 5a–m). Allele frequency plots demonstrated that deletion was more prominent than insertion and roughly centred at the predicted cutting site of LbCas12a (Supplementary Figs. 4e–h and 5a–m). These data showed successful gene editing of surface markers in various primary immune cells from LbCas12a mice.
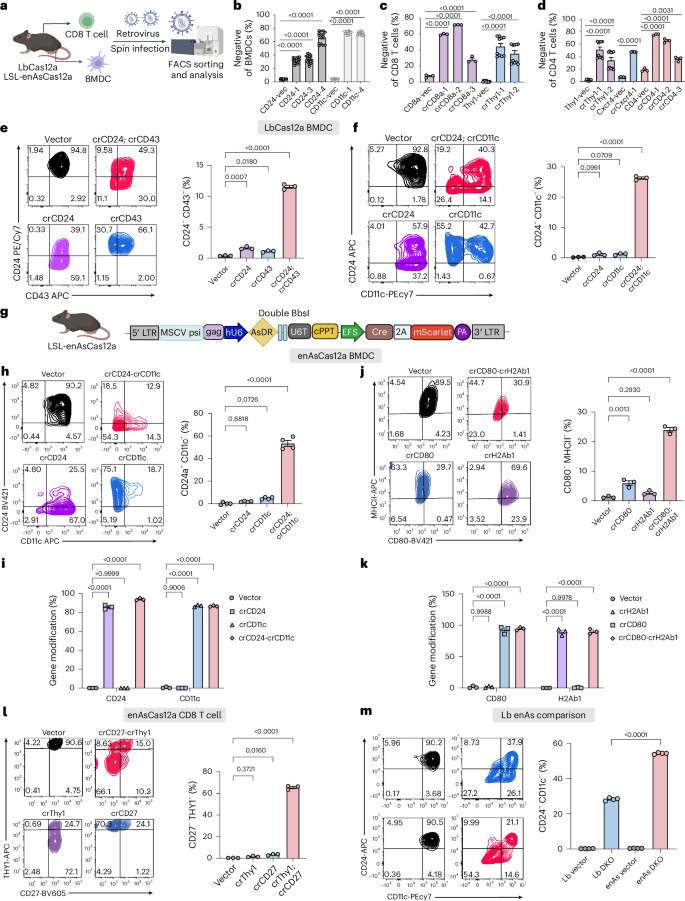
a, Schematic showing the ex vivo workflow for multiplexed gene editing in primary immune cells (of both LbCas12a mice and LSL-enAsCas12a mice). CD8+ T cells and BMDCs were isolated from the spleen and bone marrow of LbCas12a or LSL-enAsCas12a mice, followed by ex vivo culture and retroviral infection. FACS was used to analyse the efficiency of single-cell-level DKO and sort for infected cells for downstream molecular analysis. Created in BioRender. Chen, S. (2025) https://BioRender.com/d80g206. b, Quantification of CD24 or CD11c negative BMDCs percentage for the guides compared with the vector control. Unpaired two-sided t-test was used to assess significance. N = 15 technical replicates for all groups. c, Quantification showing the percentage of CD8a or Thy1 negative CD8+ T cells for the guides compared with the vector control. Unpaired two-sided t-test was used to assess significance. N = 3 technical replicates for CD8 groups, and N = 10 technical replicates for Thy1 groups. d, Quantification showing the percentage of Thy1, Cxcr4 and CD4 negative CD4+ T cells for the guides compared with the vector control. Unpaired two-sided t-test was used to assess significance. Technical replicates for all groups. N = 10 for Thy1 groups. N = 5 for Cxcr4 groups. N = 3 for CD4 groups. e, Flow cytometry analysis on the CD24-CD43 DKO experiment in LbCas12a BMDCs. Left: representative FACS plot demonstrating CD24 and CD43 expression in BMDCs. Right: quantification of CD24 and CD43 DKO efficiency in different groups. One-way ANOVA with Dunnett’s multiple comparisons test was used to assess significance. N = 3 biological replicates for all groups. f, Flow cytometry analysis on the CD24-CD11c DKO experiment in LbCas12a BMDCs. Left: representative FACS plot demonstrating CD24 and CD11c expression in BMDCs. Right: quantification of CD24 and CD11c DKO efficiency in different groups. One-way ANOVA with Dunnett’s multiple comparisons test was used to assess significance. N = 3 biological replicates for all groups. g, Schematic showing the retroviral vector design for LSL-enAsCas12a immune cell editing. crRNA array was expressed by human U6 promoter (hU6). Cre and mScarlet expression was driven by EFS promoter to induce enAsCas12a-HF1 expression and to label the infected cells, respectively. CD8+ T cells and BMDCs were isolated from the spleen and bone marrow of LSL-enAsCas12a mice, as shown in a. Partial element created in BioRender. Chen, S. (2025) https://BioRender.com/b54g776. h, Flow cytometry analysis on the CD24-CD11c DKO experiment in LSL-enAsCas12a BMDCs. Left: representative FACS plots demonstrating CD24 and CD11c expression in BMDCs. Right: quantification of CD24 and CD11c DKO efficiency in different groups. One-way ANOVA with Dunnett’s multiple comparisons test was used to assess significance. N = 4 biological replicates for all groups. i, Targeted sequencing quantifies percent gene modification for the CD24-CD11c DKO experiment in BMDCs. Two-way ANOVA with Dunnett’s multiple comparisons test was used to assess significance. For all groups, N = 3 biological replicates. j, Flow cytometry analysis on the CD80-H2Ab1 DKO experiment in LSL-enAsCas12a BMDCs. Left: representative FACS plots demonstrating CD80 and MHC II expression in BMDCs. Right: quantification of CD80 and MHC II DKO efficiency in different groups. One-way ANOVA with Dunnett’s multiple comparisons test was used to assess significance. N = 3 biological replicates for all groups. k, Targeted sequencing quantifies percent gene modification for the CD80-H2Ab1 DKO experiment in BMDCs. Two-way ANOVA with Dunnett’s multiple comparisons test was used to assess significance. For all groups, N = 3 biological replicates. l, Flow cytometry analysis on the Thy1-CD27 DKO experiment in LSL-enAsCas12a CD8+ T cells. Left: representative FACS plots demonstrating CD27 and Thy1 expression in CD8+ T cells. Right: quantification of CD27 and Thy1 DKO efficiency in different groups. One-way ANOVA with Dunnett’s multiple comparisons test was used to assess significance. N = 3 biological replicates for all groups. m, Flow cytometry analysis comparing DKO efficiency in BMDCs of LSL-LbCas12a and LSL-enAsCas12a mice. Left: representative FACS plots demonstrating CD24 and CD11c expression in BMDCs. Right: quantification of CD24 and CD11c DKO efficiency in different groups. One-way ANOVA with Tukey’s multiple comparisons test was used to assess significance. N = 4 technical replicates for all groups. All bar plots shown as mean ± s.e.m. Exact P values are labelled.
Source data
We then tested perturbation of multiple genes simultaneously on the single-cell level. We first tested a concatenated array targeting CD24 and CD43, which are highly expressed in BMDCs. Flow cytometry analysis showed that single crCD24 and crCD43 result in 54.08% and 12.1% of protein-level knockout, respectively (Supplementary Fig. 6a). Double crRNA array (crCD24; crCD43) knocked out CD24 and CD43 at a similar level to the single crRNA counterparts (Supplementary Fig. 6a). Importantly, 11.1% of the cells had both CD24 and CD43 knockout, which was observed uniquely in the double crRNA group (Fig. 2e). Molecular level gene editing was confirmed by NGS data, demonstrating that crRNA array (crCD24; crCD43) induced over 70% and 65% indels in CD24a and CD43 genes, respectively (Supplementary Fig. 4i,j). As quality control, indel frequency was closed to zero in the vector control group (Supplementary Fig. 4i,j). We additionally tested a second crRNA array (crCD24; crCD11c), demonstrating a higher percentage (26.4%) of single-cell-level double knockout (DKO), whereas crCD24 and crCD11c single crRNAs only knocked out the corresponding protein (Fig. 2f and Supplementary Fig. 6b). Collectively, our data show the multiplexed genetic engineering capability of our LbCas12a mice in primary immune cells.
LSL-enAsCas12a mice enabled multiplexed ex vivo genome engineering in mouse primary immune cells
Similarly, we evaluated the capability of the LSL-enAsCas12a mice for multiplexed gene engineering in primary immune cells. We tested dual-gene editing in BMDCs and CD8+ T cells using flow cytometry on highly expressed surface markers (Fig. 2a). To induce enAsCas12a expression in the LSL-enAsCas12a mice, we generated a new retroviral vector with Cre and mScarlet expression cassette (Fig. 2g). In BMDCs, we tested two sets of DKOs, CD24-CD11c and CD80-H2Ab1, each compared with their respective single knockouts (SKOs) and the vector control. The DKO pair crCD24-crCD11c induced an average of 79.2% cell-population-level protein knockout of CD24, and an average of 62.9% knockout of CD11c, comparable to the efficiency of the SKO controls (Supplementary Fig. 6c). Notably, crCD24-crCD11c generated efficient CD24 and CD11c DKO at the single-cell level, with an average of 53.5% CD24−;CD11c− (double-negative) population, whereas SKO controls, crCD24 and crCD11c, did not result in a noticeable double-negative population (Fig. 2h). Targeted sequencing showed that the DKO group (crCD24-crCD11c) induced 93.8% and 86.5% gene modification for CD24 and CD11c genes, respectively, comparable to that of SKO controls (Fig. 2i).
Meanwhile, the DKO group crCD80-crH2Ab1 induced 72.2% knockout of CD80 and 25.8% knockout of major histocompatibility complex II (MHCII), which was comparable to the efficiency of the SKO controls (Supplementary Fig. 6d). An average of 24% of the cells was CD80−; MHCII− (double negative) in the crCD80-crH2Ab1 group, again suggesting single-cell-level DKO (Fig. 2j). Notably, 94.5% and 90.1% gene modification in Cd80 and H2Ab1 were induced by the DKO group crCD80-crH2Ab1, based on targeted amplicon sequencing data (Fig. 2k). The gene editing efficiency was comparable to that of SKO controls (Fig. 2k). The discrepancy of gene editing efficiency quantified by flow cytometry and targeted sequencing, especially for H2Ab1 (25.8% compared with 90.1%), could be due to the existence of heterozygous cells (only one out of the two allele edited), the delay in membrane protein degradation and/or the variable expression level within the BMDC population. Again, the allele frequency plots showed that deletion was the dominant form of gene modification (Supplementary Fig. 6e,f).
Efficient gene editing was also achieved in CD8+ T cells. SKO controls, crThy1 and crCD27, resulted in averages of 64.2% and 72.3% cell-population-level protein knockout of THY1 and CD27, respectively (Supplementary Fig. 6g). The DKO construct, crThy1-crCD27, induced similar levels of protein knockout of both proteins compared with the SKO controls (Supplementary Fig. 6g). Only the DKO construct resulted in an average of 65.6% THY1−;CD27− (double-negative) population (Fig. 2l).
We also conducted a side-by-side comparison of the multiplexed gene editing capability between LSL-LbCas12a and LSL-enAsCas12 mice. To make direct comparisons, we used the same crRNAs targeting Cd24 and Cd11c that are compatible with both Cas12a (with a TTTV PAM sequence). We noted higher single-cell-level DKO in BMDCs isolated from the LSL-enAsCas12 mice than those isolated from the LSL-LbCas12a mice, as evident by the substantially increased double-negative populations by flow cytometry. Thus, we mainly focused on LSL-enAsCas12a mice for the following applications and characterizations.
Utilizing LSL-enAsCas12a mice for efficient in vivo gene editing
Non-viral vectors, such as LNP, are widely used in the delivery of CRISPR systems for in vivo genome editing and gene therapy6,28,29. LNP was able to efficiently deliver small RNA such as Cas9-tracrRNA in vitro to the mouse embryonic fibroblast cell line NIH/3T3 (Supplementary Fig. 7a). To demonstrate this delivery method in constitutive enAsCas12a mice and to test this in a disease-related model, we gave LNP-crRNA through intravenous (i.v.) injection (Fig. 3a) to target the murine Ttr gene, whose human homologue is a known therapeutic target of transthyretin amyloidosis30. We parallelly encapsulated two independent guides (Ttr-cr1 and Ttr-cr2) targeting the Ttr gene, together with a non-targeting control NTC1, followed by in vitro testing in the NIH/3T3 cell line (Fig. 3a and Supplementary Fig. 7b). Both Ttr-cr1 and Ttr-cr2 induced rapid and substantial serum TTR protein reduction starting from day 6 post injection (Fig. 3b). Notably, the decrease in serum TTR levels remained stable during the 20 days’ monitoring period (Fig. 3b). We observed near 100% knockout of the serum TTR level by Ttr-cr1 relative to NTC1. Ttr-cr2 also induced near 50% knockout of serum TTR (Fig. 3b). These results demonstrated the highly efficient in vivo, therapeutically relevant gene targeting capability of the enAsCas12a-HF1 mice, when coupled with the LNP-crRNA delivery system, which provides broad applicability for direct in vivo targeting and delivery studies in disease models.
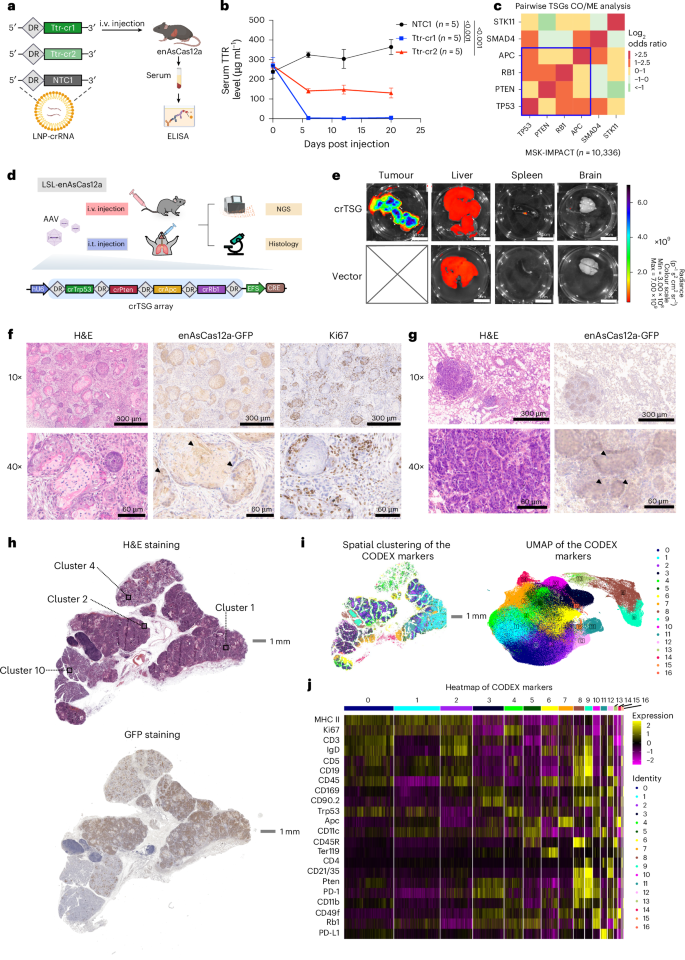
a, Schematic showing the packaging and delivery of crRNA using LNP to knockout Ttr gene in the liver. Non-targeting control crRNA 1 (NTC1) were packaged as control in the same batch. Constitutive enAsCas12a-HF1 mice were intravenously injected with LNP-crRNA. Serum samples were collected for ELISA to measure and monitor the TTR protein level in serum. Created in BioRender. Chen, S. (2025) https://BioRender.com/j37t723. b, Serum TTR level (µg ml−1) from samples collected at day 0 (before injection), day 6, day 12 and day 20 post injection, via retro-orbital blood draw. The serum TTR level was measured by ELISA. Two independent guides (TTRcr1 and TTRcr2) targeting murine Ttr gene were compared with non-targeting control crRNA (NTC1). Two-way ANOVA with Dunnett’s multiple comparisons test was used to assess significance. Data are shown as mean ± s.e.m. P values are labelled. For all groups, N = 5 biological replicates. c, Pairwise co-occurrence (CO) and mutual exclusivity (ME) analysis for TSGs: TP53, APC, PTEN, RB1, SMAD4 and STK11 on human cancer data from MSK-IMPACT project. Positive log2(odds ratio) indicated CO, while negative log2(odds ratio) indicated ME40,41. We identified TP53, APC, PTEN and RB1 as a group of co-occur genes out of the six TSGs (surrounded by blue lines). SMAD4 was excluded owing to ME with PTEN, RB1 and STK11. STK11 was excluded because it was mutually exclusive with PTEN and SMAD4. d, Schematic showing the core segment of the AAV construct used for tumour induction, which contained a crRNA expression array (crTSG) that included four guides targeting Trp53, Pten, Apc and Rb1, and a Cre expression cassette for inducing enAsCas12a-HF1 expression. After production and purification, AAV-crTSG and AAV-vector (as the negative control) were either intravenously or intratracheally injected into LSL-enAsCas12a-HF1 mice. Tumour and major organs were isolated for NGS and histology analysis. Partial element created in BioRender. Chen, S. (2025) https://BioRender.com/l72d475. e, Representative IVIS spectrum images detecting GFP signal indicated by total radiance (p s−1 cm−2 sr−1) for tumour and major organs. Top row being representative AAV-crTSG intravenously injected mouse and the bottom row being representative AAV-vector intravenously injected mouse. f, Representative H&E staining and IHC staining on AAV-induced salivary gland SCC FFPE samples. For IHC, tumour samples were stained with GFP (enAsCas12a-HF1-eGFP) and Ki67 (proliferation marker). Black triangles point out the representative GFP+ cancerous cell. For 10× images, scale bars = 300 µm. For 40× images, scale bars = 60 µm. g, Representative H&E staining and IHC staining on AAV-induced lung adenocarcinoma FFPE samples. For IHC, tumour samples were stained with GFP (enAsCas12a-HF1-eGFP). Black triangles point out the representative GFP+ cancerous cell. For 10× images, scale bars = 300 µm. For 40× images, scale bars = 60 µm. h, Histology section used for CODEX. Top: global view H&E staining on the AAV-induced salivary gland SCC FFPE sample. Clusters 1, 2, 4 and 10 from unsupervised clustering in the UMAP plot in i were labelled with black box. Scale bar, 1 mm. Bottom: global view GFP staining on the same SCC FFPE sample. Scale bar, 1 mm. i, CODEX results reveal the heterogeneity in the tumour samples. Right: UMAP dimensional reduction plot showing the unsupervised clustering of different cell types in the SCC FFPE sample. Left: spatial display of the 17 cell types overlaying the H&E image. Scale bar, 1 mm. j, Heatmap showing the differential expression of the 22 CODEX markers in the 17 cell-type clusters. The expression level was shown as Z score.
Source data
LSL-enAsCas12a mice enabled multiplexed in vivo gene editing for autochthonous cancer modelling
Genetically engineered mouse models allow autochthonous cancer modelling—inducing tumours from normal cells de novo within the intact organism. Compared with xenograft or syngeneic models that rely on cell line transplantation, autochthonous models bear a more bona fide resemblance of the human oncogenesis process and tumour microenvironment, which are critical for the study of cancer biology, immune surveillance and therapeutic response31. The conventional method of creating genetically engineered mouse models, which has conditional knockout alleles for each of the tumour suppressors, is a tedious process32,33. The use of CRISPR-mediated genome engineering, especially the generation of Cas9 knock-in mice and associated viral delivery methods, substantially simplified the autochthonous cancer modelling process and could be scaled up to systematically screen for drivers of tumour oncogenesis and progression in different cancer types6,34,35,36,37,38. However, two bottlenecks severely restrict the effectiveness of Cas9 systems for tumour modelling—(1) lack of multiplexed gene editing capability for Cas9 and (2) packaging size constraint of the AAV vector. These limitations effectively hinder Cas9 systems from perturbing scaling numbers of genes encoding cancer drivers or regulators. However, Cas12a has been shown to have high multiplexing capability in gene editing using a crRNA array encoding multiple crRNAs targeting multiple genes in a single vector39. We reasoned that LSL-enAsCas12a mice would serve as an efficient tool for more adaptable and precise autochthonous cancer modelling.
To experimentally test this, we selected six frequently mutated tumour suppressor genes (TSGs), TP53, APC, PTEN, RB1, SMAD4 and STK11 from the pan-cancer database MSK-IMPACT project40,41 (Supplementary Fig. 7c). After pairwise co-occurrence (CO) and mutual exclusivity (ME) analysis, we picked TP53, APC, PTEN and RB1, all of which co-occurred pair-wisely across multiple types of human cancer (collectively in a pan-cancer manner)40,41 (Fig. 3c). To target mouse Trp53, Pten, Apc and Rb1 simultaneously using a single AAV vector (with AAV9 serotype), we cloned a concatenated RNA array (crTSG) containing four crRNAs (crTrp53, crPten, crApc and crRb1), separated by enAsCas12a DRs, driven by a single U6 promoter (Fig. 3d). A Cre recombinase is expressed under a constitutive promoter EFS to activate enAsCas12a-HF1-eGFP expression (Fig. 3d). When intravenously injected with this AAV-crTSG-Cre, 100% (6/6) mice developed aggressive palpable head and neck cancer within a month of the single dose, whereas none (0/6) of the AAV vector (which also expresses Cre) injected mice showed any noticeable carcinogenesis (Fig. 3e). Because the 2A-eGFP is co-cistronically encoded with the enAsCas12a-HF1 transgene, AAV-infected cells in the LSL-enAsCas12a-HF1-2A-eGFP mice would emit green fluorescence as Cre recombinase cleaves out the LSL cassette. Considerably stronger GFP signals were indeed detected in head and neck tumour samples compared with those in other organs, owing to the rapid growth of cancer cells (Fig. 3e and Supplementary Fig. 7d). Other than the tumour, liver as expected has a relatively higher GFP signal compared with other organs examined (spleen and brain) (Supplementary Fig. 7d).
To examine the AAV-crTSG-Cre-induced head and neck cancer model in these mice, we performed endpoint histology analysis, which revealed characteristic SCC features (abundant eosinophilic cytoplasm and variable keratinization)42. Diagnostic analysis of the SCC and its adjacent tissues conducted by a professional pathologist (C.L.) suggested that it originated from salivary glands (Fig. 3f). Consistent with the GFP signals detected by the IVIS spectrum, the tumour sections showed enAsCas12a-HF1-GFP expression in immunohistochemistry (IHC) analysis, suggesting that the tumour was induced by the AAV-crTSG-Cre-mediated gene editing (Fig. 3f). We observed that most of the SCC tumour cells were Ki-67 positive, indicating a highly proliferative and aggressive nature of the cancer cells in this model (Fig. 3f). We also observed immune cell infiltration (marker CD45LCA), with higher infiltration by myeloid lineage immune cells (marker CD11b), such as neutrophiles (marker Ly6b) and macrophages (marker F4/80), than by T cells (marker CD3) (Supplementary Fig. 7e). Intratracheal (i.t.) injection of the same AAV into the lung induced multifocal adenocarcinoma in the lung, which also showed enAsCas12a-HF1-GFP expression as detected by IHC (Fig. 3g).
We further characterized the SCC with a high-dimensional spatial analysis called CODEX, which enables multiplexed proteomics at a single-cell resolution43 (Fig. 3h–j). On the basis of the expression level of 22 markers, including the 4 TSGs, pan-immune cell marker (CD45), adaptive immunity (for example, CD3, CD4, CD19 and IgD), innate immunity (for example, CD11b and CD11c), antigen presentation (for example, MHC-II), immune checkpoints (for example, PD1 and PDL1) and proliferation (Ki67), SCC cells were deconvoluted into 17 clusters (Fig. 3i,j). We found that Cluster 1, Cluster 2 and Cluster 4 regions (labelled by black boxes) were particularly interesting as cells within these clusters seemed morphologically different, and they all expressed GFP, indicating successful crRNA array delivery (Fig. 3h). Consistent with this, we found that these three tumour regions were highly heterogeneous based on spatial clustering and differential expression of the CODEX markers (Fig. 3i,j). We additionally included Cluster 10 region, which has low GFP expression, as a representation of the normal tumour-adjacent salivary gland tissue for further analysis (Fig. 3h). Examining these four regions under higher magnification revealed differential expression of the four TSGs (Supplementary Fig. 7f). Trp53 expression was difficult to detect in all four regions. RB1, PTEN and APC signals were the brightest in tumour-adjacent normal tissue (Cluster 10), whereas their signals were low or undetectable in the Cluster 2 tumour sample. Cluster 4 only showed signal for RB1 and PTEN, but not for APC. Notably, Cluster 1 had expression detected for RB1, PTEN, APC and trace amount of P53. Characterization of these tumour samples by CODEX illustrated the high heterogeneity nature of the autochthonous tumour model, which is more physiologically relevant to human tumours compared with xenograft tumours established by cancer cell lines. Together, these results showcased the robustness of using LSL-enAsCas12a mice for in vivo multiplexed genome engineering, which empowered autochthonous cancer modelling.
Genomic analysis for the tumour and immune cell DKO samples
After demonstrating phenotypic data, we sought to characterize the efficiency of LSL-enAsCas12a mice by quantifying both on-target and off-target rate at the genomic level. NGS of the bulk SCC samples showed substantial levels of gene modification for the 4 targeted TSGs (Trp53, Apc, Pten and Rb1) (on average approximately 50%, varying between genes) and most of the modifications were deletions, centred around the predicted enAsCas12a crRNA cutting sites for these genes (Fig. 4a,b). To quantify the multiplexed editing of the four TSGs at the single-cell level, we picked ten tumour single clones isolated from the established tumour cultures for each of SCC and LUAD, and PCR amplified the targeted regions, followed by Sanger sequencing. Notably, ten out of ten single clones had all four genes modified for both cancer types (Fig. 4c,d).
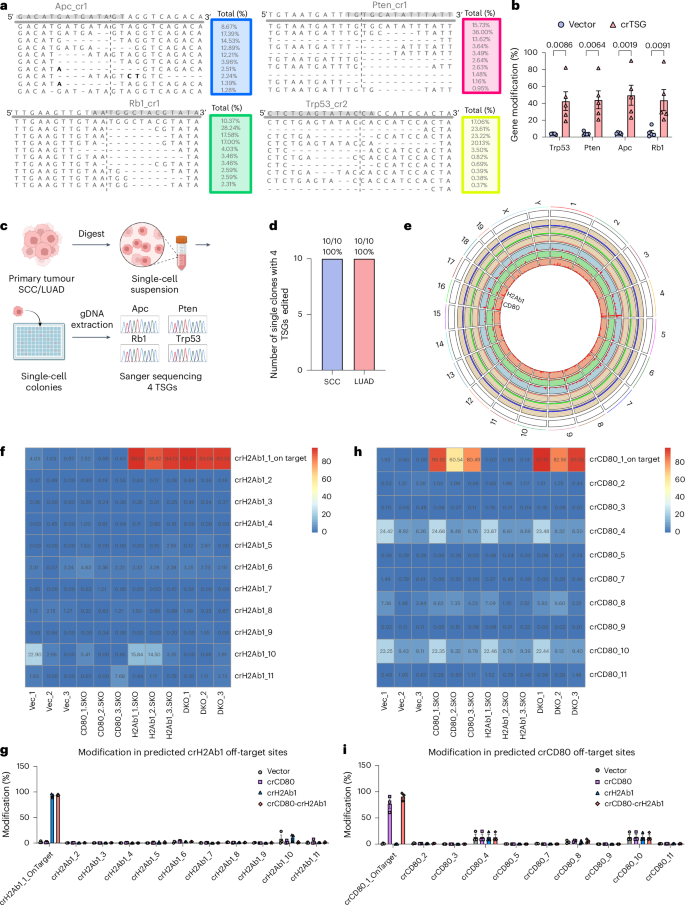
a, Representative allele frequency plots of the crRNAs-targeted sites for Trp53, Apc, Pten and Rb1 demonstrating the type of gene modification generated in SCC samples. b, Nextera sequencing quantifies percent gene modification for the four targeted genes, Trp53, Apc, Pten and Rb1, in SCC samples. Two-way ANOVA with Šídák’s multiple comparisons test was used to assess significance. Data are shown as mean ± s.e.m. P values are labelled. For all genes, N = 5 biological replicates. c, Schematic demonstrating the process of isolating single clone from primary tumour SCC/LUAD samples and surveying the efficiency of single-cell-level quadruple knockout of the four TSGs. Created in BioRender. Zhou, L. (2025) https://BioRender.com/n05e955. d, Quantification of the number of single clones with simultaneous four TSGs edited. e, Circos plot created with RCircos67 with variant information regarding crCD80 (blue), crH2Ab (green) and CD80-H2Ab1-DKO (red) genome. The outer section composed of three scatter plots (one per group) with wheat colour background, representing the average coverage at each 1 Mb window (blue dot, crCD80; green dot, crH2Ab1; red dot, CD80-H2Ab1-DKO). The inner section is composed of three histogram plots (one per group), representing the variants count by windows of 1 Mb (blue track, crCD80; green track, crH2Ab1; red track, CD80-H2Ab1-DKO). f, Heatmap of percent modification of each predicted off-target site for H2Ab1 crRNA. X-axis is composed of vector, crCD80, crH2Ab1 and CD80-H2Ab1-DKO, each with three biological replicates. Y-axis is composed of the surveyed genomic regions, including one on-target site and ten predicted off-target sites for crH2Ab1. g, Bar plot summarizing the percent modification in predicted off-target sites of H2Ab1 crRNA for vector, crCD80, crH2Ab1 and CD80-H2Ab1-DKO. Data are shown as mean ± s.e.m. N = 3 biological replicates for all groups. h, Heatmap of percent modification of each predicted off-target site for CD80 crRNA. X-axis is composed of vector, crCD80, crH2Ab1 and CD80-H2Ab1-DKO, each with three biological replicates. Y-axis is composed of the surveyed genomic regions, including one on-target site and nine predicted off-target sites for crCD80 (crCD80_6 not included owing to primer synthesis failure). i, Bar plot summarizing the percent modification in predicted off-target sites of CD80 crRNA for vector, crCD80, crH2Ab1 and CD80-H2Ab1-DKO. Data are shown as mean ± s.e.m. N = 3 biological replicates for all groups.
Source data
We characterized the off-target rate of LSL-enAsCas12a mice in the CD80-H2Ab1 DKO experiment by WGS and targeted amplicon sequencing. For WGS, we filtered the DKO and SKO unique variants with reference to vector control. After filtering, we identified 528 unique INDEL variants for DKO, whereas 412 and 461 unique INDEL variants were found for crCD80 and crH2Ab1 SKO (Supplementary Datasets). We observed multiple variant hotspots in chromosomes 1, 4, 9, 16 and 17 (Fig. 4e). We did identify variants around genomic location of on-target sites by crCD80 (chromosome 16) and crH2Ab1 (chromosome 17). We did not detect drastically different off-target profiles between SKO (crCD80, blue track; crH2Ab1, green track) and DKO (salmon track). The WGS data provide information of unbiased off-target in both single and double perturbation with immune cells from enAsCas12a mice (Fig. 4e).
Although WGS is capable of surveying the entire genome for potential off-target sites, one limitation of WGS is that there is only around 30× sequencing depth on average for each position in the genome. Therefore, we used targeted amplicon sequencing that has much higher read depth as an alternative approach to quantify the off-target rate. We used computational algorithm Cas-OFFinder44 to predict 10 potential off-target sites and designed primers to amplify 150 base pair (bp) flanking those regions in a pooled manner. One pair of primers was designed to survey the on-target sites for each of CD80 and H2Ab1 as the positive control. Aligned with previous results, on-target primers detected high levels of genomic modification (Fig. 4f–i). Modification was observed for a handful of predicated off-target sites (crCD80_4, crCD80_10 and crH2Ab1_10); however, modification for those sites was also found in the vector group, suggesting that these indels are likely due to PCR bias (Fig. 4f–j). Together, these results demonstrate the highly efficient on-target multiplexed gene editing of LSL-enAsCas12a while maintaining a controllable level of off-target effects.
Development of a simultaneous DAKO system using the LSL-enAsCas12a-HF1 mice
Attempts have been made to systematically study both the positive and negative regulators for the same biological processes45,46. These studies have relied on either conduction of two independent genetic manipulations (one loss of function and one gain of function) or relying on directions (upregulation and downregulation) of a single type of perturbation via data analysis45,46. However, these methods are indirect. So far, there remains a lack of an efficient tool for simultaneous gene activation and knockout within a single cell. To take on this challenge, we developed a DAKO system by crossing the LSL-enAsCas12a-HF1 mice with the dCas9-SPH mice (dCas9 fused with activation domain SunTag-p65-HSF1 for potent transcriptional activation)18 and selecting for double-positive progenies by genotyping to generate the LSL-enAsCas12a-HF1;dCas9-SPH DAKO mice (Fig. 5a). We also designed a Cas9–Cas12a fusion guide RNA system that expresses both types of CRISPR guide RNA (Cas9-sgRNA and Cas12a-crRNA) in a string: Cas9-sgRNA was concatenated with Cas12a-crRNA, separated by AsCas12a DR sequence, for simultaneous expression in the same cells (Fig. 5b). We hypothesized that this guide RNA chimera would be cleaved by enAsCas12a-HF1 protein, upstream of AsDR, into a mature Cas9-sgRNA and a mature Cas12a-crRNA, which would then direct the gene activation by dCas9-SPH and gene knockout by enAsCas12a-HF1 (Fig. 5b).
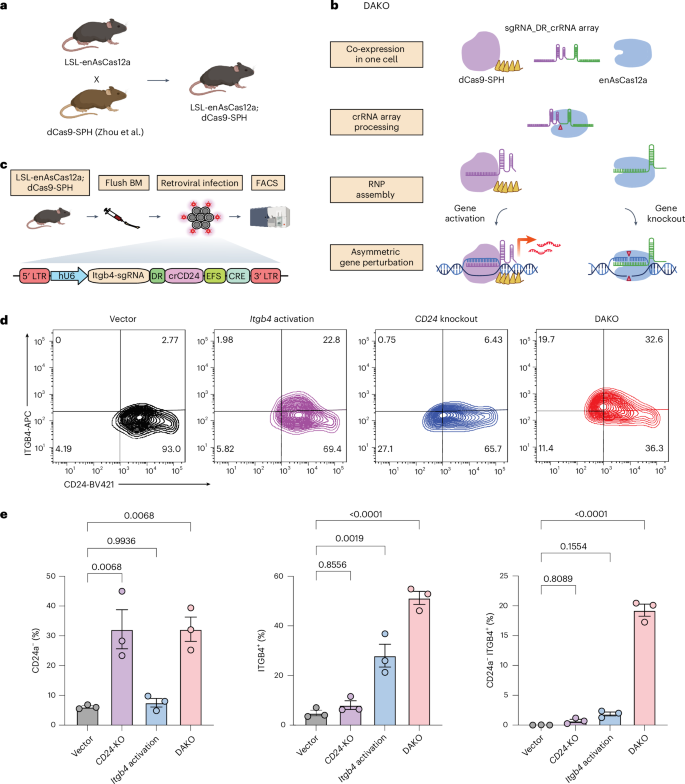
a, Schematic showing the breeding strategy of LSL-enAsCas12a-HF1;dCas9-SPH mice. Created in BioRender. Chen, S. (2025) https://BioRender.com/h16k998. b, Schematic demonstrating the mechanism of the simultaneous DAKO system. A dCas9-sgRNA was concatenated with Cas12a DR and crRNA. Upon delivery into the same cell, the guide chimera was then processed and cleaved into mature dCas9-sgRNA and Cas12a-crRNA by Cas12a protein. The mature dCas9-sgRNA and Cas12a-crRNA then assembled with corresponding protein to mediate gene activation and gene knockout, respectively. RNP, ribonucleoprotein. Created in BioRender. Chen, S. (2025) https://BioRender.com/t91r170. c, Schematic illustrating the retroviral construct and the workflow of ex vivo of DAKO validation in primary BMDCs. Human U6 promoter (hU6) drives the expression of a Cas9 activating guide for Itgb4 (Itgb4-sgRNA) concatenated with a Cas12a DR and crRNA targeting CD24 (crCD24). A Cre expression cassette was used to induce enAsCas12a-HF1 expression. BM, bone marrow. Created in BioRender. Chen, S. (2025) https://BioRender.com/d07o322. d, Flow cytometry analysis on LSL-enAsCas12a BMDC Itgb4-CD24 DAKO experiment. Representative contour plots of mScarlet+ BMDCs showing the Itgb4 expression in relation to the CD24 expression. Anti-ITGB4-APC and anti-CD24-BV421 were used in the flow staining. DAKO-crRNA containing both crItgb4 and crCD24 was compared with single crRNA (Itgb4-sgRNA and crCD24) and vector control. e, Quantification of CD24−, ITGB4+ and CD24−;Itgb4+ percentage with respect to mScarlet+ BMDCs. One-way ANOVA with Tukey’s multiple comparisons test was used to assess significance. For bar plot, data are shown as mean ± s.e.m. Exact P values are labelled. For all groups, N = 3 biological replicates.
Source data
To validate this system in primary immune cells, we isolated BMDCs from LSL-enAsCas12a-HF1;dCas9-SPH DAKO mice and infected them with retrovirus expressing a DAKO fusion guide cassette containing an Itgb4-sgRNA concatenated with an AsDR-crCD24, alongside a constitutively active EFS-Cre cassette (sgItgb4-crCD24-Cre vector) (Fig. 5c). We additionally included the vector, single activation (Itgb4-sgRNA) and SKO (crCD24) groups in parallel as controls. Flow cytometry analysis showed that the sgItgb4-crCD24-Cre DAKO targeting resulted in a comparable cell-population-level protein reduction of CD24 SKO as that of the SKO control (crCD24-Cre) (average 32.2% CD24-negative population of the infected BMDCs in both groups) (Fig. 5d,e and Supplementary Fig. 8c). The sgItgb4-crCD24-Cre DAKO also resulted in a cell-population-level protein upregulation of ITGB4 (average 51% ITGB4-positive population in DAKO) compared with that of the single-gene CRISPRa targeting control (average 27% ITGB4-positive population in sgItgb4-Cre control) (Fig. 5d,e). Higher ITGB4 upregulation in the DAKO group could be due to potential interactions between CD24 and ITGB4. Previous studies have reported CD24 to be able to affect the lateral localization of β integrins47,48. CD24 was shown to impact the detection of surface receptors through regulating receptor endocytosis and degradation47. On the basis of these studies, it is possible that CD24 knockout in the DAKO group leads to higher surface retention of ITGB4. However, the specific mechanism underlying it is out of the scope of this study and remains to be explored in the future. Importantly, only in the DAKO group did we observe a considerable level of anticipated dual-targeting population of cells with the correct direction of gene regulation (average of 19.3% CD24−;Itgb4+ cells in the sgItgb4-crCD24-Cre DAKO group, P < 0.0001 compared with vector control), compared with background levels in both the sgItgb4-Cre and crCD24-Cre control groups (P > 0.1 compared with vector, not significant) (Fig. 5d,e). These results suggested that the DAKO system (enAsCas12a-HF1;dCas9-SPH DAKO mice and the Cas9-sgRNA-Cas12a-crRNA chimeric fusion guides) could achieve efficient and simultaneous gene activation and knockout at the single-cell level, enabling orthogonal dual-gene targeting in immune cells.
Discussion
Deconvolution of complex gene-regulation networks is fundamental for understanding basic biology and the pleiotropic nature of human disease. Thus, a versatile technology for multiplexed in vivo and ex vivo genome engineering is needed to systematically study the gene interactions. Here we generated four versatile mouse lines: conditional LSL-LbCas12a and constitutive LbCas12a mice, as well as conditional LSL-enAsCas12a and constitutive enAsCas12a mice. LbCas12a knock-in mice, enAsCas12a knock-in mice and accompanied delivery system can serve as a versatile new set of genetic tools. The simplicity of multiplexing crRNAs into a single crRNA array streamlines the cloning process and investigations of multiplexed gene perturbations. We demonstrated that both the LbCas12a mice and enAsCas12a mice enable efficient genome editing across multiple types of immune cell, reaching efficiencies as high as 90–100%. More importantly, we have showcased the multiplexed gene editing capability of Cas12a mice at single cell level.
For compatible utilization of the conditional and constitutive enAsCas12a strains, multiple delivery methods (LNP, AAV and retrovirus) were also developed and applied in conjunction with these mice for efficient liver gene targeting, tumour modelling and primary immune cell editing, respectively. The liver Ttr gene was efficiently knocked out within a week using LNP-crRNA. Salivary gland SCC was induced rapidly within a month by targeting four TSGs for simultaneous knockout. Efficient DKO was demonstrated in both primary BMDCs and CD8 T cells, with higher efficiency than the LbCas12a mice. We also showcased the modular capability of our transgenic mice by integrating with the dCas9-SPH system to develop the simultaneous DAKO system.
Our constitutive and conditional Cas12a mouse strains enable efficient in vivo and ex vivo multiplexed genome engineering and provide opportunities for use in diverse fields. Although the efficiency of ‘self-cleaving’ induced by the 2A peptide could be improved, these mice demonstrate editing efficiency comparable to that of Cas9 knock-in mice and have unique advantages of crRNA array-based multiplexed gene editing compared with the Cas9 mice. These mice can facilitate rapid and seamless workflows for in vivo therapeutic gene targeting, disease/tumour modelling and primary immune-cell engineering. Combining with pooled oligo library synthesizing and cloning, these mice could be used for high-throughput CRISPR screening to study complex genetic questions, such as effector and memory phenotype transition in immune cells. In addition, these mice allow autochthonous tumour modelling of diverse tumour types (for example, SCC and LUAD) or tumour models with complex genotypes (for example, indels at different combinations of TSGs and chromosome aneuploidy). We noted that there were different levels of Cas12a expression across different organs in the constitutive Cas12a strains. Thus, while conducting pooled CRISPR screens with these mice, especially in in vivo settings, the expression level of Cas12a in the targeted tissue should be considered. Cre drivers with tissue/cell type specificity are recommended for driving Cas12a expression. The generation of Cas12a mice with other variations, including two species of the Cas12a here, as well as knock-in into a different safe harbour locus (H11-enAsCas12a mice)49, represents a convergent collective development of broadly enabling Cas12a gene editing toolkits for applications in diverse fields.
Methods
Institutional ethics and regulatory approval
The study has obtained regulatory approval from the relevant institutions. All activities involving recombinant DNA and biosafety were carried out in accordance with the guidelines set by the Yale Environment, Health, and Safety (EHS) Committee, following an approved protocol (Chen-rDNA 15-45; 18-45; 21-45). Furthermore, all animal-related work adhered to the guidelines established by the Yale University Institutional Animal Care and Use Committee (IACUC), following approved protocols (Chen 20068).
Generation of LSL-LbCas12a and LSL-enAsCas12a mouse lines
LoxP-Stop-LoxP (LSL)-LbCas12a and LSL-enAsCas12a mice were both produced via CRISPR/Cas9-mediated genome editing50,51,52 through the pronuclear microinjection of C57BL/6J zygotes with crRNA/tracrRNA/Cas9 ribonucleoprotein (RNP) and donor plasmid DNA. A Rosa26-targeting crRNA (5′-ACTCCAGTCTTTCTAGAAGA-3′)53 was used in the RNP. The Ai9 Rosa26-targeting vector was utilized to subclone a codon-optimized LbCas12a or enAsCas12a-HF1 cDNA (with substitutions E174R/N282A/S542R/K548R), resulting in the creation of the LSL-NLS-LbCas12a-NLS-3x HA-P2A-GFP or LSL-Egl_13-enAsCas12a_HF1-NLS-Myc-2A-eGFP transgenic expression cassette16,19,54. Embryos were transferred to the oviducts of pseudo-pregnant CD-1 foster females using standard techniques55. Unique sequencing and genotyping primers were designed using the NCBI Primer Blast tool, targeting the Mus musculus genome. Internal LbCas12a primers (forward 5′-TGCTGAGCGATCGGGAGTCT-3′ and reverse 5′-TGGTCCACCTTCAGCAGGATG-3′) were used to identify the presence of LbCas12a transgene, while internal enAsCas12a primers (forward 5′-TTTCCACGTGCCTATCACACT-3′ and reverse 5′-GCCCTTCAGGGCGATGTG-3′) were used to confirm the targeting of the enAsCas12a transgene at the Rosa26 site in founder mice. Rosa26 primers external to the Ai Rosa26-targeting vector were used for amplification and Sanger sequencing to verify the accurate integration of the transgenic expression cassette. Constitutive LbCas12a and enAsCas12a mice were generated by crossing LSL-LbCas12a or LSL-enAsCas12a mice with CMV-Cre mice (The Jackson Laboratory).
Mouse primary ear fibroblast cultures
Mouse ear tissue was collected and sterilized by incubating in 70% EtOH for 3 min. Primary fibroblast cultures were obtained by subjecting small pieces of mouse ear tissue to a 30 min digestion with Collagenase/Dispase (Roche) at 37 °C under agitation. The resulting supernatant was collected and washed with 2% FBS. After filtration through a 40 μm filter, the cell suspensions were resuspended in DMEM media supplemented with 10% FBS and 1% Pen/Strep.
Characterization of Cas12a expression in different organs by IVIS spectrum
Mice were euthanized by cervical dislocation and major organs, including liver, spleen, kidney, heart, lung and brain, were collected and put in 2% FBS-DPBS. Heterozygote and homozygote constitutive active enAsCas12a mice were compared with LSL-enAsCas12a mice in batch, while only heterozygote constitutive active LbCas12a mice were compared with LSL-LbCas12a. Organs were placed into 12-well plates and subjected to IVIS spectrum imaging for GFP signal quantification. A piece of each organ was then cut and frozen under −80 °C for protein extraction and western blotting.
Widefield fluorescence microscopy
Primary ear fibroblast was first plated in an 8-well glass bottom µ-slide (Ibidi), which was pre-coated with 2 µg cm−2 poly-l-lysine (Sigma-Aldrich) according to the manufacturer’s recommendations. Widefield fluorescent images of the mouse primary fibroblast cultures were taken using a Leica DMi8 widefield fluorescence microscope. The images were captured when the cells reached a confluency level of about 80%.
Protein extraction from organ tissue
Organ tissues (10–30 mg) were cut into small pieces and resuspended into 300 µl of lysis buffer (RIPA buffer supplemented with proteinase inhibitor cocktail). Then, the tissues were homogenized by sonication on ice (50% power, 5 s work, 5 s rest) for 30 s. Lysis buffer (200 µl) was added and continued to agitate at 4 °C for 1.5 h to lyse the cells. Cell debris were removed by centrifugation at 4 °C, 16,000 × g for 20 min. Protein lysates were denatured by adding 4× sample buffer (supplemented with 2% β-ME) and boiling under 95 °C for 5 min. Samples were then stored at −80 °C.
Western blot analysis
Protein samples from major organs were collected as previously described. Mouse primary ear fibroblast cultures mentioned above were washed with DPBS and collected using cell scrapper and lysis buffer, RIPA buffer (Boston BioProducts) supplemented with Halt proteinase inhibitor cocktail (Thermo Fisher). Cells were lysed for 1 h at 4 °C with agitation. Then, cell lysates were spun down at 4 °C, 2,000 × g for 20 min and protein-containing supernatants were collected. Protein concentrations were quantified using Pierce BCA Protein Assay kit (Thermo Fisher, 23225) and normalized. 4× Laemmli Sample Buffer (Bio-Rad, #1610747) with beta-mercaptoethanol (Sigma-Aldrich) was added to the supernatant, followed by heat incubation at 95 °C for 5 min for denaturation. Proteins were then loaded on 4–20% Tris-glycine gels for electrophoresis. Proteins on gel were transferred to 0.2 μm nitrocellulose membranes. Membranes were blocked with 2.5% bovine serum albumin and stained with mouse anti-MycTag (Cell Signaling Technology, mAb#2278, 1:1,000) for enAsCas12a or anti-HATag (Thermo, 5B1D10, 1:1,000) for LbCas12a, anti-eGFP (Thermo, CAB4211, 1:1,000), anti-β-actin (Santa Cruz Biotechnology, sc-47778, 1:2,000) and rabbit anti-GAPDH (Thermo Fisher, MA1-16757, 1:2,000) overnight at 4 °C. The next day, membranes were incubated with secondary antibodies, anti-mouse immunoglobulin G (IgG) (Cell Signaling, 7076, 1:5,000) and anti-rabbit IgG (Cell Signaling, 7074, 1:5,000) for 1 h at room temperature. ECL prime western blotting detection reagents (Bio-Rad) were used for chemiluminescence detection and imaged using Bio-Rad gel doc.
Whole mouse phenotyping
Nineteen mice—(a) 3 males and 3 females, 12–16 weeks old, genetic control C57BL/6J; (b) 3 males and 3 females, 10–28 weeks old, LbCas12a; and (c) 2 females and 4 males, 4–10 weeks old, enAsCas12a—were submitted to the Comparative Pathology Research (CPR) Core (Department of Comparative Medicine, Yale University School of Medicine) for comprehensive mouse phenotyping blind to genotype (C.J.B.). The mice were euthanized by carbon dioxide asphyxiation and weighed, followed by exsanguination by terminal cardiac puncture. The blood was placed into a 0.5 ml Greiner Bio-One minicollection tubes (VWR International) with ethylenediaminetetraacetic acid (EDTA) and sent for a CBC analysis by a commercial veterinary diagnostic laboratory (Antech Diagnostic Laboratory). The mice and internal organs were examined for gross (macroscopic) pathologic changes and then the tissues were collected. All tissues except for the head, one rear leg and sternum were immersion-fixed in 10% neutral buffered formalin. The lungs were inflated with ~1 cc 10% neutral buffered formalin. The sternum, head with the calvaria removed and rear leg with the skin removed were immersion-fixed and decalcified in Bouin’s solution (Ricca Chemical). All tissues were subsequently trimmed, placed in cassettes (9 per mouse), processed to paraffin blocks, sectioned and stained for H&E by routine methods for a total of 171 H&E slides. Specifically, the tissues were trimmed as follows: (A) midline sagittal section of the head (rostral to caudal) and (B) multiple transverse sections of the other side of the head (rostral to caudal) to evaluate the brain, pituitary, eye, ears, nasopharynx and so on in situ; (C) rear leg and sternum to evaluate the bone, bone marrow and skeletal muscle; (D) heart (longitudinal) to evaluate all four chambers; (E) liver (multiple pieces), gall bladder, pancreas, kidney (transverse and longitudinal), adrenal glands and spleen (red and white pulp); (F) tongue, stomach (glandular and squamous) and small intestine (duodenum, jejunum and ileum); (G) mesenteric lymph nodes and large intestine (proximal colon, mid colon, distal colon and caecum); (H) urinary bladder, reproductive tract for both sexes and male accessory sex glands; (I) submandibular salivary glands and lymph nodes, thyroid glands and skin. Tissues are evaluated blind to experimental genotype for abnormal developmental morphologic changes and increased inflammation and neoplasia as previously performed56,57,58,59,60. The gross and microscopic changes were consistent with normal C57BL/6 mice. Specifically, there were no substantial macroscopic or microscopic findings in any of the organs or tissues. The CBC results were analysed and there were no substantial differences when compared with the normative data for C57BL/6J mice. Representative photomicrographs of the rear leg bone/bone marrow, spleen, thymus, heart, lung, liver, transverse kidney, kidney cortex, hippocampus and cerebellum for all three strains of mice show no overt or substantial morphologic differences (Supplementary Fig. 2). The H&E slides were analysed and photographed, and the figures were made by C.J.B. (CPR Core, Yale University School of Medicine, Department of Comparative Medicine).
LbCas12a crRNA design and cloning
The design of LbCas12a crRNAs primarily utilizes Broad’s CRISPick algorithm10,27. To further enrich for highly functional LbCas12a crRNAs, CRISPick-designed guides were chosen based on their predicted ability to cut with greater than 40% efficiency. Guides were then subcloned into lentiviral and retroviral plasmids, as previously described54. Designs of lentiviral and retroviral plasmids are described below.
Lentiviral production
pLenti-U6-DR-crRNA(Esp3I)-EF1a-Puro-P2A-Firefly luciferase transfer plasmid was generated as previously described14. To generate lentivirus, 106 HEK293 cells (Invitrogen) were plated into a 6-well plate the night before in D10 media (DMEM + 10% FBS + 1% Pen/Strep). The next day, media were changed, and cells were allowed to incubate at 1–2 h at 37 °C before transfection. Transfer plasmid (1 μg), psPAX2 packaging plasmid (0.75 μg) and pMD2.G envelope plasmid (0.5 μg) were added to 50 μl of DMEM media. In a separate tube, 3 μl of LipoD293 (Signagen) was added to 50 μl of DMEM media and then quickly added to a DNA/DMEM mixture. The transfection mixture was then incubated at room temperature for 10–15 min before being added to the HEK293 cells. Lentivirus in the supernatant was collected 48 h after transfection, spun down at 3,000 × g for 5 min and then filtered through a 0.22 μm filter. Lentivirus was either used directly for experimentation or stored in −80 °C before use.
Generation of LbCas12a-expressing cell lines and lentiviral infection
Non-small cell lung cancer cell line expressing LbCas12a (KPD-LbCas12a) was generated and cultured as previously described14. The day before lentiviral transduction, 3 × 10⁵ KPD-LbCas12a cells were plated in a 6-well plate. Uninfected KPD-LbCas12a cells were included on each plate to determine the extent of puromycin positive selection. Vector controls were included for each experiment to calculate the cutting efficiency of each crRNA. Media were changed and supplemented with 8 μg ml−1 polybrene (Millipore) to increase transduction efficiency. Lentivirus (1 ml) was added to the indicated well and incubated overnight at 37 °C. Media were changed the following morning and supplemented with 5 μg ml−1 puromycin (Gibco). Lentiviral transduced KPD-LbCas12a cells were selected with puromycin for 3 days when the uninfected KPD-LbCas12a cells (negative control) were no longer viable as determined by light microscopy. Upon the completion of puromycin selection, infected KPD-LbCas12a cells were trypsinized and collected. Cell pellets were washed twice with PBS before genomic DNA extraction and purification. QIAamp DNA Mini Kit was used to extract and purify genomic DNA of infected cells.
T7E1 assay
We sorted gene-edited samples 5 days post transduction to ensure the purity. The genomic DNA (gDNA) was extracted by either QIAamp DNA Mini Kit (Qiagen) or QuickExtract (Epicentre) buffer. Genome regions flanking the crRNA targeting sites were amplified by PCR using Phusion Flash High-Fidelity Master Mix (Thermo Fisher). T7E1 was then conducted on the PCR amplicons according to the manufacturer’s protocol (New England Biolabs): 100 ng of gDNA per 50 µl reaction as input, with an estimate of 15,000 cells covered.
Generation of retroviral LbCas12a guide delivery system
The retroviral base vector pRetro-U6-DR-crRNA(BpiI)-EFS-mScarlet was generated by subcloning U6-DR-crRNA(Esp3I) regions from pLenti-U6-DR-crRNA(Esp3I)-EF1a-Puro-P2A-Firefly luciferase transfer plasmid and mScarlet from pEB2-mScarlet transfer plasmid61 into MSCV-IRES-Thy1.1 retroviral transfer plasmid62. The Esp3I cut site in pRetro-U6-DR-crRNA(Esp3I)-EFS-mScarlet was mutated to the BpiI cut site owing to the presence of multiple Esp3I cut sites in the resulting plasmid. Various crRNA arrays were cloned into the retroviral base vector.
Generation of retroviral enAsCas12a guide delivery system
The retroviral vector pRetro-hU6-AsDR-doubleBbsI-EFS-Cre-mScarlet was generated by Gibson Assembly. hU6-DR-doubleBsmBI was amplified from pLenti-hU6-doubleBsmBI-EF1α-mCherry-Puro. The fragment was then subcloned into digested pRetro-hU6-doubleBbsI-Cas9Scaffold-EFS-Cre-mScarlet. The double BsmBI cut site downstream of the hU6 promoter was replaced by a double BbsI site owing to the presence of multiple BsmBI cut sites in the backbone plasmid. Different retroviral vector variations (containing different crRNAs) were generated via BbsI digestion of the vector, followed by ligation with crRNA arrays.
Retroviral production and concentration
To generate retrovirus, 40 million HEK293-FS cells were plated into each 150 mm tissue culture plate the night before transfection. HEK293-FS cells were cultured using the complete DMEM medium (DMEM supplemented with 10% FBS and 1% Pen/Strep). On the day of transfection, complete medium was replaced by 13 ml pure DMEM and cells were allowed to incubate at 37 °C for 30 min to 1 h. For each plate, 16 μg of transfer plasmid (pRetro-hU6-DR-doubleBbsI/crRNA-EFS-Cre-mScarlet) and 8 μg of pCL-Eco packaging plasmid were added to 440 μl of Opti-MEM. After thorough mixing, 72 μl of PEI was added to the mixture and vortexed such that the PEI/DNA ratio was 3:1. After incubation at room temperature for 10 min, the transfection complex was added dropwise to each plate. Cells were incubated at 37 °C for 8 h to allow transfection to take place. Complete DMEM medium (8 ml) was supplemented to each plate 8 h post transfection. Retrovirus in the supernatant was collected 48 h post transfection, followed by centrifugation at 3,000 × g for 10 min at 4 °C to remove debris. The virus-containing supernatant was then concentrated by adding autoclaved 40% PEG8000 (m/v) to a final concentration of 8% PEG8000. Then, the mixture was incubated at 4 °C overnight. The retroviral particles were spun down at 3,000 × g for 15–30 min and resuspended with 1 ml of fresh complete RPMI (RPMI supplemented with 10% FBS, 1% Pen/Strep, 1% NEAA, 1% sodium pyruvate, 2% HEPES and 50 μM beta-mercaptoethanol). Retrovirus was then stored at −80 °C before use.
Lymphocyte isolation and culture
Spleens were isolated from LbCas12a mice or LSL-enAsCas12a-HF1 mice and placed in ice-cold 2% FBS (PBS (Gibco) + FBS (Sigma)). Single-cell suspensions were prepared by mashing spleens through a 100 μm filter. Splenocytes were suspended in 2% FBS. RBCs were lysed with ACK lysis buffer (Lonza), incubated for 2 min at room temperature and washed with 2% FBS. Lymphocytes were filtered through a 40 μm filter and resuspended with MACS buffer (PBS + 0.5% BSA + 2 mM EDTA). CD4+ and CD8+ T cells were isolated using mouse CD4+ and CD8+ T cell isolation kit from Miltenyi, respectively. B cells were isolated using mouse B cell isolation kit from Miltenyi. All lymphocytes were resuspended to a final concentration of 2 × 10⁶ cells per ml. T cell cultures were cultured in 96-well round-bottom plates with plate-bound anti-CD3 (1 μg ml−1; BioLegend) and soluble anti-CD28 (1 μg ml−1; BioLegend), IL-2 (2 ng ml−1; Peprotech) and IL-12 (2.5 ng ml−1; Peprotech). B cells were cultured in 96-well round-bottom plates with plate-bound anti-IgM (1 μg ml−1; Southern Biotech) and soluble anti-CD40 (1 μg ml−1; BioLegend), IL-4 (5 ng ml−1; Peprotech), IL-21 (10 ng ml−1; Peprotech) and recombinant human BAFF (10 ng ml−1; R&D).
BMDC isolation and culture
The femur and tibia were collected from LbCas12a mice or LSL-enAsCas12a-HF1 mice and temporarily stored in ice-cold 2% FBS (Sigma) in DPBS (Gibco). Bones were then sterilized using 70% ethanol for 3 min. Ethanol was then removed by washing with 2% FBS 3 times. Both ends of the bones were cut open with sterilized surgical tools and the bone marrow was flushed out using insulin syringes. RBCs were lysed with ACK lysis buffer (Lonza) for 2 min at room temperature, washed with 2% FBS and resuspended in complete RPMI medium. Cells were then filtered through a 40 μm strainer and resuspended with complete RPMI supplemented with 25 ng ml−1 murine GM-CSF (Peprotech) to a final concentration of 2 million cells per ml and plated in 24-well plates.
Spin infection
Polybrene was added to a final concentration of 10 μg ml−1 18–24 h after cell plating. Cells were preincubated for 30 min at 37 °C. Concentrated retrovirus stock was diluted 2 times with complete RPMI (supplemented with 10 μg ml−1 polybrene, 10 ng ml−1 IL-2 for T cell and 25 ng ml−1 GM-CSF). Cells were spun down at 900 × g for 90 min at 37 °C, followed by another 30 min incubation at 37 °C in an incubator. Viral medium was then completely replaced by fresh medium and cells were cultured for additional 5–6 days. The transduction efficiency (mScarlet expression) was verified at day 5 post transduction (typically 10–30% in BMDCs and 5–10% in T cells at a corresponding multiplicity of infection of approximately 0.3 or lower). Transduced cells were sorted to over 90% purity based on mScarlet expression at day 5 post transduction for downstream genomic DNA extraction.
Antibody and flow cytometry
Generally, cells were then stained with indicated antibody cocktails suspended in MACS buffer for 30 min on ice. For chemokine receptors and cycling proteins, cells were stained at 37 °C for 30 min, followed by surface staining for 30 min on ice. For BMDCs and B cells, cells were stained with anti-CD16/32 to neutralize IgG Fc receptors before any surface protein staining. LIVE/DEAD Fixable Near-IR Dead Cell Stain (Invitrogen) was included in surface stains to exclude dead cells from analysis. B cell lineage markers include anti-CD19 BV421; occasionally, anti-CD24 BV421 or PE/Cy7 was used as a B lineage defining surrogate. T cell lineage markers include anti-CD3 PE/Cy7 and anti-CD4/8 BV421; occasionally, anti-CD90.2 (Thy1.2) APC was used as a T cell lineage surrogate. BMDC lineage markers include anti-MHCII fluorescein isothiocyanate, anti-CD11b BV421 and CD11c PE/Cy7. Infected leukocytes were defined as Lin+mScarlet+. Data from about 2,000–10,000 mScarlet+ (transduced) cells were collected for downstream analysis. Other antibody stains include anti-CD14 APC, anti-CD24 APC, anti-CD30 APC, anti-CD43 APC, anti-CD96 APC, anti-CD115 APC, anti-CD125 (Il5ra) APC, anti-CD127 (Il7ra) APC, anti-CD152 (Ctla4) APC, anti-CD172A (Sirpa) APC, anti-CD184 (Cxcr4) APC and anti-CD279 (Pdcd1) APC. Samples were collected and sorted on a BD FACSAria cell sorter with 4 lasers (405 nm, 488 nm, 561 nm and 640 nm) to >80% purity. Data were analysed using FlowJo software 10.8.0 (BD) on a MAC workstation.
Immune cell genomic DNA extraction
For every 50,000 cells, 20 μl of QuickExtract (Epicentre) buffer was added, and the suspension was incubated at 65 °C for 30 min, and then at 95 °C for 5 min. Samples were vortexed thoroughly before PCR.
WGS sample preparation
BMDCs infected with guide delivery retrovirus were sorted with a BD FACS Symphony S6 sorter, followed by genomic DNA extraction with QIAamp DNA Blood Kits (Qiagen). DNA samples were sent to the Yale Center for Genome Analysis (YCGA) for WGS library preparation and sequencing using the NovaSeq X platform.
WGS data analysis
Data quality was first briefly examined by FastQC (version 0.12.1)63. Then, fastq files for each sample were aligned to GRCm39 (Gencode vM32) with pair-end mode BWA-mem64 (version 0.7.17-r1188). Duplicate reads were identified and marked using Picard, the output of which was then piped to GATK HaplotypeCaller65 for variant calling. Related samples were joint for genotyping and variant filtration. Specifically, INDELs were primarily filtered by the following criteria: QD > 2.0, QUAL > 30.0, FS < 200.0, ReadPosRankSum > −20.0. Then, secondary variant filtration using custom Python script preserved only variants that were not detected in the control groups but detected in treatment groups (at least 8 variant reads and variant allele frequency >35%). GRIDSS was used to call structural variants66. Data were then visualized using R and RCircos67.
Nextera library preparation and sequencing
For each sample in the T7E1 assay, PCR products were tagmented, amplified (1 ng of gDNA as input) and assigned barcodes using the Nextera XT DNA Library Prep Kit from Illumina. Each sample’s library underwent individual quality control and measurement using the 4150 TapeStation system (Agilent). This was followed by combining the libraries and purifying them with the QIAquick PCR purification kit (Qiagen). A subsequent round of quality control and measurement was performed again using the 4150 TapeStation system. The libraries were then sent to the Yale Center for Genome Analysis for sequencing on Novaseq 6000.
Quantification of gene modification percentage from NGS data
FASTQ reads were quality controlled by running FastQC v0.11.9 (ref. 63) and contaminations by the Nextera transposase sequence at 3′ end of reads were trimmed using Cutadapt v3.2 (ref. 68) (-a CTGTCTCTTATACACATCT -A AGATGTGTATAAGAGACAG). Processed reads were aligned to the amplicon sequence and quantified for insertions, deletions (indel) and substitutions using CRISPResso2 v2.1.3 (ref. 69). Specifically, we retrieved amplicon sequences, which were 150–250 bp (according to the length of reads) flanking crRNA target sites, from the mm10 genome. A 5 bp window, centred on predicted LbCas12a or enAsCas12a-HF1 cutting sites, was used to quantify genetic modification for each crRNA in both vector control groups and experimental groups (–w 5 –wc –2–exclude_bp_from_left 30–exclude_bp_from_right 30). Allele frequency plots were generated with CRISPResso2 (–annotate_wildtype_allele WT–plot_window_size 12). Percent-modification data from each sample were aggregated for analysis and visualization in R.
LNP-crRNA packaging
crRNAs targeting Ttr were designed using the CRISPick algorithm from the Broad Institute10 and synthesized by IDT (Alt-R) with IDT-proprietary RNA modification. crRNA was reconstituted in 300 μl of RNase-free water and then 1.4 ml of 25 mM sodium acetate at pH 5.2 was added. The lipid mixture was composed of 46.3% ALC-0315, 1.6% ALC-0159, 9.4% DSPC and 42.7% cholesterol and was diluted 4 times with ethanol before use. The LNP-crRNA was assembled using a NanoAssemblr Ignite instrument (Precision Nanosystems) following the manufacturer’s instructions. The formulated LNP-crRNA was buffer-exchanged to PBS using a 30 kDa Amicon filter unit, and 40% (v/v) sucrose was added to the final concentration of 8% (v/v) as the cryoprotectant. For quality control, the LNP-crRNA particle size was determined by a DLS device (DynaPro NanoStar, Wyatt, WDPN-06), and the encapsulation rate and crRNA concentration were measured by a Quant-iT RiboGreen RNA assay (Thermo Fisher).
LNP-tracrRNA-cy5 packaging test
Cas9 tracrRNA was labelled using Label IT Nucleic Acid Labeling Reagents (VWR) according to the manufacturer’s protocol, followed by LNP packaging. LNP containing the labelled tracrRNA was then added to NIH/3T3 cells. Cells were collected by trypsinization and washed with DPBS before flow cytometry analysis. Flow cytometry analysis was run 3 h and 6 h after to quantify the delivery efficiency.
Liver TTR protein targeting using LNP-crRNA
To test the crRNA in vitro, cells were collected by trypsinization 3 days after in vitro delivery of crRNAs into NIH/3T3 cells expressing enAsCas12a. The T7E1 assay was performed on gDNA extracted from the cells to quantify the in vitro editing efficiency in a mouse cell line. After genotype verification by PCR, 15 constitutive enAsCas12a-HF1 mice (8 males, 7 females, 8–14 weeks old) were randomly assigned, stratified by sex, to 3 treatment groups: NTC1 (3 males and 2 females), Ttr-cr1 (2 males and 3 females) and Ttr-cr2 (3 males and 2 females). For each group, LNP-crRNA containing 0.034 µg of RNA was injected intravenously into each mouse. Serum samples were collected before injection (day 0) and day 6, day 12 and day 20 post injection via retro-orbital blood draw. ELISA was performed on all serum samples after day 20 to measure the serum TTR level using the Mouse Prealbumin ELISA kit (Abcam).
Design and cloning of AAV-CRISPR vectors
The AAV-CRISPR vectors were designed to contain Cre recombinase under control of an EFS promoter for the induction of enAsCas12a-HF1 expression when delivered to LSL-enAsCas12a-HF1 mice. They also contain a truncated human NGFR (tNGFR) for better sorting of the infected cells. An open crRNA array cassette (double SapI cutting site) for crRNA array cloning was expressed by a human U6 promoter. pAAV-hU6-DoubleSapI-EFS-Cre-truncatedNGFR was generated by PCR and subcloned from pAAV-hU6-sgbbSapI-hTBG-Fluc-P2A-Cre. Guides targeting each of the four TSGs (Trp53, Pten, Apc and Rb1) were designed using the CRISPick algorithm from the Broad Institute10 and individually tested in the NIH/3T3-enAsCas12a-HF1 cell line using a lentiviral vector, pLenti-hU6-AsDR-EF1α-mCherry-2A-Puro. Working guides were concatenated into the crRNA array, which was named crTSG, and cloned into the AAV-CRISPR vector.
AAV production and purification
AAV vector plasmid and AAV-crTSG were used for AAV9 production and purification using Lenti-X 293 T cells (Takara Bio). Each set of Lenti-X 293 T cells (six 150 mm plates) were transiently co-transfected with the AAV vector or AAV-crTSG1, AAV9 serotype plasmid and pDF6 using polyethyleneimine (PEI). Lenti-X 293 T cells were cultured to approximately 80% confluency before transfection. Before transfection, medium was changed to 13 ml serum-free DMEM. The transfection mixture for each plate was prepared by first mixing 6.2 μg AAV vector/AAV-crTSG1, 8.7 μg AAV9 plasmid and 10.4 μg pDF6 plasmid with 434 μl of Opti-MEM and then adding 130 μl of PEI. The transfection mixture was then incubated at room temperature for approximately 20 min to allow transfection complexes to form. The transfection complexes were then added dropwise to each plate and 7 ml of complete DMEM (D10) was supplemented to each plate 8 h after transfection. Cells were collected by cell scrappers and collected in 50 ml canonical tubes. A 1/10 volume (3 ml chloroform for 30 ml cells in DPBS) of chloroform was added to each tube, and the mixture was vigorously vortexed for 5 min to lyse the cells. About 7.6 ml of 5 M NaCl was added to each tube, which was then vortexed for 10 s. After 5 min of centrifugation at 3,000 × g, the aqueous phase was collected to a new tube, in which 9.4 ml of 50% (w/v) PEG8000 was added to precipitate virus particles. After 1 h incubation on ice, the virus particle was spun down at 3,000 × g for 30 min. The pellet was then resuspended with 5 ml of HEPES buffer (50 mM, pH 8.0), followed by 1 μl ml−1 Super Nuclease (SinoBiological; supplemented by 1 μl ml−1 1 M Mg2+) treatment at 37 °C for 30 min. Pure chloroform was added at a 1:1 ratio to volume in each tube, which was vortexed for 10 s, followed by 3,000 × g centrifugation for 5 min. The aqueous phase was collected, and the process was repeated until the aqueous phase became visibly clear. The final aqueous phase was isolated and buffer exchanged to DPBS with a 100 kDa Millipore filter unit. Additional DPBS was added to make up a final volume of 0.5 ml. Genome copy number (GC) of AAV was titrated by real-time quantitative PCR using a custom Taqman probe targeting Cre gene.
Tumour induction mediated by AAV i.v. and i.t. injection
For i.v. injection, 10 LSL-enAsCas12a-HF1 mice (5 males and 5 females, 12 weeks old) were genotypically verified by PCR and randomly assigned to 2 treatment groups: AAV vector (3 males and 2 females) and AAV-crTSG (2 males and 3 females). For each mouse, approximately 1.4 × 10¹² genome copies of AAV (within the 200 µl i.v. injection limit) were injected. Mice were monitored weekly for tumour growth and palpable tumour was observed starting from 3 weeks post injection. All mice were euthanized within 7 weeks post injection. Tumour tissue and major organs were collected for IVIS spectrum imaging, histology sectioning and gDNA extraction using the Monarch genomic DNA purification kit (New England Biolabs).
For i.t. injection, 12 LSL-enAsCas12a-HF1 mice (7 males and 5 females, 8–12 weeks old) were genotypically verified by PCR and randomly assigned to 2 treatment groups: AAV vector (3 males and 3 females) and AAV-crTSG (4 males and 2 females). For each mouse, roughly 3 × 10¹¹ genome copies of AAV (within the 50 µl i.t. injection limit) were injected following a well-established protocol70. Mice were euthanized 10 weeks post injection. Lung and other major organs were collected for IVIS spectrum imaging, gDNA extraction using the Monarch genomic DNA purification kit (New England Biolabs) and histology sectioning.
Histology on tumour or organ samples
Collected tumour and major organs were placed in histology cassettes and submerged in 10% formalin for 24 h and then transferred to 70% ethanol for storage. The samples were then sent to the Yale Department of Pathology for H&E staining and IHC staining (GFP, Ki67, CD45LCA, CD3, CD11b, Ly6B and F4/80).
Antibody conjugation with DNA oligonucleotides
The antibody conjugation with DNA oligonucleotides was followed from the User Manual Rev C of Akoya Biosciences. In brief, four IgG isotype antibodies targeting APC (Abcam, ab40778), P53 (Fisher, AF1355), PTEN (R&D, MAB847) and RB1 (Fisher, MA5-32103), respectively, were each assigned with unique PhenoCycler CODEX Barcodes. To block non-specific binding of the antibody to the 50 kDa molecular weight cut-off filter (Millipore, #UFC9050), the filter was incubated with a blocking buffer for 30 min at room temperature. Following this, 50 μg of the antibody solution was added to the filter and centrifuged at 14,000 × g for 10 min. The flow-through was discarded, and the filter was washed three times with PBS. The antibody was then conjugated with the CODEX Barcodes by incubating with the barcode solution for 1 h at room temperature. After incubation, the conjugated antibody solution was centrifuged at 14,000 × g for 10 min to remove unbound barcodes. The filter was washed three times with PBS, and the conjugated antibody was eluted by adding elution buffer and centrifuging at 14,000 × g for 10 min. The eluted CODEX antibody solution was collected and stored at 4 °C until further use. All other CODEX antibodies purchased from Akoya are already tagged with CODEX Barcodes. Therefore, conjugation is not necessary.
CODEX spatial phenotyping using PhenoCycler-Fusion and data analysis
The CODEX PhenoCycler-Fusion protocol for formalin-fixed paraffin-embedded (FFPE) tissue section from Akoya Biosciences was followed. In specific, FFPE tissue section was deparaffinized in xylene for 10 min, followed by rehydration through a graded ethanol series (100%, 95%, 70% and 50%) for 5 min each. The section was then rinsed in distilled water for 5 min. Antigen retrieval was performed by heating the sections in a citrate buffer (0.01 M) at 95 °C for 20 min using a microwave oven. After cooling to room temperature, the section was washed in hydration buffer twice and equilibrated with staining buffer for 20 min. Then, the tissue slide was incubated with the antibody cocktail at room temperature for 3 h in a humidity chamber. After incubation, the tissue was subjected to several procedures, including post-fixation, ice-cold methanol incubation and a final fixation step. The tissue section, once mounted on the flow cell, was incubated in 1× PhenoCycler buffer with an additive for 10 min to enhance adhesion. Subsequently, the CODEX cycles were initiated, the reporter plate was assembled and loaded, and the imaging procedure commenced. Ultimately, a final qptiff file was produced, which could be analysed using QuPath v0.5.
Cell segmentation was carried out using a StarDist-based model within QuPath. The DAPI channel was utilized as the nuclear marker for this segmentation. The average intensity of each marker for every segmented cell was exported along with the cell centroids in a CSV format. Downstream analysis was conducted using the R package of Seurat 4.3.0 (ref. 71). Visualization of spatial heterogeneities was achieved using the ‘RunUMAP’ function through the Uniform Manifold Approximation and Projection (UMAP) technique. Clusters were spatially represented via the ImageDimPlot function. The FindAllMarkers function identified differentially expressed proteins across clusters, and results were visually represented in a heatmap generated by the DoHeatMap function.
Targeted sequencing and analysis to survey the potential off-target sites
Potential enAsCas12 editing off-target sites were predicted by Cas-OFFinder44. For each of crCD80 and crH2Ab1, ten pairs of primers were designed to amplify predicted off-target sites and one pair of primers to amplify the on-target site. PCR primers that have Nextera transposon adaptor sequences were designed near those sites to generate a 200–250 bp amplicon (Supplementary Dataset). Potential off-target sites from BMDC DNA samples were amplified using two rounds of PCR strategy. For first-round PCR, 40 ng DNA samples were amplified in a 20 μl PCR reaction with Tm = 61 °C for 20 cycles. For second-round PCR, 1 μl first-round PCR product was used as the template for PCR with Tm = 61.2 °C for 20 cycles. Second-round PCR added dual indexing barcode by using primers from Nextera XT index kit v2 set B (Illumina). Pooled samples were sent to the Yale Center for Genome Analysis for sequencing on NovaSeq X plus and the data were analysed using CRISPResso2 v2.1.3 (ref. 69). Synthesis for primers amplifying crCD80-6 site failed; thus, we excluded it from our analysis.
Characterization of in vivo autochthonous tumour single-clone editing efficiency
In vivo SCC and LUAD tumour cells were digested with type IV collagenase and serial-diluted into single clones in 96-well plates. Genomic DNA from ten single clones were collected when confluent from both SCC and LUAD samples. Genome-specific primers were designed to amplify the four TSGs from each single clone. Sanger sequencings were performed to verify the gene editing effect from each gene in each tumour single clone.
Targeted sequencing library preparation and data analysis
PCR primers, with 5′ Nextera transposase sequence overhang, were designed to amplify the 150–250 bp genome region flanking each crRNA target site. First round of 20-cycle PCR was to amplify the targeted genome region, using 100 ng gDNA per 50 µl reaction as input. First-round PCR reaction (1 µl) was taken as the template for second-round indexing PCR, using Nextera XT index kit v2 set B (Illumina), for another 20 cycles. A portion of the final PCR products were run on the E-Gel (Invitrogen) to quantify the concentration. PCR products from different samples were normalized, pooled and purified using the QIAquick PCR purification kit (Qiagen). The library was then sent to the Yale Center for Genome Analysis for sequencing on NovaSeq 6000 or NovaSeq X plus. Data analysis followed the same pipeline as NGS data processing described above using CRISPResso2 v2.1.3.
Sample size determination
Sample size was determined according to the lab’s previous work or from published studies of similar scope within the appropriate fields.
Replication
Numbers of biological replicates (usually n ≥ 3) are indicated in the figure captions. Key findings (non-NGS) were replicated in at least two independent experiments. NGS experiments were performed with biological replicates as indicated in the paper.
Randomization and blinding statements
Regular in vitro experiments were not randomized or blinded. High-throughput experiments and analyses were blinded by barcoded metadata. In vivo animal experiments were randomized and blinded by using coded cage/animal IDs.
Standard statistical analysis
Standard statistical analyses were performed using regular statistical methods. GraphPad Prism, Excel and R were used for all analyses. Different levels of statistical significance were accessed based on specific P values and type I error cut-offs (for example, 0.05, 0.01, 0.001 and 0.0001). Further details of statistical tests are provided in figure captions and/or Supplementary Information.
Reporting summary
Further information on research design is available in the Nature Portfolio Reporting Summary linked to this article.
Responses