Catalysing cooperation: the power of collective beliefs in structured populations
Introduction
Working together, or cooperation, is imperative for developing societies1,2,3. Even though cooperative behaviour yields the results desired from the group’s point of view, it is costly and risky for the individuals involved. Evolutionary game theory can be used to model and understand these instances4,5,6. This work focuses on a specific game, namely the stag hunt game7,8, and how it can be used to model trust. In the game, also known as the trust dilemma, cooperators can only succeed if they coordinate with other cooperators. Hence, cooperation is a reasonable option only if one trusts that the others will cooperate.
Trust is crucial to social and economic interactions9. It is foundational to exchanges and contracts—in an entirely rational population, entering any agreement is reasonable only if all parties believe that others will respect it. Establishing trust would not be difficult in a risk-free, mutually beneficial setting. However, the uncertainty about the actions of others often makes it difficult to achieve and maintain10. Hence, the trust problem usually involves some temptation to break it or risk not being reciprocated. We define trust as an individual’s conviction that a partner (or partners) will work with them towards a common goal11.
Not all individuals are as likely to interact with one another. Individuals are likelier to meet their family, neighbours or co-workers than strangers in a different city. To account for that, a network structure can be introduced12. The dynamics of evolutionary games played by spatially structured populations differ substantially from their well-mixed counterparts13,14. In particular, networks are shown to facilitate cooperation in games like the prisoner’s dilemma or the snowdrift game15,16,17,18,19,20. However, the stag hunt game, representing a different class of games focused on coordination and trust, has received less attention. Studies of the game dynamics on random networks show that structure can promote cooperation and trust21,22,23. In this work, we follow suit, considering the dynamics of the multiplayer stag hunt game in structured populations and examining the effects of particular network parameters in the presence of an additional layer of complexity brought by collective beliefs.
The participating individuals’ experiential histories, convictions and commitments shape their social interactions. Individual decisions are not always based solely on facts but are often biased by personal beliefs, preferences and constraints24. For example, opinions and decisions about vaccination can be induced not by scientific facts but rather by one’s emotions and anecdotal, non-reliable, persuasive storytelling. The beliefs may develop from events irrelevant to the current decision or spillover from past experiences25,26. Social norms can, however, stimulate coordination and cooperation in a population27,28,29. The introduction of money, an object with no physical worth but rather a value derived from a collective belief in its worth, allows for successful coordination within economies30. Collectively agreed-upon rules spread in the population via narratives and tales, like stories from Agta, a Filipino hunter-gatherer population, and promote moral behaviours31. The existence of non-moralising beliefs, or beliefs with no explicit instruction or morals behind them, cannot be explained by their direct effect. However, they may still act as a cooperation catalyst. This effect is significant when beliefs can spread evenly between individuals29. However, the effect of non-moralising collective beliefs on the dynamics on a structured population is rarely discussed. Hence, in this work, we study how network properties influence game dynamics in the presence of distinct beliefs.
Results
Takeover
Introducing a structure into a population often facilitates cooperation32,33. For multiplayer games, this effect is robust to evolutionary dynamics (birth-death or death-birth, pairwise comparison) or updating strategy (synchronous, asynchronous); hence, we only present results obtained for the birth-death process with synchronous strategy-updating32. However, we note that analysis of the interplay of beliefs and evolutionary dynamics could interest future work.
The simulation results presented in this work portray evolutionary dynamics with mutations in small finite populations. Hence, high levels of stochasticity are present, and all simulations result in the stag-hunting equilibrium for all types of networks. Therefore, our focus metric is the takeover time34,35. We define takeover as the first instance when all the individuals in the population are stag hunters. We measure the time in generations, which could also be easily represented in the number of birth-death events since each generation consists of exactly Z events. After the takeover, some hare hunters may appear due to mutations; however, they cannot takeover the population.
The introduction of structure can promote cooperation in the system due to the varying group size and network parameters. Hence, unsurprisingly, all simulations performed on the random graphs led to a faster stag hunter takeover than the well-mixed population. In particular, in the presence of only one belief (achieved by setting μB = 0.0), the takeover time in a well-mixed population is on average 7.2 times longer than on the Newman-Watts-Strogatz (NWS) and 3.4 times longer than in the Erdös and Rényi (ER) and Barabási-Albert (BA) networks. For higher values of belief mutation μB, the difference between the well-mixed and structured populations reduces but exists. Therefore, in our case, the network structures facilitate the spread of cooperative behaviour and trust.
In all explored regimes, introducing the second belief (μB ≠ 0.0) leads to faster stag hunter takeover, as shown in Fig. 1. Increasing the value of belief mutation rate μB from 0.0 to 0.01 decreases the average takeover time on all network types, with a similar reduction of around 65% for ER and BA and around 50% for the NWS. Thus, introducing the second narrative benefits the fast spread of cooperation and trust.
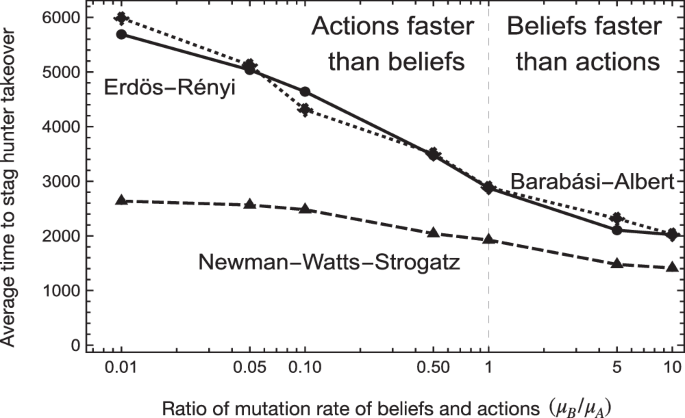
The level of action mutation (μA) is constant in all simulations. Hence, the mutation rate ratio change is caused by manipulating the belief mutation rate (μB). Increased belief mutation frequency leads to a lower takeover time, meaning higher belief diversity promotes a faster spread of cooperators in a population. The takeover is notably faster on the NWS networks, but the effect of belief is more pronounced on the ER and BA networks. The results are averaged over 1000 runs per network type and parameter set.
In the BA and ER network populations, the takeover happens slower than in the NWS networks for every considered parameter set. This result suggests that a higher clustering coefficient (0.44 for the NWS) in the network expedites the spread of cooperative behaviour more effectively, as compared to the lower values (0.23 and 0.31 for ER and BA, respectively)36,37. The Supplementary Material (Supplementary Fig. 8) presents the effect of clustering on takeover time. Although the low network diameter is also said to promote cooperative behaviour38, the effect is less pronounced. A relatively low diameter of 3.22 and 3.02 for ER and BA networks does not lead to a more effective cooperation spread than the NWS network, which is characterised by an average diameter of 3.61. In particular, for μB = 0.0 (only one belief present), the average takeover time on the ER network is comparable to BA and over 2.1 times longer than on the NWS network.
Hence, we hypothesise that the high clustering coefficient is more effective in promoting cooperation. However, the beneficial effect of beliefs is amplified more effectively by a lower network diameter, as indicated by the higher impact of change in belief mutation on the ER and BA networks compared to the less notable impact for the NWS network.
Hitherto, we assumed that the belief mutation assignment happened at random. Each individual had the same probability of changing their convictions. We acknowledge that, in practice, these assumptions can be violated; hence, this part of our model serves as a null expectation but helps focus on the network properties. The characteristics of network structures can be used to target specific individuals and further accelerate takeover times. In the following section, we analyse how introducing mutations on specific types of nodes of the network influences the dynamics.
Targeting belief spreaders
Not everyone is as likely to be introduced to a novel belief system as others. An individual’s characteristics can influence the probability of exposure to different worldviews or the propensity to internalise a new belief. Subsequently, the properties of an individual may also influence the probability of further spread of the novel belief. In particular, in a structured population, the connectivity of a node can be an essential factor in determining whether a belief mutation occurs and spreads.
Our model assumes that an externality causes the mutation in beliefs and is not easy to induce in principle. The origins of such beliefs and underlying processes are a vast topic in itself and beyond the scope of this study. However, the presence of beliefs promotes a faster spread of cooperative behaviour. Hence, we check whether it is possible to choose specific kinds of individuals to introduce the new beliefs such that the takeover time is reduced.
The concept of changing the properties of a node based on its connectivity is thoroughly explored in epidemiology. A degree of a node, interpreted as multiple social interactions, can be used to identify high-risk individuals39,40 to target them in vaccination campaigns. The importance of network hubs in epidemiology is apparent39,40. The influence of more connected individuals in a network can also be observed in the context of information spreading in social networks41. However, the involvement of hubs can also have the opposite impact. They can act as “firewalls” and prevent information from spreading42. Hence, it is beneficial to sometimes target the less connected “middle-class” nodes.
We use a degree-based scheme to choose the node for introducing the mutant43. The probability of being chosen is given by ({p}_{j}={e}^{alpha {k}_{j}}/{sum }_{iin N}{e}^{alpha {k}_{i}}) with ki being the degree of a vertex i. Parameter α controls the impact one’s connectivity has on its role. In particular, a positive value of α moves the belief mutation to the hubs, α = 0 is equivalent to randomly placing the mutant on any node, and α < 0 increases the probability of the mutation arising at the periphery.
Similarly to the random mutation allocation, all simulations for targeted mutation placement resulted in a stag hunt takeover. Varying values of α did not affect the overall average fraction of each strategy in the population; hence, we focus on its effect on the takeover times. We compare the takeover times relative to the random belief mutation placement (α = 0).
The effect of targeted belief mutation differs notably between different types of networks, as seen in Fig. 2. For the BA networks, there is a striking distinction between positive and negative values of α (a difference between targeting the hub or the periphery). For the lowest mutation rate μB = 10−5 on the BA network (depicted on the bottom panel of Fig. 2), the takeover times for all analysed values of α do not vary significantly and are shorter than the random case. However, as the mutation rate increases, the differences arise, with negative values of α leading to a similar takeover time as α = 0 and positive values leading to a slower takeover. Differences between parameter values are more visible as the mutation rate increases. This lack of notable differences between negative values of α and α = 0 can be caused by the fact that the periphery in the scale-free network is significantly larger than the hubs. Hence, if the mutation is introduced randomly, it is more likely to occur on a less connected node. This result indicates that targeting less influential (connected) individuals on the scale-free network accelerates takeover.
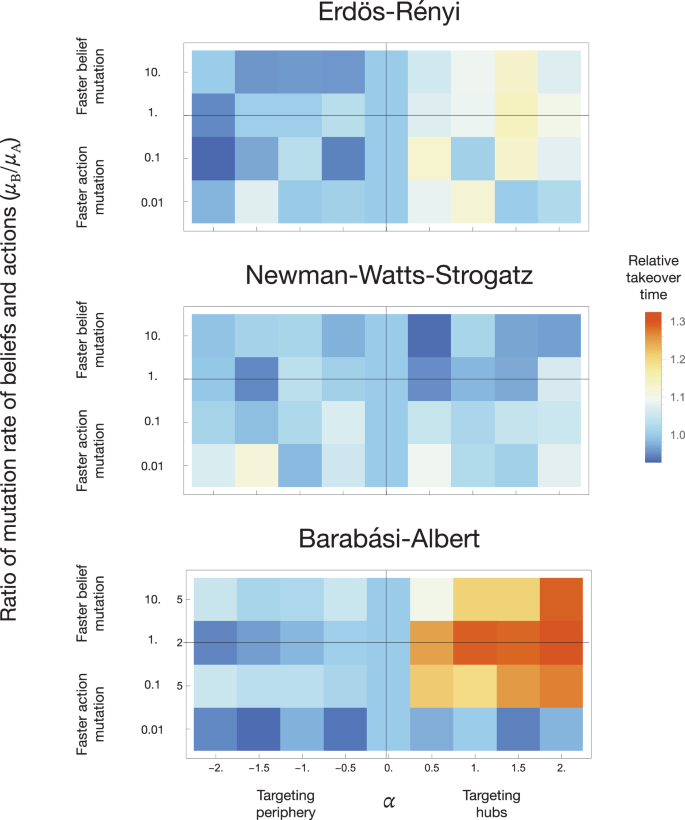
For each value of μA/μB, the time to takeover is compared to the case of random belief mutation placement (α = 0). The impact of varying parameter α is most visible on networks with high node degree heterogeneity (BA and ER) and negligible on the NWS network, characterised by high node degree homogeneity. Positive values of α lead to the targeting of hubs, which increases the takeover time. The time to takeover can be decreased by targeting the periphery (α < 0). The presented results are averaged over 1000 runs per network type and parameter set.
A similar effect is found on the ER network (the top panel of Fig. 2). The takeover times for higher mutation and negative values of α converge to values for random mutation placement and positive values of α lead to a slower takeover. The effect of changing the belief mutation rate value is less notable.
The introduction of targeted mutation has a different effect on the NWS network (middle panel of Fig. 2). As the degree distribution of nodes is not as divided as in the case of the scale-free network, different values of α do not affect the takeover times in such a diverse way. Almost all non-zero values of α lead to a lower takeover time for a low belief mutation probability. As the mutation value increases, the relative takeover time grows and oscillates around one.
Thus, the impact of targeted belief mutation depends highly on the network type and node degree distribution. We show that the most influential or connected individuals do not always induce a change in social behaviour in a structured population. However, a committed minority of regular individuals can alter social conventions. We thus delve deeper into how different network structures can impact the power of commoners.
Social tipping points
Theoretically, a committed minority can produce a “bandwagon” effect and cause a population-wide social change. The importance of the commitment to the cause, rather than the wealth and power of its supporters, is indicated in critical mass theory44. The threshold, which the minority group has to cross to ensure a successful change at the societal level, varies across the literature, ranging from 10% of the population up to 30% − 40%45,46,47,48. Among others, the value of the tipping point may depend on the underlying network structure of the population49.
We analyse our results to determine an average tipping point value (and standard deviations) for the network types used and three values of α = {−2.0, 0.0, 2.0} (Fig. 3). We assume a given fraction of stag hunters to be a tipping point if, after surpassing it for the first time, the proportion does not fall below it. In other words, the population did not reach the tipping point ever before and did not fall below it after crossing it.
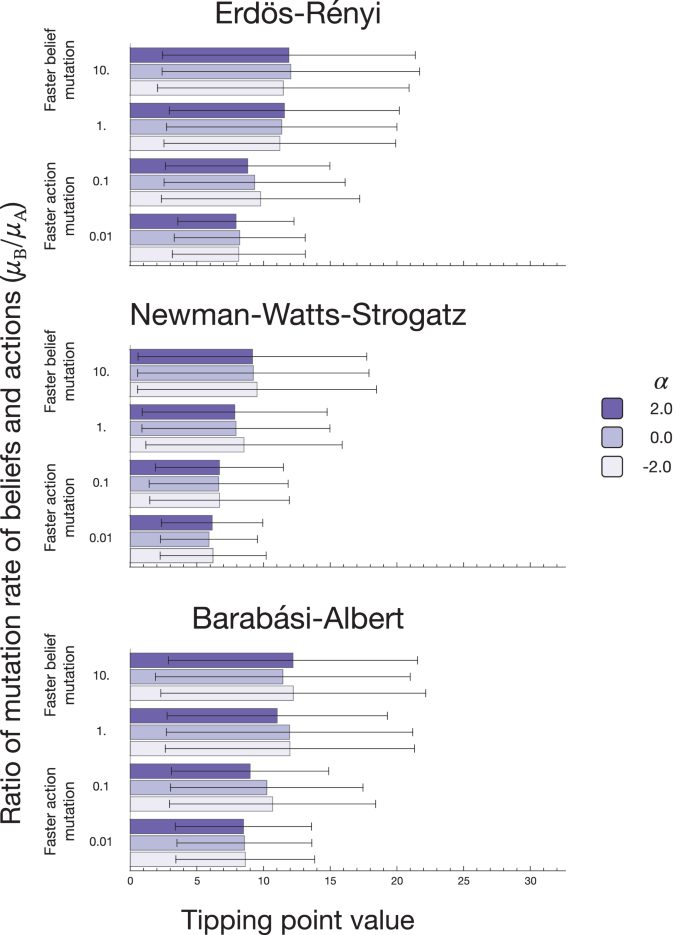
The coloured bars represent the average tipping point value, and the error bars represent the standard deviation. The tipping point values for the ER and BA networks are similar since both types of networks share similar values of parameters. The NWS network is characterised by a higher clustering coefficient, which leads to lower tipping point values. Increasing the value of the mutation rate introduces more stochasticity in the system and leads to a higher value of the average tipping point and a higher standard deviation value. The parameter α does not visibly affect social tipping points. The results are averaged over 1000 runs per network type and parameter set.
The belief mutation rate affects the tipping point’s average value prominently. Mean and standard deviation increased with increasing mutation rate on all considered network types; see Fig. 3. Thus, a competing minority can hinder the spread of a strategy. With a high mutation rate, a second novel strategy can show up in the population before the takeover by the previous invader. The appearance of the new mutant can slow down or even revert the growth of a desired strategy. Thus, the takeover must occur to ensure growth before a new contender can appear. With an increase in the mutation rate, only a larger group can takeover the population uninterrupted, leading to a higher value of the tipping point. Hence, we can conclude that in the absence of a competing group, a minority of around 15−30% has enough power to alter the social behaviour of the population. High mutation rates result in increased stochasticity and an increase in the standard deviation.
The value of the tipping point varies between the network types, with the value for small mutation and negative α being 19% for NWS and 25% and 28% for ER and BA, respectively. As shown in Fig. 1, the NWS network’s takeover time is shorter than other network types. Hence, a single mutant appearing on a network can takeover faster, reducing the possibility of another invader appearing and hindering the process. In this case, the effect of targeted belief spreading α is not drastic. The differences in values may be due to the stochasticity present in the system, and also, the parameter does not change the portion of new belief followers in the population.
We thus show that the type of underlying network structure can have a crucial impact on the tipping point value. We observe the tipping point value of 19% on networks with a high clustering coefficient. A lower clustering leads to a higher value of the tipping point of around 25−30%.
Discussion
Our study illuminates the role of collective beliefs in fostering cooperation and trust among self-interested, rational individuals29,50,51. Similar to influential tags or symbolic markers, these beliefs are unbound by specific actions, catalysing a swift spread of cooperative behaviours in structured populations. Our work proposes a framework for future research to explore the dynamic interplay between consensus mechanisms and network structure, including the pivotal role of charismatic leaders52, conformity dynamics and eventual impacts on actions. Gokhale et al.29 explored the importance of consensus-forming mechanisms such as frequency-dependent decision-making, majority vote and random narrative choice. While these various processes have the potential to change the outcome of the dynamics in this study, we have focused on the frequency-dependent (“Group Think”) mechanism53.
Structured populations are a hotbed for cooperation13,32,33. Networks allow cooperators to flock together and interact with one another, subsequently protecting them from being exploited by the defectors. Many parameters of real-life social networks, like the degree distribution, are said to sustain cooperative behaviour54,55. To determine the effects of specific network properties on the evolution of cooperation, we implement three classes of random networks. While random networks such as scale-free networks might not be an appropriate representation of empirically observed ones56, performing simulations on multiple random networks allows us to focus on general network properties rather than the effects of specific social structures. We show that specific network attributes like a higher clustering coefficient or low diameter are powerful accelerators for spreading cooperation and trust, mainly when high belief diversity exists. Thus, harnessing network structures and understanding their properties is necessary to propel the diffusion of desired behaviours. This concept, already applied successfully in targeted vaccination campaigns57,58,59, has profound implications, especially in scale-free networks60,61. In this context, the role of well-connected individuals, or “hubs,” is crucial40. Strategically targeting these hubs can amplify the dissemination of critical information, from marketing messages to disaster response updates41,62. However, this double-edged sword can impede the desired spread42. Introducing mutations on hubs can trigger cascading effects and propagate defectors18,63. Our simulations reveal that belief mutations on the network periphery are more effective in bolstering cooperation than targeting hubs. Remarkably, this phenomenon emerges only in networks with discernible hubs and periphery, suggesting a novel strategy: focusing on less influential individuals can be the key to fostering cooperation.
The impact of network structure on minority power is profound. Lower belief mutation values tip the scales, decreasing the average tipping point. In comparison, higher values may slow the takeover by a desired minority (Fig. 3). With this understanding of social network structure and individual belief systems, it may be possible to strategise to ignite social change for good. Introducing novel beliefs to less connected individuals proves to be a potent catalyst, expediting cooperation diffusion. This insight explains why the most impactful social change often emerges from grassroots movements64.
Methods
The problem of trust—the Stag Hunt
To formalise the problem of trust, we use the stag hunt game7. In the traditional form of the game, two hunters set out on a hunt to obtain food. Both players can choose to hunt either a stag or a hare. Hunting a stag is difficult and cannot be done alone; however, it yields a higher payoff than a hare. Hence, if both players coordinate on hunting a stag, each obtains a high payoff of PS. However, if only one of them hunts a stag, they get a payoff of 0, as the hunt is unsuccessful. Conversely, hunting a hare is easy and can be accomplished alone. Thus, the payoff of a hare hunter is always equal to PH, regardless of their partner’s decision. The payoff matrix of the game and the resulting game dynamics are represented in Fig. 4.
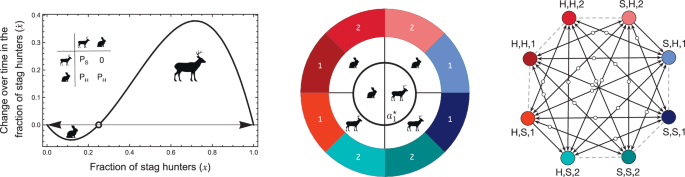
Left panel: in the classical two-player stag hunt game, two individuals decide to hunt for a stag or a hare. If both choose to hunt a stag together, they successfully hunt one. Hunting a stag brings a larger payoff than hunting a hare, but hare hunting does not require any coordination of actions and can be achieved alone. However, the players do not know their partner’s action preferences. In an infinite population, change in the fraction of stag hunters ((dot{x})) depends on the current value of x. If there are enough stag hunters in a population, hunting a stag is profitable. However, stag-hunting is not favoured if the fraction of stag hunters is low x < x*. The value of x at which the direction of the change shifts (the unstable internal equilibrium x*) is represented with an open dot. How do we convert a population of hare hunters to stag hunters? Introducing collective narratives provides a solution. Central panel: In the stag hunt with narratives, the strategy of each individual consists of three elements. The centremost layer (({a}_{1}^{* })) corresponds to the action taken by an individual when they find themselves in a group believing in narrative 1, the options being stag or hare. The middle layer (({a}_{2}^{* })) shows the two possible actions that can be taken in the group believing in narrative 2. The outermost layer (u*) depicts an individual’s two possible beliefs in narrative 1 or 2. A strategy is then represented as (({a}_{1}^{* },{a}_{2}^{* },u* )). Thus, in all, there can be eight strategies. Right panel: like the two-strategy outcome (left panel), the right panel shows the result of the eight-strategy case in an infinitely large, well-mixed population. White points represent the unstable equilibria. If two strategies have the same payoff when played against each other, the change in composition may happen by neutral drift—indicated by the grey dashed lines. Here, we see two paths from a hare hunting population ((H,H,1) or (H,H,2)) to stag-hunting. If an initial population consists of only (H,H,1) individuals, it may be taken over by (H,S,1) individuals by chance. From there, the dynamics would lead to a takeover of (H,S,2) individuals, and the population would end up drifting neutrally between the stag-hunting strategies without the possibility of reverting to hare hunting. A similar transition may also occur if first (H,H,2) and then (S,H,2) individuals takeover the initial population via drift. The plots are generated for N = 5, M = 4, PH = 1, PS = 4 with N = 2, M = 2 for the two-player case. The central and right panels have been adapted from Gokhale et al.29.
This work focuses on an N-player version of the stag hunt, as introduced by ref. 23. In particular, a hunting party consists of N individuals. Each one has an action of hunting a hare or a stag. Pursuing a hare brings a risk-free payoff of ΠH = PH to each hare hunter, where PH is the value of a hare. For a stag hunt to succeed, at least M stag hunters need to participate. Thus, if the number of stag hunters is less than M, then the hunt is unsuccessful, and the payoff of a stag hunter is ΠS = 0; else, a successful hunt yields ΠS = PS. The value of the caught quarry thus grows linearly with the number of participants in the hunt. This expansion of the 2-player stag hunt allows us to preserve an essential feature of the 2-player game—successful cooperation always brings a higher payoff than defection. This need not be the case in other versions of the game, which could lead to different interesting dynamics but are not considered in this work.
Similarly to the 2-player version of the game, in a population predominantly hunting hare, choosing a stag is risky—an individual is not guaranteed to assemble a hunting party consisting of enough other stag hunters. Only if a significant enough fraction of players hunt stag is it safe to choose the bigger prey. How does one overcome the initial risk of hunting stag in a fully hare hunting population to move to the more profitable endeavour of pursuing a stag?
A solution to the above dilemma is posited via the inclusion of collective narratives by Gokhale et al.29. The authors assume that each individual believes in narrative one (or two) personally, and the group believes in one of those narratives. The individuals then condition their actions on the narrative chosen by the group. Therefore, each player’s strategy consists of three elements:-
-
action taken by the individual when the group believes in narrative one
-
action taken by the individual when the group believes in narrative two and,
-
narrative the player personally believes in.
For example, a (H,S,1) player would hunt a hare if the hunting party believes in narrative one and a stag if the party believes in narrative two. The individual personally believes narrative one to be true. Thus, eight strategies can be present, as shown in Fig. 4.
Importantly, we do not make assumptions about the narratives’ contents. Beliefs held by individuals neither impact their payoffs nor the actions taken directly. Believing in either of the narratives does not make players prone to choose specific actions, and it does not give them additional payoff for choosing them. Still, introducing collective narratives leads to rich game dynamics, as shown in Fig. 4.
Different ways of determining the collective narrative can exist, such as groupthink53, majority vote65,66, dictatorship, charismatic individuals52 and so forth. In this model, hunters make decisions based on a frequency-dependent process. The choice of the narrative believed in by the group is random and depends on the composition of the hunting party. The probability of each of the narratives to be chosen is proportional to the fraction of the believers in the given narrative in the group.
Narratives can act as coordination devices, allowing stag-hunting to takeover the population29. Thus, the model explains how moral-free beliefs can influence game dynamics but assumes that the players interact within a well-mixed population.
In a realistic society, social ties, family connections or geographic closeness can cause specific individuals to interact more frequently than by chance. Similarly, organically formed hunting parties can be expected to include a different number of participants rather than be an artificially chosen, constant size. Varying group sizes can significantly impact the game dynamics67,68. The analysis of the effect of group size diversity on our game is presented in the Supplementary Material. Hence, the assumption of well-mixed populations cannot always be substantiated.
Structured populations
Random networks represent human societies more accurately than complete ones69. We implement three classes of random networks frequently considered in the literature to analyse the impact of particular network properties on evolutionary dynamics.
Erdös and Rényi70 proposed a random network to model real social networks. The Erdös-Rényi (ER) network is characterised by a high degree of homogeneity. It is formed by generating nv nodes and ne random edges connecting them.
Many social networks are said to have “small-world” properties71,72,73,74, meaning that any two individuals in the network can reach one another via a small number of links (steps). Hence, our analysis implements a small-world network generated by the Newman-Watts-Strogatz (NWS) algorithm75. In this algorithm, first, a d-dimensional lattice is generated. Then, a new edge is drawn for each vertex with probability p. An NWS network has a high clustering coefficient and a small average path length between any two vertices.
Furthermore, some members of society are typically more connected and, as a result, more influential than others. These individuals are represented by hubs—vertices of the network with a high degree. However, the majority of the population is not as well-connected. Such diversity within the individuals is not present in either of the networks mentioned above. Hence, we use a Barabási-Albert network (BA)76, with a power-law degree distribution. The Barabási-Albert algorithm is based on preferential attachment. A network grows at each time step by adding one node and connecting it to m nodes already present. The probability of a vertex being connected to the new one is proportional to the attachment function A(k), with k being the node’s degree. The attachment function ABA(k) ∝ k.
Differences in degree distribution between the three networks are presented in Fig. 5.
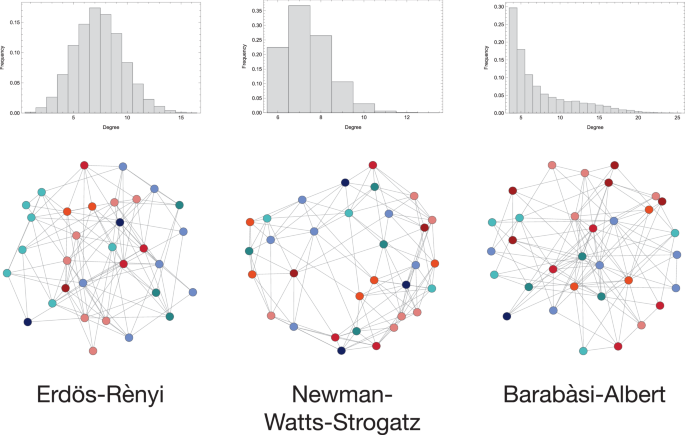
In the Erdös Rényi, the edges are generated randomly. The Newman-Watts-Strogatz graph is a small-world network. In the Barabási-Albert network, some vertices (hubs) are characterised by much higher connectivity as compared to the rest (periphery). For all graphs, Z = 32. The colours of the vertices represent strategies according to the scheme presented in Fig. 4. An analysis of varying network sizes from 32 to 252 is provided in the Supplementary Material (Supplementary Fig. 3).
For the results obtained for networks generated by different algorithms to be comparable, we keep the network size (Z = 32) constant. The parameters of the generating algorithms were chosen so that the networks would have a similar number of edges. First, the minimal connectivity of the BA network was selected to be equal to the stag-hunting threshold (m = M). By construction, all BA networks with the same minimal connectivity are characterised by the same number of edges, computed as m(m−1)/2 + (Z−m)m. Then, this value is used to parametrise the ER network (ne = m(m−1)/2 + (Z−m)m). Due to the random component of the NWS algorithm, it is not possible to set a given number of edges in the network. However, the expected number of edges can be computed as k(d+p) (or (d−1)(1+p) if d is odd). Hence, the probability of adding an edge p and initial lattice dimensionality d were chosen for the expected number of edges to equal the other networks. The parameters of interest of the networks are presented in Table 1.
The similarity in the network size and number of edges allows us to focus on the effects of the properties of interest, like the degree distribution, global clustering coefficient and diameter.
Updating actions and beliefs
A belief frequently involves a complex system of stories, values, orientation, perspective, and more77. Due to its complexity, it is unlikely to appear in society spontaneously at the same rate as new behaviours do. Individuals are far less likely to invent a new belief system or culture than explore novel behaviours78. Arguments can also be made in the opposite direction, and hence, we assume that actions and beliefs appear at different rates. Namely, we introduce two uncorrelated mutation rates—μA and μB. The former applying to actions taken by an individual (two first elements of the strategy) and the latter influencing the belief (the third element of the strategy). We assume that change in actions happens during reproduction, capturing the notion of offspring being prone to experiment and try actions different from those displayed by their parents. In this setup, a “mutation of actions” occurs at most once in an individual’s lifetime and can be seen as a cumulation of all the changes they have undergone. Simultaneously, we assume that a change in belief is more likely to happen in a later stage of life and is caused by a cultural externality. Hence, the “belief mutation” occurs independently from reproduction. Once appeared, actions and beliefs spread in the population in the same evolutionary process. Hence, we can use the ratio of the two mutation rates to proxy the timescale ratio between the action and belief propagation processes.
Interaction dynamics
Birth-death
Our model uses a birth-death Moran process79,80. Every generation consists of Z discrete time steps (Z corresponding to the population size) so that (on average) every individual has an opportunity to reproduce. In each time step, a belief mutation occurs with probability μB—a belief (the third element of the strategy) of a randomly chosen individual is set to one of the two existing beliefs, each with equal probability. Subsequently, the fitness of all individuals is determined. In each time step, one player reproduces with probability proportional to its fitness. The offspring is identical to the parent unless a mutation occurs (with probability μA). If a mutation occurs, actions (the first two-strategy elements) are drawn from four possibilities (H-H, S-H, H-S or S-S). Regardless of the action mutation, the offspring inherits the belief from the parent unchanged. One of the neighbouring individuals (or the parent itself) is randomly chosen to die and be replaced by the offspring. The schematic of the process is presented in Fig. 6.
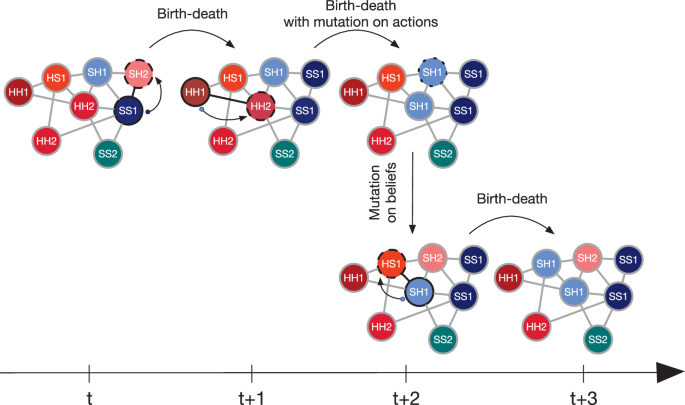
Strategies are updated by the birth-death process. An individual is chosen to reproduce (represented by a solid black outline on the figure) with probability proportional to their fitness. A neighbour of the reproducing individual is chosen randomly to die (indicated by a dashed black outline) and gets replaced by an identical offspring of the reproducing individual (as represented by an arrow and a small dot). In each step of the birth-death process, a mutation of actions might occur with probability μA. If a mutation occurs, the newly produced offspring has different actions than the parent but the same belief. A belief mutation can occur in each time step with probability μB. The belief of a randomly chosen individual (represented by a dotted black outline) is randomly set to one of the two beliefs present in the population.
Fitness
The fitness of an individual (ψi) depends on a payoff received after engaging in one hunting game with all its neighbours (Πi) and the selection intensity (ω)79 as ψi = 1 + ωΠi, where ΠH = PH and ΠS = PS if the hunt is successful and ΠS = 0 otherwise. The selection intensity can be used as a proxy for the importance of the hunt relative to other activities affecting one’s fitness. That is, for ω = 0, the game (and therefore one’s strategy) does not affect the fitness and increasing ω enhances the game’s impact on the fitness81. In the main text, we continue with ω = 1 while different values of selection intensity are further explored in the Supplementary Material (Supplementary Fig. 4).
Simulation parameters
The simulation results presented in this work were obtained for populations of size Z = 32. For computational ease, we choose a population size that could characterise a local hunter-gatherer residential group82, but large enough to examine differences in network properties. Results of simulations for varying population sizes are presented in the Supplementary Material (Supplementary Fig. 3).
We start with an egoistic population, everyone following the (H,H,1) strategy. Thus, they always hunt hares, and only belief one is present. Starting with a single belief allows us to analyse the effects of introducing the second belief. As mentioned above, three types of networks were implemented—Erdös-Rényi with 118 edges, Newman-Watts-Strogatz with initial lattice dimension d = 6 and probability of adding an edge p = 0.24 and Barabási-Albert with minimal connectivity of a node m = 4. The parameters and properties of the generated networks are specified in Table 1. Due to the random nature of the ER network, in a small proportion of the cases, individuals had fewer neighbours than necessary for the stag hunt to be successful (the number of neighbours never falling below 1). Despite some hunting parties being too small to support cooperation, the average results for these networks do not differ from the ones with only big enough groups. Further investigation of the issue is presented in the Supplementary Material. Additionally, we compare the results on random graphs with ones obtained in a well-mixed population, where individuals play the stag hunt game with 8 random players. At each time step, any two individuals can be chosen to reproduce and die. Each simulation lasts for a maximum of 5 × 10⁵ generations, where each generation consists of Z time steps. We use μA = 0.001, PH = 1, PS = 4, M = 4, ω = 1, Z = 32. For an exploration of some of these parameters, see the Supplementary Material. Ten networks were generated for each parameter set and network type, and 100 simulations were run on each. The results for each network type are thus averages over 1000 realisations.


Responses