CBX3 promotes multidrug resistance by suppressing ferroptosis in colorectal carcinoma via the CUL3/NRF2/GPX2 axis

Introduction
Colorectal cancer (CRC) is the third most common cancer and a leading cause of cancer-related deaths worldwide [1,2,3]. Resection and chemotherapy improve survival; however, many patients develop chemoresistance, often leading to disease recurrence [1, 2]. As chemoresistance leads to therapeutic failure in a subset of patients, identifying new mechanisms that circumvent chemoresistance is important to improving CRC therapy and patient survival.
CBX3 belongs to the mammalian heterochromatin protein 1 family, distributed in euchromatin and heterochromatin [4, 5]. Functionally, CBX3 is associated with actively transcribed gene regions and plays a role in efficient transcriptional elongation [4,5,6]. As a reader of H3K9me2/3, CBX3 serves as a binding platform for recruiting other histone modifiers, thus promoting DNA methylation and restraining the transcription of downstream genes [6,7,8]. Elevated levels of CBX3 have been observed in some types of cancers, such as prostate cancer, glioblastoma, and CRC [7, 9, 10]. CBX3 can promote cell growth, migration, and metastasis in solid tumors [7, 10, 11]. However, the role of CBX3 in chemoresistance remains unclear.
Ferroptosis is a regulated cell death characterized by iron-dependent lipid peroxidation-driven membrane destruction [12]. Ferroptosis depends on the convergence of iron, thiol, and lipid metabolic pathways, which have been implicated in many biological processes, including development, aging, immunity, and cancer [13, 14]. Ferroptosis is involved in chemoresistance in various cancers [15,16,17]. Reduced ferroptosis promotes chemoresistance to Oxaliplatin in CRC [16]. Targeted activation of ferroptosis overcomes acquired drug resistance [18]. However, the susceptibility of different types of cancer cells to ferroptosis varies significantly [19]. Importantly, the relationship between CBX3 and ferroptosis is unknown.
Nuclear factor erythroid 2-related factor 2 (NFE2L2, NRF2) plays a significant role in ferroptosis [20]. NRF2 is a critical transcription factor that regulates the cellular antioxidant response by enhancing the expression of antioxidant genes [21, 22]. In CRC, NRF2 inhibition increases sensitivity to chemotherapy by promoting ferroptosis [23]. However, whether NRF2 is implicated in CBX3-mediated carcinogenesis remains unclear.
This study aimed to examine the role and mechanisms of CBX3-mediated chemoresistance in CRC, investigate whether ferroptosis inhibition contributes to CBX3-mediated multidrug resistance, and verify whether NRF2 and its downstream genes are involved in this process. Our findings provide potential therapeutic approaches for CRC treatment that focus on modulating ferroptosis.
Materials and methods
Patients and specimens
Primary surgical specimens were collected from 40 patients (ages 40–73; average age, 58) clinically diagnosed with CRC by two pathologists at the Sir Run Run Hospital, Nanjing Medical University. All participants were invited to participate in the study. All experimental protocols were approved by the Human Ethics Committee of Sir Run Run Hospital, Nanjing Medical University (approval No. 2023-SR-67). This study conformed to the provisions of the 1975 Declaration of Helsinki. All donors provided written informed consent for the use of their samples in the research. The resected specimens were fixed in 10% neutral-buffered formalin and embedded in paraffin blocks. Two pathologists independently confirmed the diagnosis and histological grade of all cases using the World Health Organization classification.
Cell cultures and reagents
Human CRC cell lines (NCM460, SW480, HT29, SW620, and HCT116) and HEK-293T cells were obtained from the American Type Culture Collection (ATCC, Manassas, VA, USA). All the cells were recently authenticated and tested for mycoplasma contamination. CRC cells were cultured in Roswell Park Memorial Institute-1640 (RPMI-1640) medium supplemented with 10% fetal bovine serum (FBS), penicillin (100 U/mL), and streptomycin (100 μg/mL). HEK-293T cells were cultured in Dulbecco’s modified Eagle’s medium (DMEM) supplemented with 10% FBS, penicillin (100 U/mL), and streptomycin (100 μg/mL). All cell lines were maintained in a 37 °C incubator with 5% CO2. All media, including DMEM (11995040), DMEM/F12 (11320033), RPMI-1640 (11875085), and antibiotics (10378016), were obtained from Invitrogen (Carlsbad, CA, USA). FBS (A3520502) was obtained from Gibco (Carlsbad, CA, USA). MG132 was received from MedChemExpress (Shanghai, China). Irinotecan (HY-16562A), Ferrostatin-1 (Fer-1, 347174), RSL3 (1219810), Necrostatin (4311-88), Z-VAD-FMK (161401), and ML385 (846557) were acquired from MedChemExpress, LLC (Shanghai, China). Oxaliplatin (S1224) and 5-fluorouracil (5-FU, S1209) were sourced from Selleck Chemicals (Shanghai, China). STR profiling and mycoplasma contamination were performed regularly to maintain the authenticity of the cell lines.
Animals
All animals (female nude and NSG mice) were treated in accordance with the Institutional Animal Care and Use Committee guidelines at Nanjing Medical University (IACUC Issue No. 2207051). The animals were fed food and water ad libitum and housed at 22 °C with a 12-h light-dark cycle. The standard diet was provided by Xietong Biotechnology Co. Ltd. (Jiangsu, China). All animal experiments were conducted in accordance with the National Institutes of Health guidelines for the care and use of laboratory animals (NIH Publications No. 8023, revised 1978). All animal studies complied with the ARRIVE guidelines (PLoS Biol. 8(6), e1000412,2010).
Plasmid and siRNA transfections
A pCMV-based plasmid encoding human CBX3 and a pcDNA3-based plasmid encoding human NFE2L2 were obtained from the nonprofit plasmid repository, Addgene (Cambridge, MA, USA). The human CUL3 cDNA ORF cloning vector was acquired from SinoBiological Inc. (Beijing, China). PGL3-promoter-based plasmids encoding CUL3 and GPX2 promoters were procured from Beijing Tsingke Biotech Co., Ltd. (Beijing, China). SiRNAs, including NRF2 siRNA (h) sc-37030, CUL3 siRNA (h) sc-35130, and GPX2 siRNA (h) sc-62415, were acquired from Santa Cruz Biotechnology (Santa Cruz, CA, USA).
Cells (3 × 10⁵) were seeded and grown in 6-well culture plates for 24 h before transfection with the plasmids and siRNAs using Lipofectamine 3000 (Invitrogen, Carlsbad, CA, USA).
Lentiviral infection
Sequences encoding CBX3 and CUL3 were cloned from the corresponding plasmids. Both cDNAs were cloned into pLJM1 lentiviral vectors (Addgene; Palo Alto, CA, USA). To produce the virus, the plasmids were co-transfected into HEK-293T cells as directed by the manufacturer. To obtain a stable CBX3- or CUL3-overexpressed cell line, lentivirus-containing supernatants were harvested and used to infect the SW480 cells. CBX3-overexpressed SW480 cells (SW480-CBX3) were developed from SW480 cells, whereas CUL3-overexpressed cells (SW480-CBX3-CUL3) were developed from SW480-CBX3 cells.
Cell proliferation assays and drug sensitivity analyses
Cell counting and viability assays were performed to detect cell proliferation. Cells in 1 mL of medium were seeded (1 × 10⁵ cells/well) into 12-well plates. After 24 h, various drugs were added to each well. The cell number in each well was calculated on subsequent days by using the Millipore Scepter 3.0 Cell counter.
Cells in 100 μL of medium were seeded (1 × 10⁴ cells/well) into 96-well microtiter plates. After 24 h, various drugs were added to the wells at graded concentrations. Briefly, 5 mg/mL MTT was added to each well to detect cell viability. Cell viability was calculated based on the OD590 absorbance value. The half-maximal inhibitory concentration (IC50) values were determined using GraphPad Prism (version 7), which was calculated by fitting the curve with the OD value of each concentration dose.
Apoptosis assays
Following treatments, cells were digested and resuspended in phosphate-buffered saline (PBS). Subsequently, cells were stained with Annexin V and 7-AAD, and apoptosis status was determined by flow cytometry.
ROS assays
As directed by the manufacturer, a Reactive Oxygen Species (ROS) assay kit (Beyotime, S0033S, Shanghai, China) was used to measure intracellular ROS levels based on the formation of the fluorescent compound dichlorofluorescein (DCF) under the peroxide-dependent oxidation of DCFH-DA. A total of 5000 cells per well were seeded in 96-well plates and treated with specific drugs to promote cell attachment. Following treatment, 200 μL of DCFH-DA (10 μM) was added to each well after removing the drug-containing media and incubated at 37 °C for 20 min. The residual DCFH-DA was removed by washing the cells with a serum-free cell culture medium. Fluorescence intensity was determined using a multifunctional microplate reader.
MDA assays
MDA is the end product of lipid peroxidation. The MDA assay was conducted using the lipid peroxidation MDA assay kit (Beyotime, S0131, Shanghai, China), following manufacturer instructions. The samples and standards were prepared, and the OD value was measured at 532 nm. MDA concentrations are expressed as μmol/mg protein.
Glutathione and oxidized glutathione (GSH/GSSG) assays
A total of 5000 cells were seeded in 96-well plates, and various treatments were added to each well. GSH levels were evaluated using the GSH-Glo assay kit (Promega, V6912), following manufacturer instructions. To detect total glutathione (GSH + GSSG), the reducing agent tris(2-carboxyethyl) phosphine, which can reduce oxidized glutathione (GSSG), was used at a concentration of 500 μM following manufacturer guidelines. Each measurement was read using a multifunctional microplate reader.
RNA isolation and quantitative real-time PCR analysis
Total RNA was isolated using a TRIzol reagent following manufacturer instructions. Typically, 0.5 μg of total RNA was reverse-transcribed for each sample using the HiScript II Reverse Transcriptase Kit (Nanjing Vazyme Biotech Co., Ltd.). Real-time PCR analysis was performed using the Power SYBR Green PCR master mix (Roche Diagnostics, #04913914001, Indianapolis, IN, USA). Primers for CBX3, KEAP1, NRF2, CUL3, HO-1, SLC7A11, GPX4, GPX2, GSTA1, FTL, and β-actin were obtained from Tsingke Biotechnology Co., Ltd. (Beijing, China). The primer sequences are listed in Table 1.
Western blotting
The cells were treated with pharmacological agents at different time points and collected in a lysis buffer. Equal amounts of total proteins (20 μg) were separated by SDS-PAGE, deposited onto nitrocellulose membranes, and immunoblotted using appropriate antibodies. Immunoreactivity was detected using ECL and analyzed using the ImageJ software. The following antibodies were commercially obtained: Anti-NRF2 (#sc-365949) was procured from Santa Cruz Biotechnology; anti-CUL3 (#10450) was obtained from Cell Signaling Technology (Danvers, MA, USA); anti-CBX3 (#TA374324) was acquired from Origene (Cambridge, CB2 0AX, UK); anti-GPX2 (A15999) and Ki67 (A25399) were sourced from ABclonal Technology Co., Ltd.; anti-FTL (10727-1-AP), SLC7A11 (26864-1-AP), and GSTA1 (14475-1-AP) were attained from Proteintech Group, Inc. (Wuhan, China); anti-β-actin antibody was provided by Bioworld Technology (Atlanta, Georgia, 305, USA).
mRNA‑seq analysis
Total RNA samples from SW480-Con and SW480-CBX3 cells were extracted using TRIzol (Life Technologies, USA). After quality control with Nanodrop 2000, total RNA was temporarily stored at −80 °C before high-throughput mRNA sequencing was performed using the Illumina HiSeq 2500 system from Tsingke Biotechnology Co., Ltd. (Beijing, China).
Differential expression analysis of two groups was performed using the DESeq2 R package (1.26.0). DESeq2 provides statistical routines for determining differential expression in digital gene expression data using a model based on the negative binomial distribution. To control the false discovery rate, the resulting P values were adjusted using the Benjamini–Hochberg approach. Genes with an FDR < 0.05 identified by DESeq2 were classified as differentially expressed. Gene ontology enrichment analysis of differentially expressed genes (DEGs) was performed using the Goseq R packages based on the Wallenius non-central hyper-geometric distribution.
Co-immunoprecipitation (Co-IP)
The cells were lysed in NETN buffer (20 mM Tris, pH 8.0, 100 mM NaCl, 1 mM EDTA, and 0.5% NP-40). For all samples, 1000 μg of lysate was incubated with Protein G Sepharose beads, followed by the specified antibodies per manufacturer instructions. Immunoprecipitates were resolved by immunoblotting using the specified antibodies: anti-NRF2 (#ab62352), which was obtained from Abcam plc (Cambridge, CB2 0AX, UK), and anti-HA (#H3663), which was acquired from Sigma Chemical Co. (St. Louis, MO, USA).
Immunofluorescence assays
CRC cells (2 × 10⁵) were cultured in 6-well plates for 24 h, followed by various treatments. The cells were fixed with ice-cold methanol, permeabilized with 0.5% Triton X-100 in PBS, and incubated at 4 °C overnight with anti-Ki67 (Servicebio, Wuhan, China, GB13030-2, 1:100 dilution), anti-CBX3 (1:100 dilution) antibodies, anti-GPX2(ABclonal, Wuhan, China, #A15999, 1:50 dilution) or anti-FTL(ABclonal, Wuhan, China, #A11241, 1:50 dilution) antibodies. Antibody binding was localized using an FITC or Cy3.5-labeled secondary antibody. The cells were visualized using a Confocal Microscope (100×, 400×).
Fluorescent staining of live cells
Fluorescent labels were used according to the manufacturer’s instructions. BODIPY™ 581/591 C11 (MedChemExpress, Shanghai, China, #HY-D1301) was diluted to 10 μM and incubated for 10 minutes at 37 °C. ERTracker Blue-White (Invitrogen, Carlsbad, CA, USA, #E12353) was diluted to 1 μM in HBSS and incubated for 20 min at 37 °C. The cells were visualized using a Confocal Microscope (100×, 400×).
Transmission electron microscopy
Samples were cut into 1 mm3 and fixed in 2.5% glutaraldehyde in 0.1 M phosphate buffer (pH 7.4) for 2 h, postfixed in 1% osmium tetroxide (Ted Pella, GP18456) in the same buffer at 4 °C for 2 h, incubated in 2% uranyl acetate (SPI-CHEM, GZ02625) at 4 °C for 2 h, dehydrated in a graded series of ethanol (50%, 70%, 90%, 95%, and 100%), embedded in Epon812 resin (SPI-CHEM, GS02660). After polymerizing for 48 h at 60 °C, ultrathin sections were cut on an ultramicrotome (Leica, UC7), and stained with uranyl acetate and lead citrate. Image acquisition was performed by TEM (JEOL, JEM-1400 Flash) at an acceleration voltage of 120 kV.
Tumor xenograft models
Six-week-old female nude mice were injected in the flanks with 5 × 10⁶/0.1 mL of SW480-Con or SW480-CBX3 cells. Bi-dimensional tumor measurements were recorded every two days. Tumor volume (mm3) was calculated using the formula:
Where:
Irinotecan (50 mg/kg, twice a week) or Oxaliplatin (10 mg/kg/week) treatment was administered intraperitoneally when the tumor size in the SW480-CBX3 group reached 200 mm3. Subsequently, the mice were euthanized at the indicated time points, and the tumors were resected.
For patient-derived xenograft (PDX) model preparation, the clinical CRC samples were collected from the Center of Laboratory Animal Science, Nanchang University, China, which was approved by the Animal Use and Care Committees at Nanchang University (IACUC Issue No. RYE2023011901). The #440 sample was obtained from a 53-year-old male patient with medium-differentiated adenocarcinoma on the right side of the colon and liver metastasis.
NSG mice were anesthetized using an inhalation nose cone containing 1%–3% isoflurane. Tumor masses were sectioned into smaller fragments suitable for implantation into the flanks of the NSG mice. The tumors required 2–3 months to engraft in the donor mice. When the tumor masses reached a sufficient volume, they were extracted and treated with digestion reagents (1 mg/mL collagenase III and 0.25 mg/mL DNAse I, prepared in 2% FBS, DMEM/F12) to process fresh tumor tissues into single cells for injection.
All tumor cells were implanted into the female NSG mice. The mice were 6–8 weeks old at the time of implantation. The tumors were implanted subcutaneously into the right flank. The mice were grouped into six mouse cohorts and treated with various chemotherapies. On day 41, mice with 300 mm3 tumors were randomly assigned to treatment groups. The baseline tumor volume was established, and drug treatment was initiated 45 days after transplantation.
The in vivo response to treatment was assessed by comparing the percentage of tumor volume change (ΔVol) on the final study day (two days after the last treatment) with the baseline tumor volume. The criteria for response classification were based on the combination of the best and average responses, adapted from Gao et al. [24].
Step 1: Calculate the percent change in tumor volume for each animal using:
Step 2: Within each group, determine the minimum V (Vm)
Step 3: Within each group, determine the mean (average) V (Va)
Step 4: Determine the RECIST category as follows:
RECIST Category Best Response: Vm; Average Response: Va
Complete Response (CR): Vm < −95% and/or Va < −40%
Partial Response (PR): Vm < −50% and/or Va < −20%
Stable Disease (SD): Vm < 35% and/or Va < 30%
Progressive Disease (PD): Anything else
Mice were euthanized, tumor xenografts were removed, and specimens were fixed in 10% neutral-buffered formalin and embedded in paraffin blocks.
Immunohistochemical staining
Immunohistochemical analysis was performed on 4-µm sections of tumor blocks. Subsequently, the sections were treated with primary antibodies. The slides were stained with diaminobenzidine solution and counterstained with hematoxylin. The slices were photographed using a Nikon microscope and Image Pro Plus analysis system. Four high-power views (400×) were selected randomly from each sample. The integrated OD (IOD) level was estimated and is presented as mean ± SEM.
Dual-luciferase reporter assay
The dual-luciferase reporter assay system was obtained from Promega Corporation (Madison, WI, USA). Various promoter regions of CUL3 with potential CBX3 binding sites [25] and the promoter of GPX2 with NFR2 binding sites (antioxidant response element, ARE) were synthesized by Tsingke Biotechnology Co., Ltd. (Beijing, China). Luciferase reporter constructs containing the various promoter regions of CUL3 and the promoter of GPX2 were cloned into pGL3-promoter vectors. Luciferase activity was measured 24 h after transfection using the dual-luciferase reporter assay system. All experiments were performed in three independent replicates, each showing consistent results.
ChIP assay
ChIP assays were performed using a Thermo Scientific Pierce Agarose ChIP Kit (#26156, Carlsbad, California, USA), following manufacturer instructions. Chromatin was precipitated using nonspecific IgG antibodies or rabbit anti-CBX3 (Origene). Subsequently, DNA was extracted, and PCR was performed using primers for CUL3 promoter fragments containing the CBX3 binding domain. The primers used were as follows:
Forward primer: 5′-CTCCTCCTCCTTCTCCTCCT-3′
Reverse primer: 5′-TCCCACTTCCTTCAGTTCCC-3′
Bioinformatic analysis
The expression profiles and clinical information of colon cancer patients were retrieved from the TCGA database using the R package TCGAbiolinks. We performed Kaplan–Meier analysis and a log-rank test on the TCGA-COAD cohort using the R package survival, with results visualized through the R package survminer.
Additionally, we obtained the bigwig files for ATAC-seq (ENCFF624HRW), H3K9me3 (ENCFF063OHO), and CBX3 (ENCFF768ZFK) ChIP-seq data in HCT116 cells from the ENCODE database [26] and visualized them using IGV [27].
Statistical analysis
Spearman’s correlation analysis was used to investigate the co-expression between CBX3 and the genes involved in the intersection. Moreover, the overall survival or disease-free survival of CBX3 and NRF2 were analyzed using the Kaplan–Meier plotter in the TCGA database.
Other data are presented as mean (SEM). For unpaired samples, P values were calculated using a one-way analysis of variance or Student’s t-test with the GraphPad Prism software. The results were considered significant at P < 0.05.
Results
CBX3 improved multidrug resistance in CRC
To investigate the role of CBX3 in chemoresistance in CRC, CBX3 expression was analyzed in CRC using the TCGA database. Higher levels of CBX3 expression were associated with a poor prognosis in CRC (Fig. 1A). Moreover, CBX3 expression in CRC after chemotherapy was analyzed using the TCGA database. We found that 598 patients received chemotherapy and that higher levels of CBX3 expression were associated with poor Overall Survival (Fig. 1B). Patients after chemotherapy were classified into Non-Response (Progressive Disease) and Response (including complete response, partial response, and stable disease). CBX3 expression was significantly increased in the Non-Response group (Fig. 1C), suggesting that CBX3 overexpression may be associated with chemoresistance in CRC.

A Association of CBX3 with overall survival and disease-free survival in CRC from the TCGA database. B Association of CBX3 with disease-free survival in CRC after chemotherapy. C Analysis of CBX3 expression in CRC cases after chemotherapy, divided into non-Response and Response groups. D Representative immunohistochemical images of CRC tissue stained with anti-CBX3 and anti-Ki67 antibodies (low-power view 10×, high-power view 40×, scale bars = 50 μm). Spearman’s correlation analysis of CBX3 and Ki67 expression was shown. E Western blotting of various CRC cells. β-actin serves as an internal reference. Stable CBX3-overexpressed cells were SW480-CBX3, compared with SW480 WT cells (Con); whereas siCBX3 was transfected into HCT116 cells, compared with siNC. F Cell counting assays in SW480-Con/CBX3 and HCT116 siNC/siCBX3 cells with Irinotecan (1 μmol/L) and Oxaliplatin (0.5 μmol/L) treatments. Data were presented as the means ± SEM (N = 4). G Analysis of drug sensitivity in various SW480 and HCT116 cell lines after 48 h of treatment with the indicated drug concentrations. Data were presented as the means ± SEM (N = 5). *P < 0.05, **P < 0.01, compared to Con group with solvent treatment. Iri Irinotecan, Oxa Oxaliplatin.
Our previous studies have reported that CBX3 is highly expressed in CRC [28]. In the current study, CBX3 expression was positively associated with Ki67 expression (Fig. 1D), implying that CBX3 may increase cell proliferation and malignancy in patients with CRC. CBX3 protein levels were measured in various CRC cells using western blotting. Stable CBX3-overexpressed cells were developed using SW480 and HCT116 cells, whereas siCBX3 was transfected into CRC cells, to downregulate CBX3 expression (Figs. 1E and S.1A). The data of Ki67 IHC experiments showed that CBX3 increase cell proliferation in various CRC cell lines (Fig. S.1B). Subsequently, various CRC cell lines were treated with chemotherapy. CBX3 overexpression increased cell proliferation and resistance to Irinotecan and Oxaliplatin, the first-line treatments for CRC. Furthermore, CBX3 knockdown suppressed cell proliferation and reduced the IC50 values of Irinotecan and Oxaliplatin (Figs. 1F, G and S.1C, D). However, CBX3 exhibited a minimal effect on 5-FU resistance in SW480 cells (Fig. S.1E). These findings suggested that CBX3 improved multidrug resistance in CRC.
CBX3 promoted multidrug resistance by suppressing ferroptosis in CRC
Apoptosis assays were conducted after chemotherapy to investigate the mechanisms underlying CBX3-mediated chemoresistance using flow cytometry and western blotting. Our results showed that Irinotecan and Oxaliplatin treatment increased CRC apoptosis rates; however, CBX3 exhibited no effect on multidrug-mediated apoptosis (Figs. 2A and S.2A). Furthermore, neither the apoptosis inhibitor Z-VAD nor the necrosis inhibitor Necrostain reversed multidrug-mediated cell death in SW480-CBX3 cells (Fig. 2B). CBX3 appeared to improve chemoresistance in CRC in an apoptosis-independent manner.
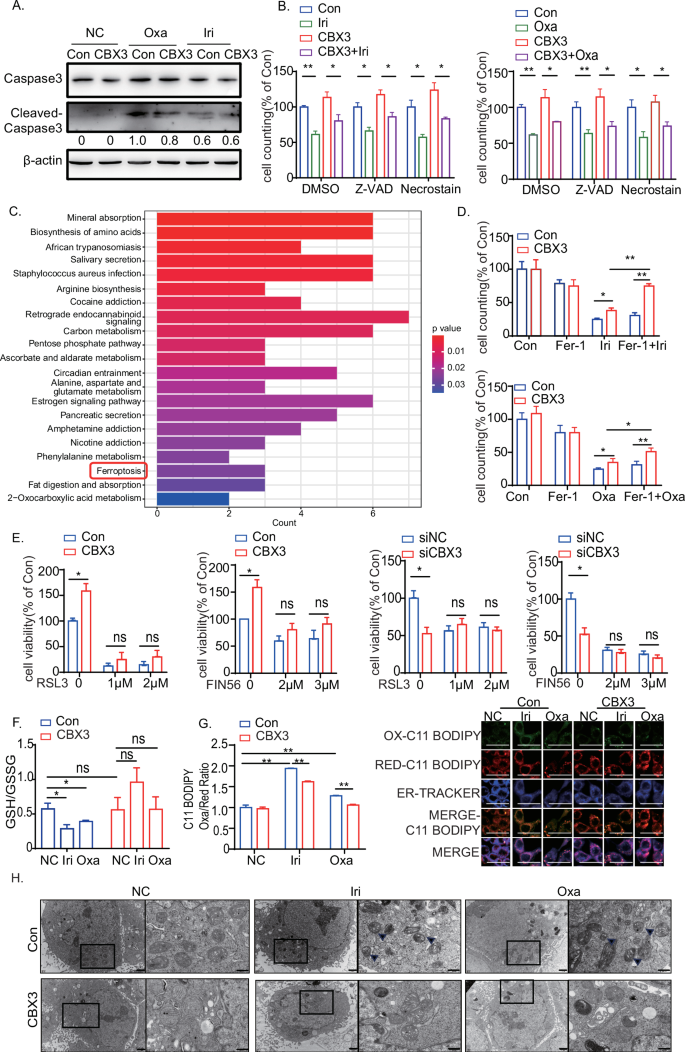
A Western blotting assays on caspase-3 and cleaved caspase-3 in SW480-Con/CBX3 cells following chemotherapy. β-Actin served as an internal reference. B Cell counting assays in SW480-Con/CBX3 cells with Z-VAD, Necrostain, and various chemotherapies. Data were presented as the means ± SEM (N = 4). C KEGG pathway enrichment analysis for CBX3-related gene expression in CRC cases from the TCGA database, divided into high and low CBX3 expression groups. D Cell counting assays in SW480-Con/CBX3 cells treated with ferroptosis inhibitor Fer-1 and various chemotherapies. Data were presented as the means ± SEM (N = 4). E MTT assays to detect cell viability in various SW480 or HCT116 cells after a 48-h treatment with the ferroptosis activators RSL3 and FIN56. Data were presented as the means ± SEM (N = 5). F GSH/GSSG assay in SW480-Con/CBX3 cells following chemotherapy. F GSH/GSSG assay in SW480-Con/CBX3 cells following chemotherapy. G Lipid peroxidation assays and the cellular location in CRC cells after chemotherapy. SW480-Con/CBX3 cells were treated with DMSO or drugs for 8 h and stained with C11 BODIPY (oxidized lipid was stained green) and then detected by both flow cytometry and confocal microscopy. ERTracker Blue-White was used to detect the location of lipid oxidation by confocal microscopy (high-power view 400×, scale bar = 50 μm) (N = 3). H Mitochondrial electron microscopy assays in SW480-Con/CBX3 cells following chemotherapy (left: lower power view, 10,000×, bar = 1 μm; right: high-power view, 30,000×, bar = 500 nm; arrows: damaged mitochondria). A–G Data were presented as the means ± SEM (N = 3). Con SW480-Con cells, CBX3 SW480-CBX3 cells, NC Solvent treatment, Iri Irinotecan, Oxa Oxaliplatin. *P < 0.05, **P < 0.01, compared to corresponding groups.
The Kyoto Encyclopedia of Genes and Genomes (KEGG) pathway enrichment analysis was performed for CBX3-regulated gene sets in CRC using the TCGA database. The samples were separated into two groups based on the mean expression level of CBX3. Differential expression analysis was performed between the CBX3-high and CBX3-low groups, with DEGs serving as input for KEGG analysis. The results showed that the ferroptosis pathway may be implicated in CBX3-mediated multidrug resistance (Fig. 2C). We investigated the relationship between CBX3 and several ferroptosis-related genes in CRC cases in the TCGA database [13, 29]. CBX3 mRNA level was positively correlated with the expression of ferroptosis-inhibiting genes, such as Glutathione Peroxidase 4 (GPX4), GPX2, and so on (Fig. S.2B). The findings suggest that the ferroptosis pathway may be suppressed in CBX3-mediated chemoresistance.
To investigate the role of ferroptosis in CBX3-mediated multidrug resistance, the ferroptosis inhibitor Fer-1 was added to CRC cells following Irinotecan and Oxaliplatin treatment. Our findings demonstrated that Fer-1 reversed the cell death caused by Irinotecan and Oxaliplatin treatment in SW480 and HCT116 cells (Fig. S.2C). Fer-1 increased CBX3-mediated cell survival after treatment with Irinotecan and Oxaliplatin; however, the ferroptosis activators RSL3 and FIN56 inhibited CBX3-mediated cell survival (Fig. 2D, E). CBX3 increased Glutathione (GSH) synthesis while decreasing ROS accumulation and MDA production after Irinotecan and Oxaliplatin treatment (Figs. 2F and S.2D). At the same time, ferroptosis was reported to result in lipid peroxidation of the endoplasmic reticulum (ER) [30]. In order to evaluate lipid peroxidation in various organelles, we detected the oxidized C11 BODIPY signal, and its location using ERTracker. C11 BODIPY oxidized signal had a significantly higher correlation with the ER initially for chemoresistance treatment at the initial stages of ferroptosis. However, CBX3 overexpression reversed peroxidation in ER mediated by chemoresistance (Fig. 2G). Furtherly, Mitochondrial electron microscopy experiments proved that multi-chemotreatments induced mitochondrial shrinkage, characterized by reduced mitochondrial volume, and increased density; while CBX3 overexpression attenuated the drugs-mediated mitochondrial damage (Fig. 2H). These data implied that CBX3 promoted multidrug resistance by suppressing the ferroptosis pathway. However, RSL3 or FIN56 treatments blocked CBX3 knockdown-mediated ferroptotic cell death (Fig. 2E). Since RSL3 and FIN56 inhibit GPX4 to trigger ferroptosis [31, 32], our findings suggest that CBX3 may suppress ferroptosis by regulating the GPX-related signaling pathway.
NRF2 was implicated in CBX3-mediated multidrug resistance and ferroptosis suppression
The mRNA sequence (mRNA‑seq) analysis was performed to investigate the mechanism of CBX3-suppressed ferroptosis in CRC chemoresistance. Our findings demonstrated that the NRF2 (NFE2L2) signaling pathway was enriched in oncogenic signatures in the SW480-CBX3 cells (Fig. 3A). Nuclear factor erythroid 2-related factor 2 (NFE2L2, NRF2) plays a significant role in ferroptosis [20]. NRF2 is highly expressed in CRC [23, 33]. Figure 3B depicts that NRF2 higher expression exhibited a tendency of poor prognosis in CRC in the TCGA database, and CBX3 promoted NRF2-signaling pathway activation in CRC in the CPTAC database. Furthermore, CBX3 expression was positively correlated with NRF2 expression in CRC tumor masses (Fig. 3C). These findings suggested that NRF2 was involved in CBX3-mediated CRC progression.
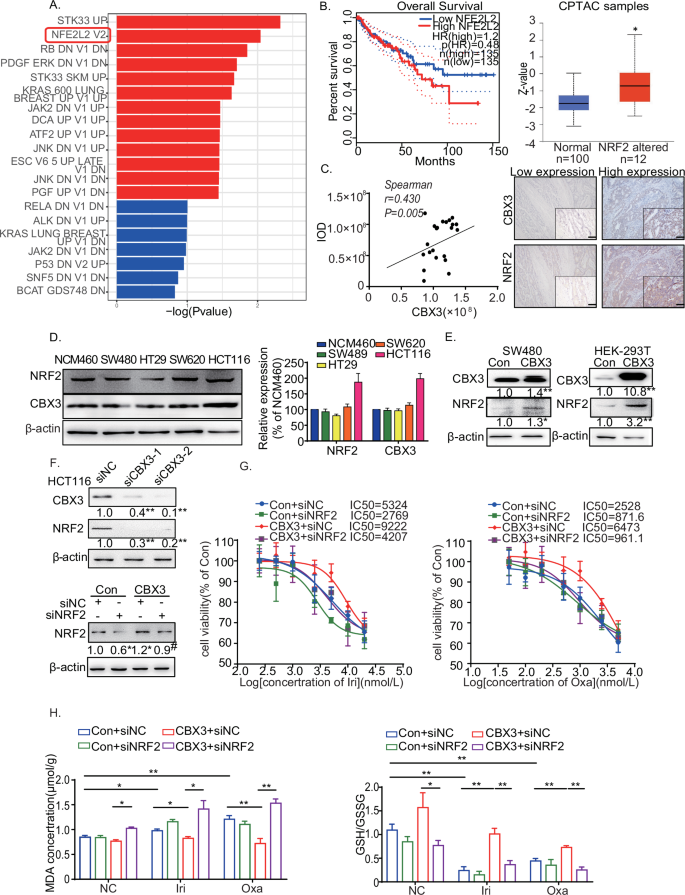
A RNA-sequence analysis of SW480-Con/CBX3 cells. NRF2-signaling pathway was enriched in oncogenic signatures. B Association of NRF2 with overall survival in CRC from the TCGA database. The expression of the NRF2-related pathway was analyzed in CRC cases using the CPTAC database. C Representative immunohistochemical images of CRC tissue stained with anti-CBX3 and anti-NRF2 antibodies (low-power view 10×, high-power view 40×, scale bars = 50 μm). Spearman’s correlation analysis of CBX3 and NRF2 expression is shown. D Western blotting of CBX3 and NRF2 in various CRC cells. E Western blotting of NRF2 in CBX3-overexpressed HEK-293T and SW480 cells. β-actin serves as an internal reference. F Western blotting of NRF2 in siCBX3-transfected HCT116 cells. β-actin serves as an internal reference. G Analysis of drug sensitivity in SW480-CBX3 cells with and without siNRF2 after treatment with the indicated drug concentrations. H GSH/GSSG and MDA assays in SW480-Con/CBX3 cells following chemotherapy. B–H Con: SW480-Con cells, CBX3: SW480-CBX3 cells. Data were presented as the means ± SEM (N = 3). *P < 0.05, **P < 0.01, compared to corresponding groups. # P < 0.05, compared to the previous group.
CBX3 and NRF2 protein levels were detected in multiple cell lines. CBX3 and NRF2 expression patterns were similar across the CRC cells (Fig. 3D). CBX3 increased NRF2 protein expression in SW480 and human embryonic kidney 293T (HEK-293T), whereas siCBX3 decreased NRF2 expression (Fig. 3E, F). Furthermore, NRF2 knockdown reversed the CBX3-mediated increase in IC50 after Irinotecan and Oxaliplatin treatment (Fig. 3G). Moreover, siNRF2 restored CBX3-suppressed MDA production and inhibited CBX3-upregulated GSH synthesis in chemoresistant cells (Fig. 3H). Our findings suggested that NRF2 was involved in CBX3-mediated multidrug resistance; CBX3 improved multidrug resistance in CRC by increasing NRF2 expression to suppress ferroptosis.
CBX3 increased NRF2 expression in CRC by inhibiting CUL3 transcription and CUL3-mediated NRF2 ubiquitination
To investigate the mechanisms of NRF2 overexpression in CBX3-mediated chemoresistance, NRF2 mRNA levels were measured using qRT-PCR. However, CBX3 overexpression exhibited no effect on NRF2 mRNA expression (Fig. 4A). It seemed that CBX3 increases NRF2 expression in a post-transcriptional manner.
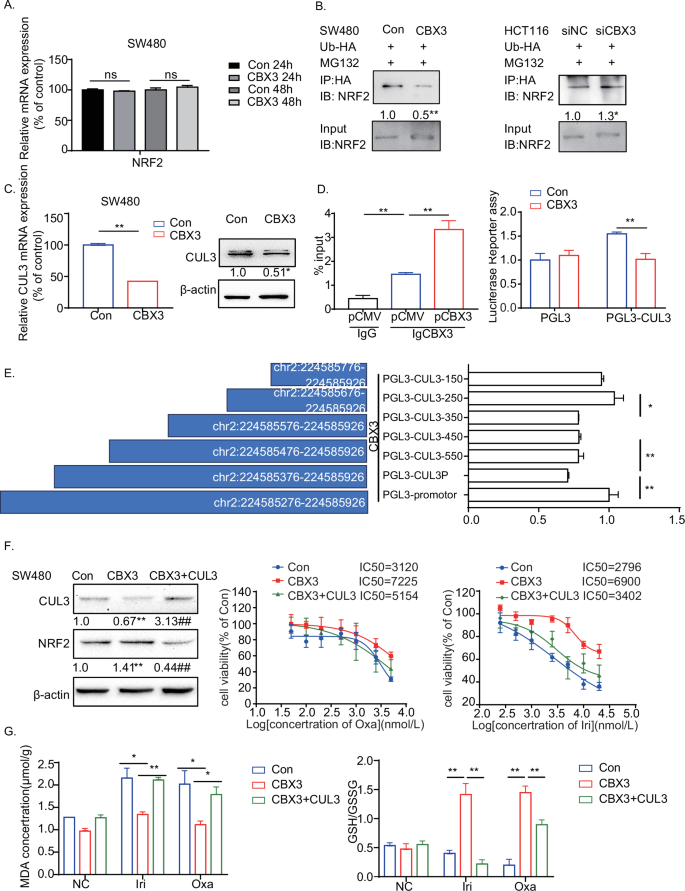
A qRT-PCR assays of NRF2 mRNA expression in SW480-Con/CBX3 cells. B Co-immunoprecipitation assays of NRF2 ubiquitination in CRC cells treated with siCBX3 and Ub-HA plasmids, followed by MG132 incubation. C qRT-PCR and western blotting to detect CUL3 mRNA and protein expression in SW480-Con/CBX3 cells. D ChIP and Luciferase reporter assays of CBX3 binding domain in the promoter of CUL3. HEK-293T cells were transfected with CBX3 plasmid, the cell lysates were incubated with CBX3 antibodies, and qRT-PCR was used to confirm the binding of CBX3 to the CUL3 promoter. Furthermore, firefly luciferase reporter assays were used to analyze the transcriptional activity of CUL3 in SW480-Con/CBX3 cells. E Firefly luciferase reporter assays to analyze the transcriptional activities of truncated CUL3 promoters (chr2:224585276–224585926) in HEK-293T cells with CBX3 overexpression. F Analysis of drug sensitivity in SW480-Con/CBX3 and SW480-CBX3-CUL3 cells after treatment with the indicated drug concentrations. Western blotting was used to detect CBX3 and NRF2 expression in SW480-Con/CBX3/CBX3-CUL3 cells. MTT assays were performed to detect cell viability. Data were presented as the means ± SEM (N = 5). G GSH/GSSG and MDA assays in SW480-Con/CBX3/CBX3-CUL3 cells following chemotherapy. A–E, G Con: SW480-Con cells, CBX3: SW480-CBX3 cells. CBX3 + CUL3: SW480 stably overexpressed CBX3 and CUL3. Data were presented as the means ± SEM (N = 3), *P < 0.05, **P < 0.01, compared with corresponding control groups.
To confirm the function of CBX3 in NRF2 expression, the ubiquitination assay was performed in CRC, as NRF2 expression is reduced by ubiquitination and degradation [34]. HA-tagged ubiquitin was transfected into CRC cells with CBX3 overexpression or knockdown. Subsequently, the cells were lysed for co-IP analysis. CBX3 overexpression significantly reduced NRF2 ubiquitination, whereas siCBX3 increased NRF2 ubiquitination (Fig. 4B), suggesting that CBX3 increased NRF2 expression by decreasing ubiquitination.
NRF2 mainly binds to Kelch-like ECH-associated protein 1 (KEAP1) and one of the substrate adapter proteins of the E3 ubiquitin ligase complex, Cullin3 (CUL3), to form an E3 ubiquitin ligase complex, which subjects NRF2 to rapid proteasomal degradation in the cytoplasm [34]. To determine whether KEAP1 or CUL3 was involved in CBX3-regulated NRF2, we assessed the mRNA levels of KEAP1 and CUL3 after CBX3 regulation. KEAP1 mRNA levels seemed to exhibit no effect on this process (Fig. S.3A). However, CBX3 overexpression decreased CUL3 in both mRNA and protein levels, whereas siCBX3 increased it (Figs. 4C and S.3B). These findings suggested that CBX3 increased NRF2 expression by inhibiting CUL3 transcription.
To further understand the regulatory mechanism of CBX3, we downloaded the results of CBX3 Chromatin immunoprecipitation (ChIP)-seq in HCT116 and K562 cell lines [25]. Both ChIP-seq data indicated that CBX3 is bound to the CUL3 promoter (Fig. S.3C). The ChIP-qPCR results revealed that CBX3 was enriched at chr2:224585276–224585926 in the CUL3 proximal promoter regions. Moreover, in HCT116 cells, CBX3 was found to associate with several H3K9me3-marked regions within or near the promoter of CUL3, indicating its role as a reader of histone H3K9 methylation in specific genomic contexts. Notably, CBX3 demonstrated stronger binding in open chromatin regions (Fig. S.3C), implying its involvement in the regulation of gene transcription. To determine the regulatory effect of CBX3 on the activity of the CUL3 promoter, the dual-luciferase reporter gene assay was performed. Figure 4D depicts that the promoter activity of CUL3 was significantly reduced in CBX3-overexpressed CRC cells.
To examine the interaction between CBX3 and CUL3 promoters, we constructed luciferase reporter plasmids encoding DNA sequences of different lengths from the sites of chr2:224585276–224585926. All plasmids were co-transfected with the pCMV-CBX3 plasmid into HEK-293T cells. Luciferase reporter assays revealed that the CBX3 and CUL3 promoters bound strongly at chr2:224585576–224585676 (100 bp) and weakly at chr2:224585276–224585476 (200 bp) (Fig. 4E). These results indicated that CBX3 transcriptionally silenced CUL3 expression by directly binding to its promoter to stabilize NRF2.
To assess the role of CUL3 in CBX3-mediated chemoresistance, CUL3-overexpressed cells (SW480-CBX3-CUL3) were developed based on SW480-CBX3 cells. CUL3 overexpression not only inhibited CBX3-upregulated NRF2 expression but also reversed CBX3-mediated chemoresistance to Irinotecan and Oxaliplatin (Fig. 4F). Additionally, CUL3 restored the CBX3-suppressed MDA production and inhibited CBX3-mediated GSH synthesis (Fig. 4G). Our results demonstrated that CBX3-suppressed ferroptosis by inhibiting CUL3 transcription and CUL3-mediated NRF2 ubiquitination, contributing to chemoresistance in CRC.
GPX2 was downstream of the CBX3-mediated NRF2-signaling pathway in CRC chemoresistance
We identified the downstream CBX3/NRF2-signaling pathway that suppressed ferroptosis. Western blotting assays, qRT-PCR, and Immunofluorescence assays have shown that CBX3 increased the mRNA and protein expressions of several ferroptosis-related genes in the NRF2-signaling pathway, including GPX2 and FTL (Figs. 5A and S.4). However, siNRF2 decreased GPX2 and FTL expressions. Furthermore, siNRF2 reversed the CBX3-upregulated GPX2 and FTL expressions (Fig. 5B). As ferroptosis activator experiments suggested that GPXs signal pathway may be involved in CBX3-mediated ferroptosis suppression, we focus on GPX2 as the main downstream of CBX3/CUL3/NRF2 signal pathway.
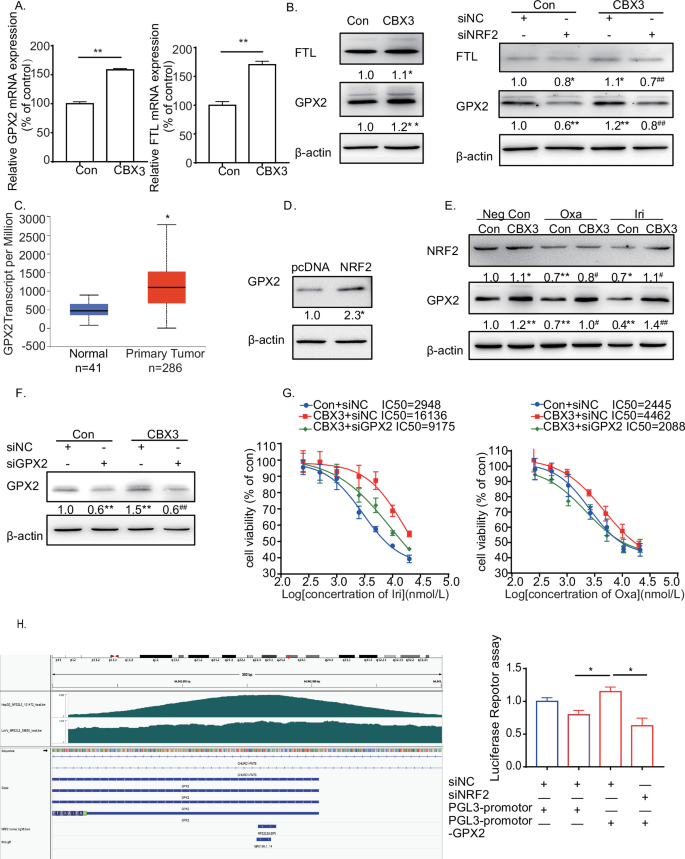
A qRT-PCR assays of GPX2 and FTL mRNA expression in SW480-Con/CBX3. B Western blotting to detect the expression of GPX2 and FTL in SW480-Con/CBX3 with and without NRF2 knockdown. C Analysis of GPX2 mRNA expression levels in CRC from the TCGA database. D Western blotting to detect the expression of GPX2 in SW480 cells with and without NRF2 overexpression. E Western blotting to detect the expression of NRF2 and GPX2 in SW480-Con/CBX3 cells with various chemotherapies. F Analysis of drug sensitivity in SW480-Con/CBX3 cells after treatment with the indicated drug concentrations. Western blotting was used to detect the effect of GPX2 knockdown in SW480-Con/CBX3 cells. MTT assays were performed to detect cell viability. G Analysis of GPX2 promoter. The promoter sequences from −2 K to +1 K bp relative to the targeted TSS were scanned using FIMO (reference: https://meme-suite.org/meme/doc/cite.html) to search for the NFE2L2 motif (MA0150.1), which was obtained from the JASPAR database. H Firefly luciferase reporter assays to analyze the transcriptional activities of GPX2 promoter in SW480-Con/CBX3 cells with and without NRF2 knockdown. A–H Con: SW480-Con cells, CBX3: SW480-CBX3 cells. Data were presented as the means ± SEM (N = 3). *P < 0.05, **P < 0.01, compared with corresponding control groups. #P < 0.05, ##P < 0.01, compared with their previous groups.
GPX2 promotes tumor progression and development in various cancers [35, 36], and most importantly, it shares similar functions with GPX4 [37]. We discovered that GPX2 was highly expressed in CRC tissues in the TCGA database (Fig. 5C), and NRF2 increased GPX2 expression in CRC cells (Fig. 5D). Furthermore, Irinotecan and Oxaliplatin treatment decreased both NRF2 and GPX2 expressions. Conversely, CBX3 overexpression partially restored chemotherapy-downregulated NRF2 and GPX2 expressions (Fig. 5E). IC50 assays showed that siGPX2 reversed CBX3-mediated chemoresistance to Irinotecan and Oxaliplatin (Fig. 5F, G). Our findings suggested that GPX2 may be involved in CBX3/NRF2-signaling pathway-mediated chemoresistance.
NRF2 triggers the transcription of multiple ferroptosis-related genes by binding to the ARE domain of their promoters [20,21,22]. Considering this, we obtained bigwig files for NFE2L ChIP-seq from the ENCODE project and visualized them using the IGV tool. The GPX2 promoter contains many ARE domains. To confirm whether the CBX3/NRF2 pathway was responsible for GPX2 transcription, we constructed luciferase reporter plasmids with ARE domains in the GPX2 promoter. The plasmids were transfected into the SW480-Con and SW480-CBX3 cells. Luciferase reporter assays revealed that CBX3 overexpression increased GPX2 transcriptional activities, whereas NRF2 knockdown significantly reduced CBX3-mediated transcriptional activities (Fig. 5H).
Collectively, these findings demonstrate that CBX3 elevates NRF2-mediated transcription of GPX2, eventually contributing to chemoresistance in CRC.
CBX3/NRF2/GPX2 pathway promoted multidrug resistance in CRC in vivo
To investigate the effects of the CBX3/NRF2/GPX2 pathway on multidrug resistance in vivo, we established tumor xenografts in nude mice by subcutaneously implanting SW480-Con or SW480-CBX3 cells. Analysis of the implanted tumor xenografts revealed that mice with SW480-CBX3 exhibited highly evident tumor growth. Irinotecan treatment significantly suppressed tumor growth, whereas CBX3 overexpression partially reversed Irinotecan-suppressed tumor growth (Fig. 6A). Western blotting revealed that Irinotecan treatment suppressed NRF2 and GPX2 expressions, whereas NRF2 expression was greatly increased in SW480-CBX3 tumors. Furthermore, CBX3 reversed Irinotecan-mediated downregulation of NRF2 expression. Additionally, CBX3 completely blocked Irinotecan-downregulated GPX2 expression (Fig. 6B).
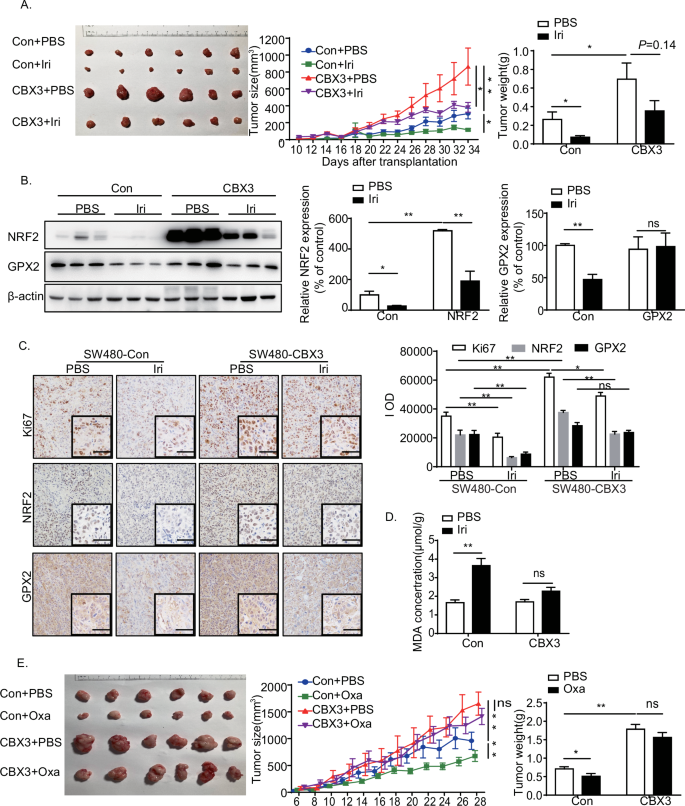
A CBX3 overexpression increased Irinotecan resistance in CRC in vivo. Representative images of tumors, tumor size, and weight were obtained 10 days after the initial tumor cell injection (n = 6). Tumors were measured every two days, and the tumor volumes were calculated. The tumors were excised and weighed 34 days after injection, and representative images of tumors were displayed (bar = 10 mm). B Western blotting to detect the expression of NRF2 and GPX2 in SW480-Con/CBX3 tumor masses with or without Irinotecan treatment. C Immunohistochemical staining of tumor tissues with antibodies against Ki67, NRF2, and GPX2 (low-power view 100×, high-power view 400×, scale bar = 50 μm). D MDA assays in SW480-Con/CBX3 tumor masses with and without chemotherapy. E CBX3 overexpression increases Oxaliplatin resistance in CRC in vivo. Representative images of tumors, tumor size, and weight were obtained at the indicated time point after the initial tumor cell injection (n = 6). Tumors were measured every two days, and the tumor volumes were calculated. The tumors were excised and weighed 28 days after injection, and representative images of tumors were displayed (bar = 10 mm). A–E Con: SW480-Con cells transplantation tumor masses, CBX3: SW480-CBX3 cells transplantation tumor masses. Data were presented as the means ± SEM, *P < 0.05, **P < 0.01, compared with corresponding control groups.
Immunochemistry assays revealed that CBX3 overexpression significantly increased Ki67 expression, which is implicated in cancer cell proliferation. Irinotecan-suppressed Ki67 expression in the SW480-Con group. Conversely, CBX3 overexpression promoted tumor resistance to Irinotecan. Furthermore, Irinotecan treatment significantly decreased NRF2 and GPX2 expressions, which were restored by CBX3 overexpression. Simultaneously, Irinotecan treatment increased MDA production, which was reversed by CBX3 overexpression (Fig. 6C).
However, qRT-PCR experiments showed that Irinotecan treatment increased both CUL3 and NRF2 mRNA expression, while decreased GPX2 mRNA expression (Fig. S.5). It seemed that chemotherapy-induced CUL3 upregulation contributed to NRF2 degradation, and then GPX2 downregulation. On the contrary, CBX3 overexpression reversed chemotherapy-induced CUL3 upregulation that enhanced NRF2 protein stability and GPX2 transcription level.
Similar findings were observed in the SW480-Con/CBX3 groups, with and without Oxaliplatin treatment. CBX3 overexpression not only promoted chemoresistance to Oxaliplatin in vivo but also inhibited Oxaliplatin-mediated NRF2 and GPX2 downregulation. Similarly, CBX3 reversed Oxaliplatin-mediated MDA production in CRC (Fig. S.5).
To investigate the mechanisms of CBX3-mediated chemoresistance, four new PDXs were established from four patients, and immunohistochemistry assays were performed to detect the expression of CBX3, NRF2, and GPX2. The #440 PDX sample was selected for the subsequent analysis because it fully expressed the CBX3/NRF2/GPX2 signaling pathway (Fig. 7A).
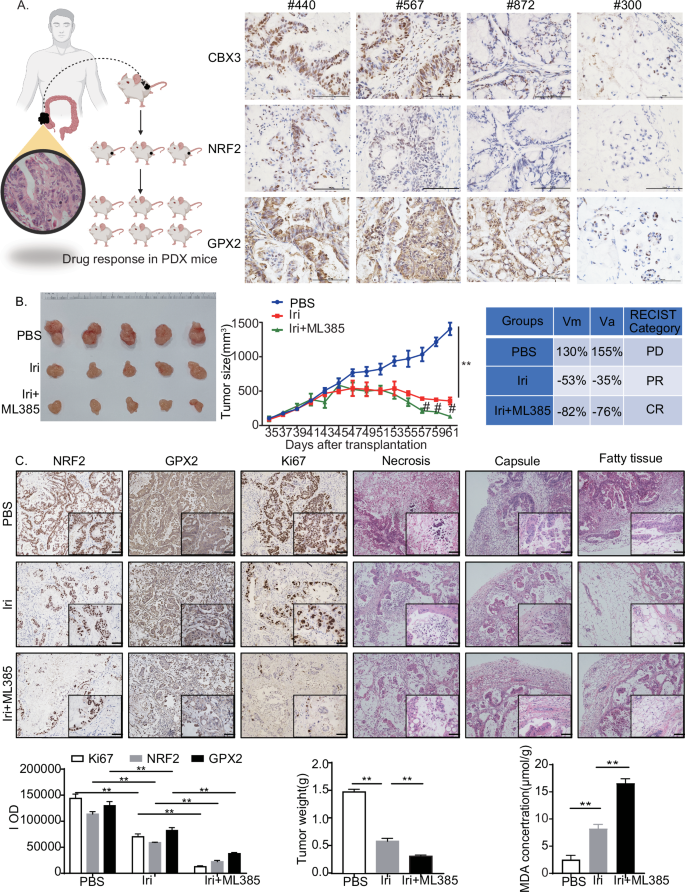
A Immunohistochemistry staining of tumor masses from four PDX samples with CBX3, NRF2, and GPX2 antibodies (low-power view 100×, high-power view 400×, scale bars = 50 μm). B Effects of CBX3/NRF2/GPX2 signaling on irinotecan resistance in the PDX #440 model. Representative images of tumors and tumor sizes were obtained at the indicated time points or 35 days after the initial tumor cell injection (n = 5). Tumors were measured every two days, and the tumor volumes were calculated. Irinotecan (50 mg/kg/day) was administered from day 45 to day 59. ML385 (30 mg/kg/day) was administered from days 52 to 59. The tumors were excised and weighed 61 days after injection, and representative images of tumors were displayed (bar = 10 mm). The in vivo response to treatment was assessed based on the protocol in “Materials and Methods”. C Immunohistochemical staining of tumor masses after chemotherapy with NRF2, GPX2, and Ki67 antibodies. HE staining of tumor tissues shows different degrees of necrosis and tumor in adjacent tissues (low-power view 100×, high-power view 400×, scale bars = 50 μm). Tumors were excised and weighed 61 days after injection. MDA assays were conducted in tumor masses with or without chemotherapy A–C Con: solvent treatment. Data were presented as the means ± SEM, **P < 0.01, compared with corresponding control groups. #P < 0.05, compared with Irinotecan-treated groups.
To evaluate the response to chemotherapy, #440 PDX samples were separated into cohorts and treated with Irinotecan with and without ML385, a potent NRF2 inhibitor. Irinotecan treatment resulted in a partial response, whereas ML385 increased tumor sensitivity to Irinotecan, resulting in a complete response in vivo (Fig. 7B). Additionally, the PDX masses invaded the tumor capsule and surrounding fatty tissue, and resulted in necrosis. The Irinotecan treatment prevented the invasion of fatty tissue but exhibited little effect on capsule invasion. The combined use of ML385 and Irinotecan prevented malignant invasion into the capsule and fatty tissue, and reduced necrosis incidence. Moreover, Irinotecan treatment inhibited cell proliferation and invasion and reduced NRF2 and GPX2 expression in PDX tumor masses. Furthermore, ML385 increased the Irinotecan-induced suppression of NRF2 and GPX2 expression and increased MDA production (Fig. 7C). At the same time, qRT-PCR experiments showed that Irinotecan treatment increased both CUL3 and NRF2 mRNA expression in PDX #440, while decreased GPX2 mRNA expression; More importantly, ML385 aggravated Irinotecan-suppressed GPX2 mRNA level, which consistent with the results of animal experiments (Fig. S.5).
These findings strongly suggested that CBX3 promoted multidrug resistance in CRC by increasing NRF2 and GPX2 expression and suppressing ferroptosis.
Discussion
CRC is one of the most common cancers and a leading cause of cancer-related deaths worldwide [1,2,3]. Chemotherapy is routinely administered to patients who have undergone surgical treatment to prevent CRC recurrence or metastasis. However, chemoresistance remains a major hurdle for many patients and is a significant cause of treatment failure [23, 38]. To understand the mechanism of chemoresistance, we demonstrated that CBX3 expression is associated with multidrug resistance by regulating ferroptosis in CRC cells.
CBX3 is an epigenetic regulator that modulates the gene expression of downstream targets via chromatin modifications [4,5,6]. Higher expression of CBX3 promotes cell proliferation, metastasis, and angiogenesis in various cancers [7,8,9,10]. Recently, deacetylated CBX3 was reported to promote multiple myeloma drug resistance by increasing protein stability [39]. Additionally, CBX3 modulates colon inflammation and drug resistance in CRC under IFNγ stimulation [40]. It was reported that CBX3 improved colon inflammation and inflammation-associated cancer by inhibiting STAT1/PD-L1 transcription, which pays more attention to the impact of colitis and tumor microenvironment on tumor drug resistance, while our studies focus on the effects of CBX3 on the parenchyma of CRC after chemotherapy.
Using the TCGA database, we discovered that higher expression of CBX3 was positively correlated with chemoresistance and poor survival in CRC. CBX3 overexpression increased resistance to Irinotecan and Oxaliplatin treatments in vitro and in vivo, whereas CBX3 inhibition suppressed cell growth and increased sensitivity to multidrugs. However, CBX3 exhibited a minimal effect on 5-FU resistance. These results suggest that CBX3 may exhibit protective roles which do not affect DNA replication in CRC, since these three drugs share similar anti-oncogenic roles in DNA replication [16, 39, 41]. The following studies showed that CBX3 may improve multidrug resistance not by abating apoptosis or necrosis but by alleviating ferroptosis, a new role of CBX3 in CRC progression.
Ferroptosis is implicated in the chemoresistance of cancer cells [15, 17, 29]. It is a non-apoptotic cell death characterized by lipid ROS accumulation, iron dependency, lipid peroxidation, and GSH depletion [12, 16]. Our findings revealed that CBX3 overexpression exhibited no effect on the basal levels of ROS or MDA in the cytoplasm; however, it decreased ROS, MDA production, and mitochondrial damages induced by multidrug treatment, and increased GSH synthesis. Conversely, CBX3 knockdown increased ROS and MDA production and decreased GSH synthesis. Furthermore, ferroptosis activators inhibited CBX3-mediated cell proliferation. Thus, CBX3 may play a crucial role in multidrug resistance by suppressing ferroptosis.
Ferroptosis is implicated in many biological contexts owing to the multiple signaling pathways regulating or harnessing ferroptosis [13, 29]. RNA sequencing and bioinformatics assays revealed that NRF2 is potentially downstream of CBX3, suggesting that NRF2 may correlate with CBX3-mediated ferroptosis suppression. The NRF2 pathway in cancer cells drives cancer progression, metastasis, and chemoresistance [21, 22, 42]. NRF2 inhibits ferroptosis in various cancer cells by promoting GSH synthesis and reducing ROS production [23, 43]. In this study, CBX3 increased NRF2 expression in vitro and in vivo. Contrarily, siCBX3 reduced NRF2 protein expression. Moreover, CBX3 reversed the multidrug-downregulated NRF2 expression. Additionally, NRF2 knockdown inhibited CBX3-mediated multidrug resistance and ferroptosis suppression. These findings indicated that CBX3 promoted multidrug resistance by increasing NRF2 expression to suppress ferroptosis. However, the mechanism by which CBX3 upregulates NRF2 expression remains unknown.
To further understand the mechanism of NRF2 overexpression in CBX3-mediated chemoresistance, ubiquitination of NRF2 expression was measured after treatment of CBX3 overexpression. CBX3 increased NRF2 expression by reducing its ubiquitination rather than increasing its mRNA levels. In general, NRF2 is degraded by the KEAP1-NRF2-CUL3 E3 ubiquitin ligase complex [34]. Bioinformatic assays and qRT-PCR experiments identified CUL3, not KEAP1, as a potential target of CBX3. CUL3 is an E3 ubiquitin ligase that regulates protein homeostasis during physiological processes and cancer development [44,45,46]. However, the role and mechanism of CUL3 in chemoresistance remain unclear. We hypothesized that by targeting CUL3, CBX3 may suppress NRF2 degradation to promote multidrug resistance.
In our study, CBX3 decreased CUL3 mRNA and protein expression, whereas CUL3 overexpression reversed the CBX3-upregulated NRF2 expression. CUL3 overexpression inhibited CBX3-mediated multidrug resistance and suppressed ferroptosis. Furthermore, the ChIP assay results revealed that CBX3 overexpression increased its direct binding to the CUL3 promoter; however, the luciferase reporter assay clarified the suppressive role of CBX3 on CUL3 transcription, suggesting that CBX3-upregulated NRF2 expression by inhibiting CUL3 transcription and preventing CUL3-induced NRF2 degradation.
NRF2 activation promotes tumor chemoresistance by upregulating the expression of various downstream antioxidant signaling proteins [20, 23]. To identify the genes that play a vital role in CBX3/NRF2 pathway-modulated ferroptosis and chemoresistance, the mRNA levels of several genes that act downstream of NRF2 and ferroptosis-related genes were measured [13, 14, 29]. GPX2 was identified as a potential target of the NRF2 pathway. The GPXs family comprises the main oxidoreductases that use glutathione as a reducing agent in scavenging lipid peroxidation products [47]. Eight GPXs exist [37, 47]. Loss of some GPXs can trigger apoptosis, necroptosis, pyroptosis, or parthanatos, which mediate or accelerate developmental defects, tissue damage, and sterile inflammation [46]. The NRF2-GPX4 pathway increases resistance to Oxaliplatin by promoting ferroptosis and pyroptosis in CRC [23]. However, the relationship between CBX3 and GPXs remains unknown.
GPX2 is a member of the GPX family, which exists in the epithelia of the gastrointestinal tract [48]. As the first line of defense against oxidative stress from food or intestinal flora, GPX2 uses selenocysteine as the active center to catalyze the reduction of hydrogen peroxide or organic hydroperoxides to water or the corresponding alcohols, thereby reducing their toxicity and maintaining redox balance [37, 48]. GPX2 levels may serve as a prognostic biomarker for cancer progression in the colon, breast, prostate, and liver [37]. GPX2 increases cell proliferation, invasion, and metastasis in solid tumors [35, 36]. Furthermore, GPX2 is a downstream target of NRF2 [33] and is considered a potential target for overcoming chemoresistance [38, 49]. Moreover, the effects of GPX2 on ferroptosis are widely demonstrated. GPX2 inhibits cyclooxygenase-2 (COX-2)-mediated migration and invasion in CRC by suppressing COX-2 expression [50]. GPX2 methylation status is negatively correlated with ferritin expression [33]. Our findings revealed that CBX3 enhanced GPX2 transcription by activating the NRF2 pathway and that CBX3 reversed multidrug-reduced GPX2 expression in vitro and in vivo. Additionally, siGPX2 inhibited CBX3-mediated chemoresistance. Collectively, these findings demonstrated that CBX3 upregulated the NRF2/GPX2 signaling pathway, eventually contributing to chemoresistance and ferroptosis suppression in CRC.
Conclusion
Our findings revealed that the CBX3/NRF2/GPX2 pathway is upregulated in patients with CRC exhibiting multidrug resistance. These findings indicate that CBX3 suppresses CUL3 transcription in CRC cells by directly binding to the corresponding domain in its promoter. CBX3 increases NRF2 expression by reducing CUL3 transcription and CUL3-mediated NRF2 ubiquitination. Furthermore, CBX3/NRF2 inhibits ferroptosis in chemoresistant CRC cells by increasing GPX2 transcription. Our findings provide new insights into the molecular mechanism of chemoresistance, which could be used to develop new therapeutic strategies for CRC treatment in the future.

Responses