Cell-autonomous innate immunity by proteasome-derived defence peptides
Main
Protein degradation by cellular proteasomes is fundamental to the dynamic regulation of the proteome, affecting essentially every aspect of cell biology, including the intricate processes of immune regulation. Dysfunction in proteasome activity has been implicated in various diseases, including cancer3, autoimmunity, inflammation, neurodegeneration and infectious diseases4,5,6,7. Some of these pathologies are driven by aberrations in the processing or presentation of antigens on major histocompatibility complex class I molecules (MHCI), which are mediated by proteasomal degradation8,9,10,11. Furthermore, protein degradation plays a key part in eliciting immune signalling and immune cell differentiation processes12,13,14,15. Specifically, proteasomes were shown to drive the degradation of inhibitory proteins (IκBs) and the activation of the nuclear factor kappa B (NF-κB) pathway16. In a few cases, products of the proteasome serve as biologically active protein fragments after partial degradation. For example, the transcription regulators NF-κB, Spt23p, Mga2p and Epe1 are translated as precursors before being activated by partial degradation in the proteasome17,18. However, beyond antigen presentation, cellular responses were studied mainly in the context of the degradation of specific substrates rather than what the role of protein-degradation products is. Thus, it is unclear whether degradation products have additional functions in immune regulation.
Our study expands the current knowledge by revealing a previously unrecognized and fundamental role for proteasome-cleaved peptides as constitutive antimicrobial peptides (AMPs), contributing to the innate immune response. One major, evolutionarily conserved defence mechanism is the production and secretion of AMPs19. AMPs are naturally occurring molecules found in various organisms, including humans, that have a crucial role in the innate immune response against pathogens. Notably, AMPs are synthesized by a wide range of cells and tissues throughout the body, including epithelial cells, leukocytes and mucosal surfaces, and are present in various body fluids, such as saliva, sweat and tears. Many AMPs are initially produced as inactive precursors called pro-AMPs, and their activation requires enzymatic processing, often involving proteases. Such AMPs have broad-spectrum antimicrobial activity against bacteria, fungi, viruses and even some parasites. They work by disrupting microbial cell membranes directly (for example, cationic host defence peptides20), modulating host transcription and translation21, or by modifying immune responses by altering cytokine and chemokine secretion22. Studies over the past few years revealed numerous host-derived and commensal-derived AMPs, expanding our understanding of the dynamic regulation of the host defence system.
Here we found that proteasome-derived peptides provide a cell-autonomous defence mechanism against bacterial infection. We further show that such peptides, which we collectively termed proteasome-derived defence peptides (PDDPs), are constitutively made, and their production may be enhanced upon bacterial infection, by altering proteasomal composition and function. The altered proteasome function is governed by the recruitment of a regulatory subunit of the proteasome, PSME3. In turn, PSME3-capped proteasomes promote tryptic-like peptide cleavage, enhancing the generation of peptides with cationic termini. Proteome-wide computational analysis of proteasomal cleavage uncovers the potential extent of this phenomenon, revealing that most proteins in the proteome contain putative PDDPs that could be made after protein degradation across different tissues. Our study discusses a previously unrecognized role of proteasomal degradation in facilitating the generation of defence peptides after protein breakdown, as a previously undescribed mechanism in innate immunity.
Proteasomes drive antimicrobial defence
Although many AMPs are canonically encoded and translated as intact functional entities, numerous AMPs are embedded in protein sequences, requiring further post-translational processing for their maturation. Whereas thousands of AMPs have been identified across various organisms, systematic analysis of their presence in the human proteome is only just starting23. To examine the prevalence of AMPs that are contained in human proteins, we compared a list of experimentally validated AMPs, from different species, with the human proteome (Supplementary Table 1). We found 308 putative unique AMPs, contained in 273 proteins in the human proteome, sharing identical sequences with previously reported peptides that have antimicrobial activity (Fig. 1a and Extended Data Fig. 1a). When we examined the conservation of the AMP sequence across orthologues and compared it with other regions in the host protein, we found that 28.5% of the putative AMPs were more conserved than other regions in the protein (28 out of 98 for which data were available; Fig. 1a and Supplementary Table 1), suggesting a potential stabilizing selection for their functional role in antimicrobial defence. AMP-containing proteins included proteins such as histones and transcription factors as well as numerous proteins with non-immune-related functions (Extended Data Fig. 1b,c). Notably, these proteins exhibited diverse tissue specificities, with some expressed predominantly in one or two tissue types. For instance, we identified SERPIND1 in the liver, a protein not previously reported to have antimicrobial activity in humans24. Furthermore, we observed proteins containing AMPs that are widely expressed (for example, Hox genes; Extended Data Fig. 1d). Some of the best-studied AMPs were highly expressed in immune-related and secretory tissues such as bone marrow, tonsil, testis, salivary gland and the small intestine (for example, CAMP, defensins; Extended Data Fig. 1e). Importantly, the positions of putative human AMPs were located predominantly in a structured region and their accessibility was slightly reduced compared with all other areas of the protein (Fig. 1b,c and Extended Data Fig. 1f), indicating that such AMPs may not be readily clipped without prior protein unfolding or degradation. Together, these data suggest that protein degradation, through cellular proteasomes, may offer a previously undescribed mechanism for the maturation of AMPs.
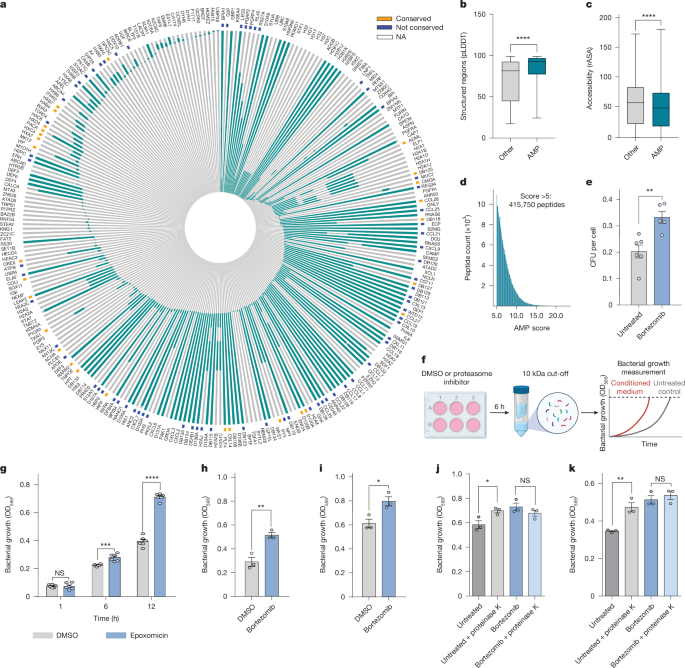
a, AMP sequences (green) in host proteins (grey). Conserved AMPs are indicated in orange, whereas those without conservation data are labelled as NA. b,c, Comparison of predicted amino-acid local-distance difference test (pLDDT) scores (b) and relative solvent-accessible surface area (rASA) (c) in putative AMPs compared with other regions of the same proteins. U-test, ****P < 0.0001. d, Distribution of peptides predicted by in silico proteasomal cleavage of the human proteome, showing only those scoring >5 on the basis of AMP biochemical characteristics. e, CFU count of intracellular S. typhimurium infection of A549 cells treated with bortezomib (50 nM) or untreated, normalized to the cell count. Data are mean ± s.e.m. (n = 6 biological replicates). Unpaired two-tailed Student’s t-test, **P = 0.004. f, Bacterial growth in conditioned medium (<10 kDa). OD, optical density. Diagram of the equipment in f was created with BioRender.com (https://BioRender.com/x10a923). g–i, Growth of S. enterica in medium from HCT116 (h) or A549 (g,i) cells treated with DMSO (control), epoxomicin (1 μM, concentrated medium ×2; g) or bortezomib (50 nM; h,i) for 6 h. Data are mean ± s.e.m. (n = 3 biological replicates). Unpaired two-tailed t-test: NS, P = 0.96, ***P = 0.0007, ****P < 0.0001 (g); **P = 0.0066 (h); *P = 0.0248 (i). j,k, Growth of S. enterica in medium from A549 (j) or HCT116 (k) cells treated with or without bortezomib and followed by proteinase K (1 μg ml–1) for 6 h. Data are mean ± s.e.m. (n = 3 biological replicates). One-way ANOVA: NS, P = 0.38, *P = 0.033 (j); NS, P = 0.675; **P = 0.0038 (k).
To explore the capacity of protein degradation to yield protective peptides, we artificially cleaved the human proteome using predictive proteasomal cleavage sites. In silico digestion of the human proteome generated a comprehensive database containing approximately 34 million peptides (see Methods). As AMPs are known to act extracellularly25, we searched for predicted proteasomal-cleaved peptides in public peptidomics data sets of biological fluids (Supplementary Table 2). We found between 15% and 27% of the peptides detected in various biological fluids to be identical to those predicted by the in silico cleavage (Extended Data Fig. 1g), suggesting that proteasomal-cleaved peptides may be secreted to the extracellular milieu. Next, we implemented a scoring metric26, based on the peptide charge, cationic and hydrophobic residues and length, to assess the propensity of the peptide to present membranal disruption and antimicrobial activity (Extended Data Fig. 1h). Peptides with a score above 5, the mean score of the validated AMPs, were defined as putative PDDPs. We found that hundreds of thousands of the resultant peptides (from the in silico digestion) display biochemical AMP characteristics, compromising approximately 1.2% of the peptide pool (Fig. 1d). The peptide generation rate by proteasomes is at an estimated rate of millions of peptides per minute27,28, thereby providing the cells with an enormous potential number of protective peptides at a basal state.
To test the hypothesis that putative AMPs are generated after the degradation of cellular proteins, we infected cells with the intracellular Gram-negative bacterium Salmonella typhimurium, with or without prior inhibition of the proteasome. After proteasome inhibition, we observed an increase in intracellular bacterial infection as assessed by colony-forming units (CFU) count (Fig. 1e). Subsequently, to evaluate the influence of proteasomal inhibition on AMP generation and potential secretion, we examined the antimicrobial activity of the peptide pool (<10 kDa fraction) that was secreted by cells into the extracellular environment (Fig. 1f). We tested the growth of Salmonella enterica in the conditioned medium and observed enhanced bacterial growth after proteasomal inhibition (Fig. 1g–i). To ascertain that the observed bacterial growth inhibition resulted from peptide activity rather than other molecules, such as secreted metabolites, we treated conditioned medium with proteinase K, a protease known to efficiently cleave peptides. Proteinase K treatment abolished the observed effect confirming that the attenuated bacterial growth was due to the peptidic component in the conditioned medium (Fig. 1j,k).
Recombinant PDDPs exhibit antimicrobial activity
Mass spectrometry analysis of proteasome-cleaved peptides (MAPP)12 is uniquely designed to capture a snapshot of the active degradation landscape (Fig. 2a). Specifically, it enables the identification of the degradation products in or near the proteasome barrel, through immunoprecipitation of proteasomes, followed by the elution of the naturally cleaved protein fragments. To explore the potential downstream functions of MAPP-identified peptides, we examined degradation products from different cell types and across different conditions (Supplementary Table 3) and found several examples of previously reported AMPs (for example, histatin 3; Fig. 2b, Extended Data Fig. 2a and Supplementary Table 4). Most of the AMPs characterized to date are cationic hydrophobic peptides that are typically 10–50 amino acids in length29—similar to the length distribution of the MAPP peptides (Extended Data Fig. 2b). Furthermore, we detected MAPP-identified peptides in the extracellular peptidomic data sets of biological fluids mentioned above (between 1.5% and 6% of peptides were identical; Extended Data Fig. 2c and Supplementary Table 2). Notably, to validate the secretion of proteasome-cleaved peptides, we performed peptidomics analysis of the secretome collected from A549 cells. When we compared the MAPP and secretome peptides, we identified 110 peptides (11%) that were identical and 383 (40%) that were contained in MAPP peptides, which may indicate further processing (Fig. 2c and Supplementary Table 5).
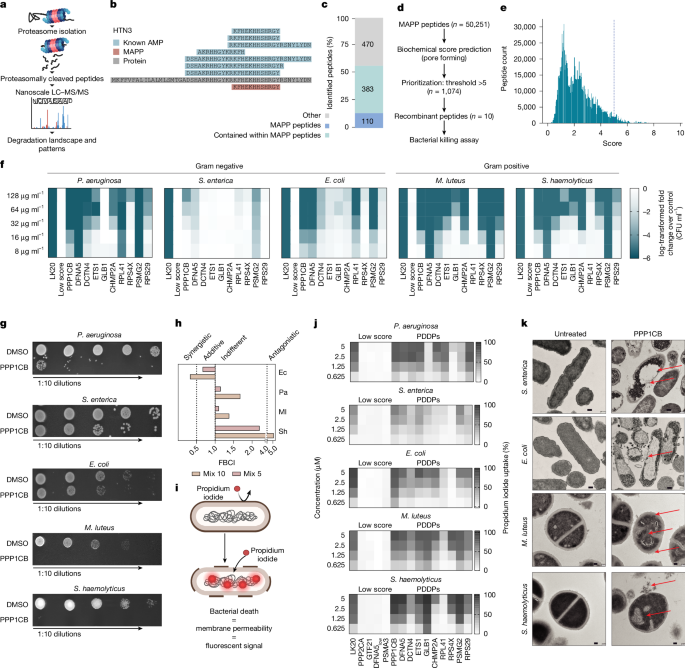
a, Overview of the MAPP methodology. b, Sequence alignment of Histatin 3 (P15516) with previously reported AMPs (blue) and a peptide identified by MAPP (red). c, Overlap between MAPP-identified peptides and peptides detected in the A549 secretome. d, Workflow for scoring MAPP peptides to identify previously undescribed PDDPs. e, Distribution of AMP scores for MAPP-identified peptides. The dashed line shows the mean score of reported AMPs. f, CFU ml–1 of Gram-negative (P. aeruginosa, S. enterica, E. coli) and Gram-positive (M. luteus, S. haemolyticus) bacteria after treatment with high-scoring peptides (named after the parental protein), LK20 or low-scoring peptides. Values normalized to control (DMSO). Data are mean ± s.e.m. (n = 3 biological replicates). g, Representative images of lysogeny broth agar plates showing tenfold serial dilutions of bacterial cultures treated with PPP1CB at MBC concentrations or with DMSO. h, FBCI values for combinations of 10 high-scoring peptides and a combination of five PDDPs (PPP1CB, DFNA5, DCTN4, PSMG2, CHMP2A) tested against M. luteus (Ml), P. aeruginosa (Pa), E. coli (Ec) and S. haemolyticus (Sh). FBCI ≤ 0.5 indicates synergy, 0.5 < FBCI ≤ 1 indicates additive, 1 < FBCI ≤ 4 indicates indifference and FBCI > 4 indicates antagonism. Low-scoring peptides (score of 0) and LK20 served as negative and positive controls, respectively. i, Bacterial permeabilization assays. j, Bacterial membrane permeabilization and propidium iodide uptake at 90 minutes after treatment with increasing concentrations of high-scored PDDPs. Values normalized to control (0.1% SDS). Data are mean ± s.e.m. (n = 3 biological replicates). k, Transmission electron microscope imaging of untreated bacteria or bacteria treated with PPP1CB at the minimal inhibitory concentration. Arrows indicate morphological disruptions and cytoplasmic release. Scale bars, 0.2 μm (S. enterica and E. coli) and 0.1 μm (M. luteus and S. haemolyticus). Schematics in panels a and i created with BioRender.com (https://BioRender.com/x10a923).
To identify putative PDDPs, we scored the MAPP-identified peptides using the same scoring system described above. Out of 50,251 peptides, we selected peptides that had a score of higher than 5 and obtained 1,074 peptides with membrane-disrupting properties (see Methods for threshold determination). Then the peptides were prioritized based on their scores (Fig. 2d,e and Supplementary Table 6) and we synthesized ten high-scoring hits as well as low-scoring peptides, to use as negative controls (Supplementary Table 7). LK20 was used as a positive control30. The positive hits included peptides that were contained in proteins with diverse functions such as PPP1CB, a catalytic subunit beta of serine–threonine-specific phosphatase 1 (ref. 31); PSMG2, a chaperone that promotes assembly of the 20S proteasome32; DCTN4, dynactin subunit that is associated with the centrosome; and DFNA5, also known as gasdermin E, which is known to promote pyroptosis of mammalian cells33. On the basis of the predicted structures of these proteins, their PDDPs are also located predominantly in structured regions (Extended Data Fig. 2d).
To examine the antimicrobial activity of MAPP-identified peptides, we chose a subset of bacterial species, reflecting the broad-spectrum effects reported for AMPs. These included the Gram-negative extracellular bacteria Pseudomonas aeruginosa, Escherichia coli and the intracellular S. enterica, as well as Gram-positive extracellular Staphylococcus haemolyticus and the intracellular Micrococcus luteus. The putative PDDPs induced bacterial inhibition or killing in a dose-dependent and selective manner, to different extents (Fig. 2f,g, Extended Data Fig. 3a and Supplementary Table 8). Furthermore, the minimal bactericidal concentrations (MBC) of the PDDPs were lower than the minimal inhibitory concentrations and none of the low-scoring peptides had antimicrobial activity (Extended Data Fig. 3b). Next, we tested peptide combinations and calculated the fractional bactericidal concentration index (FBCI) to identify additive, synergistic or antagonistic effects. The combination of five peptides showed an additive activity against E. coli and the combination of all ten peptides had a synergistic activity. However, the antimicrobial activity of combinations of peptides against M. luteus, P. aeruginosa and S. haemolyticus (Fig. 2h and Supplementary Table 9) was similar to that of individual peptides.
Mechanistically, previous studies suggested that cationic peptides might exert their function by biophysical disruption of bacterial membranes, which contain anionic phospholipids on their surface34,35. To confirm the mechanism of action of the high-scoring peptides, we used a propidium iodide assay, reflecting the penetrance of the dye as a function of perturbed membranes in different bacterial species (Fig. 2i). We could confirm the permeabilization of the bacterial membranes and the killing of five bacterial species, in a dose-dependent manner (Fig. 2j and Extended Data Fig. 3c). Importantly, no detectable effects were observed on the permeabilization of mammalian cells treated with similar concentrations of the peptides, demonstrating the selectivity of the PDDP activity towards microbial membranes (Extended Data Fig. 3d,e). Using transmission microscopy, we further found considerable membrane aberrations after treatment with a synthetic PDDP. The examined bacterial species displayed membrane rupture and subsequent release of cytoplasmic content after the addition of the PDDP to the culture (Fig. 2k and Extended Data Fig. 3f).
To examine the activity of the PDDPs under physiologically relevant conditions, we first assessed the half-life of PDDPs using the model developed previously36. We observed a near-normal distribution of peptide half-life across the proteasome-derived peptides we identified (Extended Data Fig. 4a). No notable differences in the half-life distribution between proteasome-derived peptides with or without potential antibacterial activity, as defined by the AMP score, were observed. Furthermore, we found only a weak correlation between the AMP score and the predicted half-life (Extended Data Fig. 4b). PPP1CB-derived peptide had a predicted half-life of 23.3 minutes in the blood. Moreover, it was among the top hits and exhibited a prominent antimicrobial activity against diverse bacterial species. Therefore, we chose to further test the activity of the PPP1CB-derived peptide against P. aeruginosa, a Gram-negative bacterium that is known for its resistance to nearly all antibiotics, in vitro and in vivo.
First, we used the transepithelial–transendothelial electrical resistance assay, which measures the integrity of the tight junctions in a monolayer cell culture. We found that the integrity of the gut epithelial barrier, represented by a CaCo-2 monolayer, was disrupted by the presence of bacteria and that this effect was fully abolished by the presence of the PPP1CB peptide (Extended Data Fig. 4c). Second, we assessed the potency of the PPP1CB-derived peptide in two mouse infection models: acute pneumonia and bacteraemia. In the pneumonia model, the bacterial burden in the lung was significantly reduced by intravenous (i.v.) administration of synthetic PPP1CB, compared with the phosphate-buffered saline (PBS) control. PPP1CB at a dose of 5 mg kg–1 (i.v.) had an effect comparable to that of tobramycin at 50 mg kg–1 (administered intraperitoneally, i.p.) (Fig. 3a,b). Correspondingly, neutrophilic infiltration and tissue injury were diminished after PPP1CB administration (Fig. 3c–e). Next, we evaluated the effect of PPP1CB in an acute bacteraemia infection37, administered i.p., on the bacterial burden and tissue damage (Fig. 3f). PPP1CB administered i.v. at a concentration of 10 mg kg–1 resulted in a significant reduction in bacterial burden in the spleen (Fig. 3g). Notably, the concentration of PPP1CB we used was fivefold lower than that of tobramycin, albeit in a different route of administration. Furthermore, administration of the PPP1CB-derived peptide led to a significant decrease in pathological indicators, such as immune cell infiltration and tissue injury across multiple organs, including the lung, liver, spleen, kidney and heart, compared with uninfected or mock-treated animals (Fig. 3h–m and Extended Data Fig. 4d). Finally, we examined the effect of the PPP1CB-derived peptide on sepsis-associated mortality in mice (Fig. 3n). We found that the PPP1CB-derived peptide at 10 mg kg–1 led to a significant reduction in mortality. Together, these results indicate that the PPP1CB-derived peptide may have therapeutic value, at least in the models examined, and highlight the potential of additional PDDPs to serve as a previously undescribed class of antibiotics.
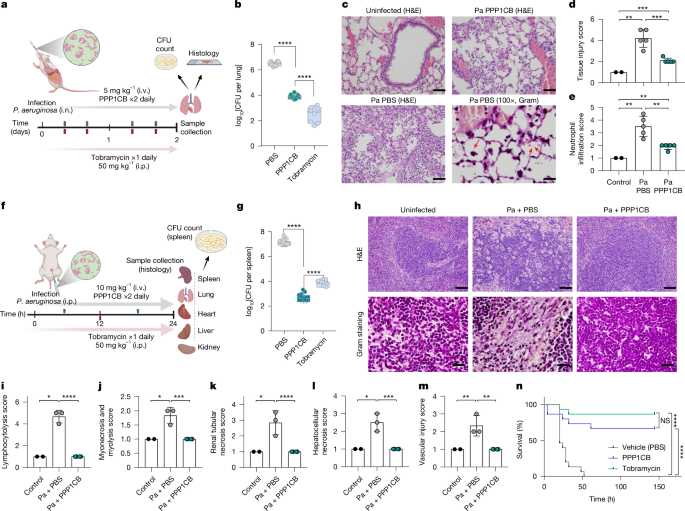
a, Pneumonia model. i.n., intranasal. b, Box plots of CFU count of P. aeruginosa (log10) per lung in mice treated with PBS, PPP1CB (5 mg kg–1 i.v.) or tobramycin (50 mg kg–1 i.p.). Data are mean ± s.d. (n = 8). One-way ANOVA, ****P < 0.0001. c, Representative haematoxylin and eosin (H&E)-stained and Gram-stained lung tissue sections from uninfected mice or mice infected with P. aeruginosa (Pa) treated with vehicle (PBS) or PPP1CB peptide (5 mg kg–1 i.v.). Scale bars, 50 µm (uninfected (H&E), Pa PPP1CB (H&E) and Pa PBS (H&E)) and 20 µm (Pa PBS (100×, Gram)). Red arrows indicate bacterial staining. d, Bar plot showing mean ± s.e.m. of tissue injury in the pneumonia model. One-way ANOVA, **P < 0.01, ***P < 0.001. e, Neutrophil infiltration analysis in lung tissue graded on the basis of severity: 1, minimal (<1%); 2, slight (1–25%); 3, moderate (26–50%); 4, moderate–severe (51–75%); 5, severe–high (76–100%). Data are mean ± s.e.m., one-way ANOVA, **P < 0.01. f, bacteraemia model. g, Box plots of CFU count of P. aeruginosa (log10) per spleen in mice treated with PBS, PPP1CB (10 mg kg–1 i.v.) or tobramycin (50 mg kg–1 i.p.). Data are mean ± s.d. (n = 8). One-way ANOVA, ****P < 0.0001. h, Representative H&E-stained and Gram-stained tissue sections from spleen uninfected or treated with PBS or PPP1CB peptide (10 mg kg–1 i.v.). Scale bars, 50 µm (H&E stained) and 20 µm (Gram stained). i–m, Bar plots representing the degree of lesions in different organs (spleen (i), heart (j), kidney (k), liver (l), lung (m)) in the bacteraemia model. Data are mean ± s.e.m. One-way ANOVA, *P = 0.05, **P < 0.01, ***P < 0.001, ****P < 0.0001. n, Kaplan–Meier survival curve showing survival rates of mice treated with PBS, PPP1CB or tobramycin (10 mg kg–1 retro-orbitally (r.o.) for both treatments) over six days after P. aeruginosa infection. Log-rank test, ****P < 0.0001, followed by pairwise comparisons using log-rank tests. NS, P > 0.05 (n = 15). Schematics in panels a and f created with BioRender.com (https://BioRender.com/x10a923).
Induced PDDPs attenuate bacterial infection
Our study thus far has examined the antimicrobial activity of synthetic PDDPs against bacteria. Next, we aimed to determine whether targeted proteasomal degradation of the full-length PPP1CB protein could induce antimicrobial activity. First, we confirmed that the knockdown of PPP1CB did not have any effect on bacterial growth (Extended Data Fig. 5a,b). Then, we harnessed the dTAG system37, a system for induced degradation by targeting an exogenously expressed protein to the proteasome. The dTAG is based on a heterobifunctional molecule that induces the binding of the FKBP12F36V tag and an E3 ubiquitin ligase complex (CRBN). After treatment with the drug (dTAGV-1), the dTAG system is activated, leading to the degradation of the target protein (that is, PPP1CB; Fig. 4a,b and Extended Data Fig. 5c). We hypothesized that such an over-expression system would generate a pool of PPP1CB degradation products. Among the putative degradation products of PPP1CB, four peptides scored above the threshold as potential PDDPs (Extended Data Fig. 5d), suggesting that several antimicrobial peptides may be generated after PPP1CB degradation. We found that the upregulation and subsequent degradation of PPP1CB alone were sufficient to reduce bacterial growth by 20% when the conditioned medium was used (Fig. 4c,d and Extended Data Fig. 5e). To examine the potential antimicrobial activity of intracellular PDDPs against intracellular bacteria, we pre-incubated cells with the dTAGV-1 molecule to activate the degradation of PPP1CB (Fig. 4e). After infection, the cells were treated with gentamicin to remove bacteria that did not enter the cells. Then the intracellular infection (for example, S. typhimurium or M. luteus) was assessed either by CFU counts (Fig. 4f,g) or by imaging (Fig. 4h–j). We found that activating the dTAG system attenuated intracellular bacterial infection significantly in both analyses. Even though we detected the PPP1CB-derived peptide intracellularly using MAPP and extracellularly using secretome MS analysis (Supplementary Table 5 and Extended Data Fig. 5f,g), it remains to be determined whether some PDDPs are retained in the cells to function intracellularly. Although we cannot rule out the possibility that the degradation of the exogenous PPP1CB drove some other cellular change that contributed to the killing, similar results were observed with the targeted degradation of another full-length protein, PSMG2, which was among our top hits (Extended Data Fig. 5h–l). Notably, the targeted degradation of GFP, used as a negative control, did not induce bacterial killing.
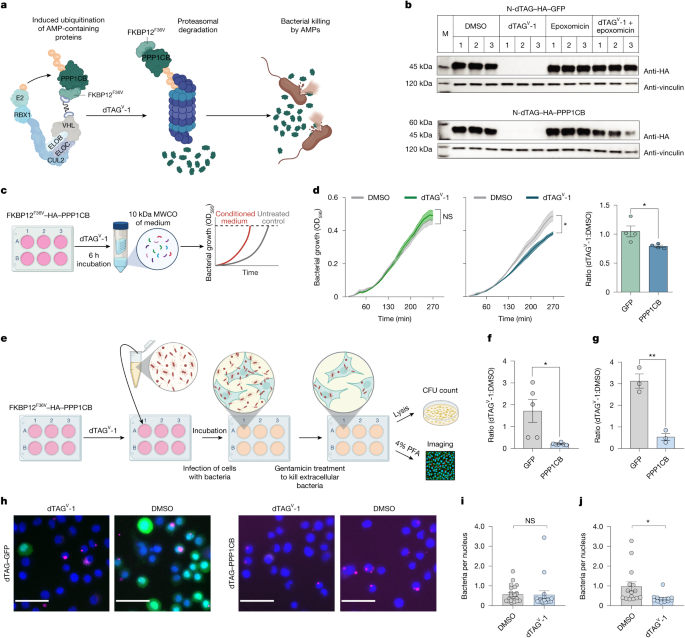
a, dTAG system of PPP1CB protein. b, Western blot analysis of degradation of dTAG–GFP and dTAG–PPP1CB. Cells were treated with dTAGV-1 (500 nM) or DMSO, with or without proteasome inhibitor (1 µM epoxomicin) for 6 h (n = 3 biological repeats). c, Bacterial growth assay using conditioned medium. MWCO, molecular weight cut-off. d, S. enterica growth in conditioned medium from A549 cells degrading GFP (left), PPP1CB (middle) and the ratio of dTAGV-1 to DMSO treatment (right). Data are mean ± s.e.m. (n = 4 biological replicates). Unpaired two-tailed Student’s t-test: left, NS, P = 0.63; middle, *P = 0.007; right, *P = 0.036. e, Experiment using the dTAG system. Cells expressing dTAG were incubated for 1 h with dTAGV-1 (500 ng ml–1) to activate PPP1CB degradation by the proteasome, followed by S. typhimurium infection (a multiplicity of infection of 100 was used for CFU counts and of 5 was used for imaging). Bacteria that did not infect the cells were washed with gentamicin and intercellular bacteria were either plated for CFU count or analysed by imaging. f,g, Bar plots showing the ratio of intracellular CFU ml–1 counts of M. luteus (f) and S. typhimurium (g) in cells expressing dTAG–PPP1CB or dTAG–GFP, treated with dTAGV-1 or DMSO. Data are mean ± s.e.m. n = 6 and n = 3 biological replicates (f and g, respectively). Unpaired two-tailed Student’s t-test: *P = 0.0106 (f); **P = 0.0022 (g). h–j, Imaging of A549 cells expressing dTAG–GFP (green) or PPP1CB, treated with DMSO or dTAGV-1, infected with red fluorescent protein (RFP) S. typhimurium (magenta) or DAPI (blue). h, Representative images. Scale bars, 50 µm. i,j, Infection with RFP S. typhimurium per number of nuclei. Data are mean ± s.e.m. (n = 4 biological replicates, five images each) for dTAG–GFP (i) and dTAG–PPP1CB (j). Unpaired two-tailed Student’s t-test: NS, P = 0.9244 (i); *P = 0.0249 (j). Schematics in panels a, c and e created with BioRender.com (https://BioRender.com/x10a923).
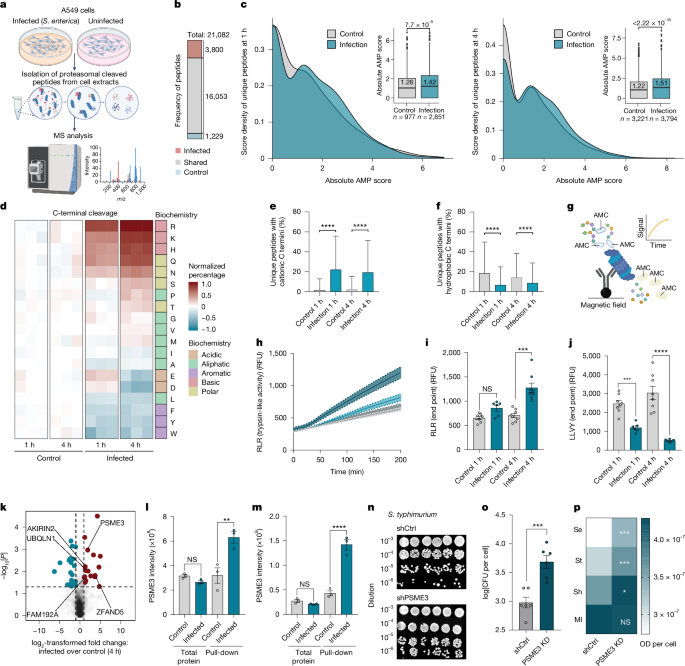
a, Infection MAPP experiment. b, Frequency of unique peptides, red (infection), blue (control) and grey (shared). c, Distribution of scores for infection or control unique peptides. Mann–Whitney U-test, P < 0.0001. d, Normalized percentage of C-terminal amino acids of MAPP peptides after infection. e,f, Percentage of unique peptides. C-terminal Lys, Arg or His (e) or Trp, Phe or Tyr (f) per protein in infection (blue) or control (grey). Mann–Whitney U-test, ****P < 0.0001. g, Model of pull-down proteasome activity assay. h–j, Proteasome activity of S. enterica infected A549 cells (4 h, dark blue; 1 h, light blue) or uninfected (4 h, dark grey; 1 h, light grey). Bar plots at the analysis end point for Arg-Leu-Arg (i) and Leu-Leu-Val-Tyr (j) peptides. Data are mean ± s.e.m. (n = 6 biological replicates). One-way ANOVA, NS, P = 0.075, ***P = 0.0003 (i); ***P = 0.0008, ****P < 0.0001. (j). RFU, relative fluorescence unit. k, Volcano plot of proteasome co-immunoprecipitated proteins from infected A549 cells. l,m, Relative PSME3 intensity by proteomics or proteasome pull-down after 1 h (l) or 4 h (m) of infection. Data are mean ± s.e.m. (n = 3 biological replicates). One-way ANOVA, NS, P = 0.64, **P = 0.0012 (l); NS, P = 0.74, ****P < 0.0001 (m). n,o, A549 cells expressing shCtrl or shPSME3 infected with S. typhimurium. n, Representative image of colonies; o, CFU quantification. Data are mean ± s.e.m. (n = 6 biological replicates). Two-tailed Student’s t-test, ***P = 0.0006. p, Bacterial growth (1 h) in conditioned medium from A549 cells expressing control short hairpin RNA (shCtrl) or short hairpin RNA against PSME3 (shPSME3). Data are mean ± s.e.m. (n = 6 biological replicates). Two-tailed Student’s t-test, ***P = 0.0007, ***P = 0.0006, *P = 0.026, NS, P = 0.23. Schematics in panels a and g created with BioRender.com (https://BioRender.com/x10a923).
Bacterial infection enhances PDDP formation
Our findings indicated that PDDPs may exert antimicrobial function in both recombinant and cellular systems. We hypothesized that similar to transcriptionally encoded cationic peptides, which are known to be constitutively generated and further induced after bacterial infection38,39, PDDPs may also be induced after bacterial infection. To test this hypothesis, we analysed the degradation landscape in response to S. enterica infection using MAPP (Fig. 5a and Extended Data Fig. 6a). Sample repeats were highly correlated and principal component analysis of the samples showed a clear separation between the different conditions (Extended Data Fig. 6b,c). Notably, most proteins, which were known to contain AMPs, did not significantly change after infection (Extended Data Fig. 6d,e and Supplementary Table 5). Instead, we found a significant increase in the frequency and the scores of unique proteasome-derived peptides after infection (Fig. 5b,c). Furthermore, we noted a shift in the observed cleavage pattern of the generated peptides (Extended Data Fig. 6f). Specifically, as no exogenous enzyme, such as trypsin, is used in the process, the naturally cleaved termini of peptides reflect the catalytic activity of the proteasome. Notably, we found that after bacterial infection the tryptic-like activity of the proteasome, which cleaves cationic residues (Lys, Arg, His), was enhanced, whereas the chymotryptic-like activity, which produces hydrophobic termini that are associated with MHCI presentation (Phe, Tyr, Trp), was reduced (Fig. 5d). Within an hour of infection, the number of peptides with cationic termini almost doubled compared with the uninfected control (1,981 versus 1,141 peptides, respectively; Extended Data Fig. 6g), whereas levels of peptides with hydrophobic or aromatic termini were decreased (1,285 in infection versus 1,580 in the control; Extended Data Fig. 6g). In the subset of proteins identified in both infected and uninfected conditions, we observed a significant increase in the percentage of peptides with cationic C-termini after infection, especially in the unique peptide population (Fig. 5e,f). Conversely, for N-terminal cleavages, which are not associated with proteasomal cleavage, we did not observe such a phenomenon (Extended Data Fig. 6h–j). This observation was further strengthened by the increase in bacterial growth after leupeptin, an inhibitor of the β2 subunit of the proteasome that is associated with tryptic-like activity (Extended Data Fig. 7a,b). Together, these results indicate that the shift in peptide termini is directly associated with changes in proteasome cleavage patterns and not merely due to the selection of proteins targeted for degradation. We further confirmed the sensitivity of the MAPP assay to detect changes in the cleavage activity of different catalytic subunits using pharmacological agents, blocking either the constitutive or the immuno proteasome (Extended Data Fig. 7c,d). In this case, and as was previously reported, we found that inhibiting the constitutive proteasome led to reduced levels of both caspase-like cleavages (Asp, Glu) and chymotryptic-like activities whereas inhibition of the immunoproteasome reduced chymotryptic-like activities40,41.
The change in proteasomal activity after bacterial infection was further validated by a fluorogenic assay investigating the cleavage activity of different model peptides (Fig. 5g). Proteasomes isolated from cells that were infected with bacteria exhibited increased tryptic-like activity and reduced chymotryptic-like activity compared with those from control cells (Fig. 5h–j). Overall, these results indicate that during bacterial infection, proteasome activity shifts to favour the generation of peptides with cationic termini through increased tryptic-like catalytic activity. However, the mechanism that drives the altered proteasomal cleavage remains unclear.
PSME3 drives cationic PDDP cleavage after infection
The function of cellular proteasomes is governed by the catalytic subunits of the constitutive and immuno proteasomes, as well as by the binding of the catalytic core to different regulatory subunit caps (that is the 19S subunits, PSME1–PSME4 and PI31), adding to the heterogeneity of proteasome populations and their activity under different conditions42. We hypothesized that the observed effects in proteasome activity may be driven by an alteration in the catalytic subunits or their associated partners. To test this hypothesis, we immunoprecipitated proteasomes from infected cells and uninfected controls and examined them by MS analysis. We could identify all the subunits of the proteasome, including the 20S core particle and the 19S regulatory particle. Several proteins known to associate or interact with the proteasome showed increased binding to the proteasome after bacterial infection, including PIP3043, UBQLN1 (refs. 44,45), ZFAND5 (ref. 46) and AKIRIN2 (refs. 47,48). Moreover, we found a significant increase in the binding of PSME3, one of the proteasome regulatory caps, to the proteasome after infection (Fig. 5k–m). This observation was intriguing as previous studies identified a role for PSME3 as a positive regulator of NF-κB49,50,51 mostly in macrophages. However, these studies did not examine its potential involvement in regulating peptide proteolysis. Previous work52 focused on mechanistic and structural aspects of PSME3, independent of its physiological role. That study showed that PSME3 does not specifically open the proteasomal gate for tryptic-like peptide substrates, but rather that it allosterically upregulates the catalytic capacity of the β2 subunits of the proteasome, which are associated with tryptic-like activity and cleavages. Thus, our observation of increased tryptic-like cleavages may be mediated by PSME3 to promote antibacterial activity after infection. We found an increase in S. typhimurium infection of PSME3-deficient cells compared with controls (Fig. 5n,o and Extended Data Fig. 7e). We could further confirm that PSME3 was also required for the attenuation of bacterial growth in the secreted medium and that the knockdown of PSME3 enhanced bacterial growth (Fig. 5p). Although PSME3 deficiency was previously shown to reduce NF-κB activation49, inhibiting NF-κB did not block the antimicrobial response during infection (Extended Data Fig. 7f–h). These findings suggest that in epithelial cells, PSME3 recruitment to the proteasome and subsequent PDDP generation may precede NF-κB-mediated transcriptional activation. It remains unclear whether the canonical innate response might vary between innate immune cells and other cell types.
Discussion
In this study, we addressed a question that remained unanswered for decades, namely whether there are additional roles for proteasome-cleaved peptides, beyond antigen processing and presentation. Our study identifies proteasomes as a central source for both constitutive and induced AMP production, revealing a previously unrecognized cell-autonomous pathway in innate immunity. This discovery, alongside the established role of proteasome-cleaved peptides in adaptive immunity, positions cellular proteasomes as key orchestrators of what we propose to define as a proteolysis-driven immunity—a dual-function mechanism for immune protection that bridges innate and adaptive immunity.
From an evolutionary perspective, it makes sense that such an extensive system for protein degradation, involving tight regulation, ATP requirements and tens of components, will derive more functions from proteasome-cleaved peptides for cellular defence, offering a previously undescribed model for cellular sustainability. Our analysis revealed that 92% of annotated human genes contain at least one peptide with a cationic terminus, yielding 270,872 putative PDDPs (see Methods). This highlights the vast, underexplored potential of PDDPs in immune homeostasis and defence. Previously, a peptide derived from keratin 6a that is known to exert antimicrobial activity was shown to decrease on proteasome inhibition. Yet it was not shown to be derived directly from proteasome-cleaved peptides53,54. Furthermore, cryptic peptides from the lysosome were also suggested to play a part in cellular defence55,56, suggesting that additional defence pathways may yet be discovered.
The involvement of PSME3, a proteasome activator, in the generation of PDDPs is intriguing because PSME3 has been implicated in various immune contexts. PSME3 deficiency correlates with sepsis in humans51, whereas knockout mice show increased autoimmunity with age57 and heightened susceptibility to fungal infections58. These findings underscore the need to understand the dynamic regulation of proteasomes and their degradation patterns in facilitating proteolysis-driven immunity in response to diverse pathogens (for example, bacteria, fungi and viruses), their membrane composition and route of entry. Notably, PSME3 predates the genome duplication events that gave rise to thymic and immunoproteasomes that are associated with adaptive immunity, suggesting that antimicrobial functions may have preceded antigen processing as an evolutionary first line of defence.
Important questions regarding the principles underlying PDDP function and regulation remain. Further study is required to determine whether PDDPs act alone or in combination, as was seen with TLR-activated AMPs. Further investigation is also needed to determine how PSME3 recruitment is regulated, what sensing mechanisms are involved, where PDDPs are produced in vivo and how are they secreted, what principles determine their effects on intracellular versus extracellular bacteria and whether immune and non-immune cells use distinct innate immunity mechanisms. Addressing these gaps in knowledge will advance our understanding of the evolution and functionality of innate immunity.
Beyond its fundamental implications for proteasome biology and immunology, our work offers translational potential. Natural antibacterials such as PDDPs could provide alternatives to conventional antibiotics in combating antibiotic-resistant infections. Their endogenous production may confer immune tolerance, reducing the risks associated with exogenous AMP treatments. These findings pave the way for previously undescribed diagnostic and therapeutic59 strategies in the fight against infectious diseases.
Methods
Bioinformatic analysis of known AMPs
All the computational analyses presented were done using Python v.3.11 or R v.4.3.1. Python packages used: beautifulsoup4 v.4.12.2, bio v.1.6.2, GSEApy v.1.1.0, matplotlib v.3.7.1, NumPy v.1.24.3, pandas v.2.0.2, SciPy v.1.10.1, seaborn v.0.12.2, sklearn v.0.0.post5, urllib3 v.2.0.3. R libraries used: BiocManager v.1.30.22, circlize v.0.4.15, ComplexHeatmap v.2.16.0, drawProteins v.1.20.0, dplyr v.1.1.2, ggplot2 v.3.4.4, ggnewscale v.0.4.10, ggrepel v.0.9.4, PerformanceAnalytics v.2.0.4, RColorBrewer v.1.1-3, stringr v.1.5.1, tidyr v.1.3.0, tidyverse v.2.0.0, ggplot2 v.3.4.4.
Data retrieval and collection of experimentally validated AMPs
AMP sequences were retrieved from four publicly available databases: CAMP(R4)60, DRAMP61, DBAASP62 and dbAMP63. For each database, AMP sequences were downloaded along with associated metadata, including but not limited to protein ID, sequence, organism source and activity. Following data retrieval, we filtered for peptides from naturally occurring sources, excluding synthetic or engineered peptides.
BLAST analysis
The combined dataset of AMPs underwent sequence similarity analysis using the Basic Local Alignment Search Tool (BLAST)64 v.2.2.26. This analysis was conducted against the human proteome database obtained from Swiss-Prot (September 2023).
Peptides with sequence identities matching human proteins completely were identified and subsequently retained for further analysis. To ensure stringent criteria, peptides shorter than five amino acids were excluded from the dataset to maintain consistency and reliability in subsequent analyses.
The analysis revealed AMPs that had not been previously associated with human sources but have now been authenticated as constituents of the human proteome (Supplementary Table 1).
Conservation analysis
For AMP conservation analysis, we used orthogroups of the Euarchontoglires subclade, which include orthologues for Homo sapiens. We used this approach, which is solely based on proteins with clearly defined orthogroups in the EggNog database65 as it is stricter in terms of conservation compared with simple sequence homology-based protein alignment. In short, for each protein containing a peptide that was designated as a putative AMP, on the basis of 100% identity to a previously published AMP, we calculated the amino acid conservation rate by Rate4Site66. Proteins lacking clearly defined orthologues were excluded from the analysis (these proteins are marked NA). To estimate the AMP sequence conservation, we compared the conservation rate, per amino acid residue, in the AMP sequence or from the same protein outside that region, using a two-sided Mann–Whitney U-test. The Benjamini–Hochberg correction was used to control for multiple hypotheses testing.
AMP accessibility analysis
To analyse the position of known AMPs in the structures of mature proteins, we used AlphaFold-predicted monomeric structures67 from the human proteome (uploaded 14 January 2024). For each protein that includes a known AMP sequence in its polypeptide chain, we calculated a relative solvent-accessible surface area (rASA) using the FreeSASA library68. The predicted local distance difference test (pLDDT) of amino acids from AlphaFold69 was used to measure residue-wise disorderness (the more disordered region, the smaller the pLDDT score)70. To demonstrate the general trends for amino acids in AMP, we compared the rASA and pLDDT of amino acids inside and outside of the AMP regions for the whole set of AMP-containing proteins using a two-sided Mann–Whitney U-test. To visualize AMP in the host protein, we used PyMOL v.2.5.7.
Analysis of AMP gene expression in different tissues
RNA-sequencing data for human tissues (RNA HPA tissue gene data) were obtained from the Human Proteome Atlas website71. We identified genes that encode known AMPs present in the human genome. These genes were then cross-referenced with the transcriptomic data obtained from the Human Proteome Atlas dataset to assess their expression profiles across different tissues. The transcript abundance for each AMP gene was determined on the basis of protein transcripts per million values. The data were normalized per gene by a z-score.
Enrichment analysis using KEGG pathways
We performed an enrichment analysis using the Kyoto Encyclopedia of Genes and Genomes (KEGG) Pathway database72 2021 version and GO Molecular Function73 2023 version. To execute this analysis, we used the GSEAPY Python package v.0.10.5. We compared the proportion of genes associated with the identified pathways to the entire gene repertoire catalogued in Swiss-Prot (September 2023).
Bioinformatic analysis of potential proteasome-derived AMPs in the human degradome
The PDDP sequence list was assembled from multiple MAPP12 experiments conducted in the laboratory (Supplementary Table 3). Subsequently, this dataset was filtered using scoring criteria derived from MaxQuant analysis, retaining only peptides that passed a threshold of 1% false discovery rate. After filtering, all peptides in the dataset were subjected to a previously proposed scoring algorithm26, as implemented previously74.
In silico proteasome cleavage of the human proteome
To identify potential proteasomal cleavage sites in protein sequences, we used the pepsickle algorithm on the human proteome (Swiss-Prot, September 2023)75. The results obtained from pepsickle were used to generate peptide combinations ranging from 10 to 50 amino acids in length, which represent putative proteasome-generated peptides. The identified peptides were cross-referenced with previously reported AMPs to ascertain their potential efficacy. Mean scores were computed for peptides present in the known datasets to choose the minimal AMP score as a threshold for PDDPs (excluding a score of zero). Peptides scoring above the threshold of five, representing the mean score of reported AMPs, were considered as putative PDDPs (415,750 peptides). For overlapping peptides, only the top-scoring peptide was included. Additional filtering for cationic carboxy termini was added, yielding 270,872 peptides.
Proteasome-derived peptides in biological fluids
To identify proteasome-derived peptides in biological fluids we used peptidomics data from blood, wound fluid, endometrium fluid, milk and urine, and compared them with the sequences of proteasome-derived peptides76,77,78,79,80.
Human cell lines
Human cell lines used in this study were HCT116 (CCL-247), A549 (CCL-185), MDA-MB-231 (HTB-26) and CaCo-2 (HTB-37) obtained from ATCC. A549 cells were cultured in Dulbecco’s Modified Eagle’s Medium (DMEM; 41965039; Gibco) and HCT116 cells were cultured in McCoy’s 5 A Medium (M8403; Sigma). MDA-MB-231 cells were cultured in Roswell Park Memorial Institute (RPMI)-1640, supplemented with 10% fetal bovine serum (F7524; Sigma), sodium pyruvate (03-042; Sartorius) and glutamine (03-020; Sartorius). Cells were cultured and passed in accordance with standard procedures at 37 °C with 5% CO2. The absence of mycoplasma contamination was verified monthly.
Bacterial strains
Pseudomonas aeruginosa CHA-OST, P. aeruginosa PAO1, E. coli K12 MG1655, M. luteus NCTC 2665, S. haemolyticus JCSC1435, Salmonella enterica subsp. enterica, S. typhimurium SL1344 and S. typhimurium SL1344 RFP were provided by the R. Straussman, E. Elinav and R. Avraham laboratories (Weizmann Institute of Science). All bacteria were cultured in LB (Sigma) according to standard procedures. Aliquots of the bacteria were cultured from frozen stocks in fresh LB overnight and diluted to the desired cell density for each assay. The OD600 nm was determined using a spectrophotometer and correlated with the CFU counts after serial dilution plating on LB agar.
Peptide synthesis
To assess the antibacterial activity of selected MAPP-derived peptides, which were predicted to have antibacterial activity, we used chemically synthesized peptides with the same amino acid sequences (GenScript). The sequences of peptides used in this study are presented in Supplementary Table 7.
LK20 was synthesized as previously described and used as a positive control81.
Assessment of the minimal inhibitory concentration
The minimal inhibitory concentration (MIC) was assessed as previously described with some adjustments30. In brief, an overnight culture of bacteria was diluted 1:50 in 5 ml fresh LB medium and allowed to grow in a shaking incubator (200 rpm) at 37 °C until an OD of 0.1 (595 nm) was reached. Peptides were diluted to a concentration of 400 µg ml–1 in a 96-well plate and then serially diluted twofold. Bacteria were then introduced to the peptides resulting in a final volume of 200 μl of LB with a bacterial load of 5 × 10⁵ CFU ml–1 (for M. luteus 5 × 10⁴ CFU ml–1) containing <1% DMSO (Sigma). The plate was incubated at 37 °C for 24 h. Growth was determined by measuring the OD at 595 nm using a plate reader.
Assessment of minimal bactericidal concentration (MBC)
The MBC was performed as previously described with some adjustments82. In brief, the bacterial culture was prepared as described above and washed three times with PBS (Sartorius). Peptides were diluted to a concentration of 256 μg ml–1 in a 96-well plate and then serially diluted twofold. Bacteria were then introduced to the AMPs resulting in a final volume of 200 μl of PBS with a bacterial load of 5 × 10⁵ CFU ml–1 containing <0.5% DMSO. The plate was incubated for 1 h at 37 °C. Each treatment was serially diluted tenfold in PBS and spot-plated three times in LB agar plates. The log-transformed reduction was calculated using the CFU count.
Synergistic antibacterial activity of PDDPs
The synergistic activity of the PDDPs was assessed as previously described83 with lower concentrations. The combinations of five (PPP1CB, DFNA5, DCTN4, PSMG2, CHMP2A) derived peptides and ten peptides were prepared by combining the peptides in equal concentrations to create mixed peptide stocks. Each stock was prepared at a concentration of 10 mg ml–1 in DMSO, with individual peptide concentrations of 2 mg ml–1 for the five-peptide mixture and 1 mg ml–1 for the ten-peptide mixture. The antimicrobial activity of these peptide mixtures was evaluated using bacterial killing assays as previously described. The fractional bactericidal concentration (FBC) was calculated for peptide X according to Equation 1:
The synergistic antibacterial activity was determined by the FBCI, which was calculated according to Equation 2:
FBCI values were defined as synergy for FBCI < 0.5, additive for 0.5 < FBCI ≤ 1, indifference for 1 < FBCI ≤ 4 and antagonistic for FBCI > 4. For FBC calculations, peptides that did not show bactericidal activity at the highest tested concentration (128 μg ml–1), were assigned a value of 256 μg ml–1, following the approach described previously84.
Membrane permeabilization assay
To measure the effect of putative AMPs on the viability and permeabilization of bacterial strains and human cell lines (A549 and HCT116), we used a propidium iodide (PI; Sigma) assay85. Bacteria were grown to mid-logarithmic phase, washed and diluted with assay buffer (10 mM MES pH 5.5, 25 mM NaCl; Sigma) to a concentration of 5 × 10⁸ cells ml–1 and mixed with PI to a final concentration of 5.5 μg ml–1 (8.3 μM). Next, 100 μl of bacteria with PI were transferred to 96-well plates and mixed with putative AMPs in various concentrations and with negative (DMSO) and positive (0.1% SDS; Bio-Lab) controls. Then the plates were incubated for 2 h at 37 °C in a fluorescence reader and the output signals (excitation, 535 nm; emission, 617 nm) were measured every 5 min. Bacterial permeabilization activity was normalized against the maximum fluorescence output from the positive control. For human cell lines, cells were collected and washed two times in PBS then suspended in PBS containing PI 5.5 μg ml–1 (8.3 μM) and the fluorescent signal was measured.
Transmission electron microscopy
We used transmission electron microscopy to directly assess the membrane disruption by PDDPs. Bacteria were grown to the mid-logarithmic phase, incubated with the putative PDDPs for 30 min and fixed with 4% paraformaldehyde, 2% glutaraldehyde (EMS) in 0.1 M cacodylate buffer (Sigma) containing 5 mM CaCl2 (pH 7.4), postfixed in 1% osmium tetroxide (EMS) supplemented with 0.5% potassium hexacyanoferrate trihydrate and potassium dichromate (BDH Chemicals) in 0.1 M cacodylate for 1 h, stained with 2% uranyl acetate (EMS) in double distilled water for 1 h, dehydrated in graded ethanol solutions and embedded in epoxy resin (Agar Scientific). Ultrathin sections (70 nm) were obtained with a Leica EMUC7 ultramicrotome and transferred to 200 mesh copper transmission electron microscopy grids (SPI). Grids were stained with lead citrate and examined with a Tecnai T12 transmission electron microscope (Thermo Fisher Scientific). Digital electron micrographs were acquired with a bottom-mounted TVIPS TemCam-XF416 4k × 4k CMOS camera.
Bacterial growth in conditioned medium
Bacterial growth in a conditioned medium collected from cells was performed as described previously86. A549 or HCT116 cells were cultured until 90% confluence in standard medium without antibiotics. Cells were washed three times in PBS and the medium was replaced with serum-free DMEM and incubated for 6 h. Conditioned medium was filtered (10 kDa cut-off; PES; 964014, Analytical Sales and Services, or Vivaspin, VS0202). Then, 100 μl of the filtered conditioned medium were mixed with the bacteria pre-diluted in DMEM to obtain the final bacterial concentration of approximately 5 × 10⁷ bacteria per ml (for M. luteus approximately 5 × 10⁶ CFU per ml). Bacterial growth was measured in the plate reader at OD at 595 nm every 10 min with shaking.
For proteasome-inhibition experiments, cells were treated for 6 h with bortezomib (50 nM) and stimulated with bacterial TLR agonists: heat-killed Listeria monocytogenes (TLR2) 108 cells per ml, LPS-EK (TLR4) 500 ng ml–1, FLA-ST (TLR5) 1 μg ml–1, ATP 5 mM and heat-killed (95 °C, 15 min) bacteria. For inhibition of the proteasomal β2 subunit, cells were incubated for 6 h with leupeptin (20 µM).
Intracellular infection assay (CFU count)
Salmonella typhimurium or M. luteus was used for intracellular infection in which the ability of bacteria to infect the human cell lines was estimated. An overnight culture of bacteria was grown to the mid-logarithmic phase in fresh LB medium with 0.3 M NaCl. Bacteria were washed three times with PBS and added to A549 cells at multiplicities of infection (MOI) of 100 for S. typhimurium and MOI of 10 for M. luteus (unless specified otherwise). Then, cells were incubated with bacteria for 1 h, washed twice with PBS and incubated for 1 h in DMEM with 100 μg ml–1 gentamicin to kill extracellular bacteria. After incubation, cells were washed twice with PBS and lysed with 0.1% Triton X-100 (Sigma) solution for 15 min. Then, cell lysates containing bacteria were plated on LB agar in serial dilution to determine the CFU count.
Intracellular infection assay (fluorescence assay)
Overnight cultures of S. typhimurium SL1344 RFP were diluted and grown to the mid-logarithmic phase in fresh LB medium with 0.3 M NaCl. Then the bacteria were washed three times with PBS and added to A549 cells with MOI of 5. After 1 h of bacterial infection, cells were washed three times and incubated for 1 h in DMEM with 100 mg ml–1 gentamicin. After incubation, cells were washed twice with PBS and fixed with 4% PFA (Sigma) solution for 15 min. Then, cells were treated with DAPI (Sigma, 2.5 µg ml–1) for 2 min for nuclear staining and the plate was stored in PBS with 100 mg ml–1 gentamicin until imaging. Cells were imaged using a wide-field Leica DMi8 microscope with a 20× air objective (NA = 0.80). Analysis was done by ImageJ v.2.14.0/1.54f JAVA v.1.8.0_322.
Targeted protein degradation assay (dTAG system)
PPP1CB and eGFP were cloned from pEGFP(N3)-PP1beta, a gift from A. Lamond and L. Trinkle-Mulcahy87 (plasmid 44223, Addgene), into the N-terminal dTAG plasmid pLEX_305-N-dTAG, a gift from J. Bradner and B. Nabet37 (plasmid 91797, Addgene). The plasmids were cut by restriction enzymes ClaI and AgeI followed by ligation with a T4 ligation enzyme (NEB). PSMG2 cloning into pLEX_305-N-dTAG was ordered from GenScript. Stable cell lines were generated using third-generation lentiviral infection. Cells were treated with 500 nM of the dTAGV-1 compound (Tocris 6914) for 6 h for conditioned medium experiments. For intracellular bacterial infection, cells were incubated for 1 h before infection. DMSO was used as a control. The degradation of the proteins by the dTAG system was assessed by western blot using the anti-HA-tag antibody (SAB2702196; Sigma) and anti-vinculin antibody as a loading control (ab129002; Abcam). Bacterial growth was assessed in the collected medium and by intracellular cell infection.
PSME3 and PPP1CB knockdown
To assess the role of PSME3 (also known as PA28γ) in generating proteasome-derived antibacterial peptides, MISSION short hairpin RNAs were used to target PSME3 expression (Sigma; TRCN0000290025). We generated an A549 cell line stably expressing the plasmid under selection (with puromycin 2 μg ml–1). To examine the effect of PPP1CB knockdown on bacterial growth in a conditioned medium, we similarly generated A549 cells stably expressing the MISSION short hairpin RNAs targeting PPP1CB from Sigma (TRCN0000338386). RFP knockdown was used as a control (TRCN000002209).
Bacterial infection of PSME3 knockdown and NF-κB inhibition
To examine the antimicrobial response by PSME3 and the dependence on the NF-κB activation response during infection, stable A549 cells expressing shCTRL or shPSME3 were treated with JSH-23 (40 µM) or IKK16 (1 µM) for 2 h, followed by infection with S. typhimurium SL1344. We analysed the response using CFU counts or a fluorescence assay as described above.
Dynamic measurements of transepithelial–transendothelial electrical resistance (TEER) assays
TEER assay88 was conducted on CaCo-2 (colorectal adenocarcinoma cell) monolayers. CaCo-2 cells were seeded onto a 96-well ‘impedance’ plate (Axion BioSystems; Z96-IMP-96B-25) and monitored using the Maestro Edge platform (Axion BioSystems) until they reached full confluence, exhibiting a resistance range of 800–1,200 Ω. The evaluation of barrier integrity was carried out through the Axion ‘Impedance’ module, using the ratio of cellular resistance at a low frequency (1 kHz) to that at a high frequency (41 kHz). In coculture experiments, P. aeruginosa (105) bacteria were centrifuged at 4,000 rpm for 5 min, resuspended in 4.4 ml of cell culture medium (DMEM-F12) supplemented 2 mM l-glutamine without antibiotics or sera, then serially diluted with PPP1CB. A final volume of 200 μl of the diluted bacterial suspension was added to each well. The barrier index was monitored at a high temporal resolution of 5 min over 6 h, normalized to the reference time (t = 0). An additional correction was applied by normalizing the barrier index to that of unstimulated cells (CaCo-2).
Pseudomonas aeruginosa infection in mouse models of bacteraemia and pneumonia
Bacterial cultures and growth conditions
The wild-type P. aeruginosa strain PAO1 was provided by M. Vasil as previously published89,90,91. Aliquots of the bacteria were cultured from frozen stocks in fresh LB overnight and diluted to the desired cell density for each assay. The OD at 600 nm was determined using a spectrophotometer and correlated with the numbers of CFU after serial dilution plating on LB agar.
Ethical statement
Animal experiments were performed in strict accordance with the Guide for the Care and Use of Laboratory Animals of the National Institutes of Health. The animal protocol was thoroughly reviewed and approved by the Institutional Animal Care and Use Committee at the University of Illinois at Urbana–Champaign, under protocol no. 22051. Male and female 6-week-old mice, with a body weight in the range of 27–35 g (male) or 22–30 g female) (both sexes in the same group), were purchased from Charles River. At arrival, all mice were randomly housed by animal care technicians who were not part of the study team. Mice were acclimatized for one week before experimentation. All mice were housed in positively ventilated microisolator cages with automatic recirculating water located in a room with laminar, high-efficiency particulate-filtered air, with full access to autoclaved food, water and bedding. The animal room operates on an alternating 12-h light–dark cycle, with the ambient temperature set to 68 °C (range 67–71 °C) and humidity at 28% (range 17–59%). At the completion of experiments, mice were euthanized by overdosing with CO2 or ketamine–xylazine, followed by cervical dislocation.
Mouse models of acute pneumonia and bacteraemia
For the acute pneumonia model92, CD-1 mice (n = 8 per group) were intranasally inoculated with the indicated concentration of the P. aeruginosa strain PAO1 as previously published93,94,95. Infected mice were treated twice daily with 5 mg kg–1 of PPP1CB i.v. Lungs were collected and processed 48 h post-infection (hpi). For the bacteraemia model, CD-1 mice (n = 8 per group) were intraperitoneally infected with the P. aeruginosa strain PAO1 (2.5 × 10⁷ CFU per mouse)93,95. Infected mice were treated twice daily with 10 mg kg–1 of PPP1CB i.v. and spleens were analysed at 24 hpi. The control group, in both mouse models, was treated with the same volume of sterile PBS or the antibiotic tobramycin (50 mg kg–1, i.p., once daily). Mouse tissues were homogenized in 1 ml sterile PBS using an Omni Soft Tissue Tip Homogenizer (Genizer). Bacterial burden was determined through serial dilution plating of the homogenate onto LB agar plates. For the mouse model of mortality because of bacteraemia-induced sepsis, male and female 7-week-old mice (15 per cohort) were anaesthetized by isoflurane and intraperitoneally inoculated with a high dose of P. aeruginosa strain PAO1 (6.7 × 10⁷ CFU per mouse, in 100 µl), which resulted in mortality because of bacteraemia-derived sepsis as previously described95. Infected mice were treated twice daily retro-orbitally beginning at 2 hpi, for 3 days with PPP1CB i.v. (10 mg kg–1, in 50 μl). The antibiotic tobramycin (10 mg kg–1, in 50 μl) and the same volume of vehicle (sterile PBS once daily, in 50 μl) were used as both positive and negative controls. Mouse mortality was monitored for 6 days (120 h). Survival analysis was performed with a Kaplan–Meier log rank survival test using GraphPad Prism (v.9.0.2). All collected mouse tissues were submitted for H&E and Gram staining and the pathological scoring was done manually. The degree of lesions was graded from one to five on the basis of severity: 1, not present or minimal (<1%); 2, slight (1–25%); 3, moderate (26–50%); 4, moderate–severe (51–75%); 5, severe–high (76–100%).
Immunoblotting
Protein concentrations were determined using the BC Assay Protein Quantitation Kit (Interchim). In brief, 20 μg of total protein was separated by SDS–PAGE using 4–20% gradient Criterion TGX protein gels (Bio-Rad) and transferred onto nitrocellulose membranes using an iBlot 2 Gel Transfer Device (Thermo Fisher Scientific). The membranes were blocked in 5% milk prepared in TBS–0.1% Tween 20 (Sigma) and incubated in primary antibodies overnight at 4 °C, followed by washing and incubation with secondary antibody. Blots were developed using the ChemiDoc XRS+ Imaging System (Bio-Rad).
MAPP and proteomics of infected cells
A549 cells were seeded and cultured until 90% confluency, at which point they were washed twice with PBS. The cells were then incubated in serum-free DMEM and infected with S. enterica at a MOI of 5 for either 1 or 4 h. Uninfected cells served as controls. Cells were collected and analysed by MAPP.
MAPP analysis of cells treated with proteasome inhibitors
MDA-MB231 cells were seeded and cultured until 90% confluency, at which point they were washed twice with PBS. Cells were treated with DMSO, bortezomib (50 nM) or the immunoproteasome inhibitor ONX-0914 (1 μM) for 6 h, then washed and collected for further processing by MAPP as previously described.
Proteasome immunoprecipitation
Cells were lysed with 25 mM HEPES, pH 7.4, 10% glycerol, 5 mM MgCl2, 1 mM ATP and 1:400 protease-inhibitor mixture (Calbiochem), homogenized through freeze–thaw cycles and passed through a needle (25G). The lysates were cleared by 30-min centrifugation at 21,130g at 4 °C. Pellets were lysed again with 0.5 mM ammonium persulfate to enrich the nuclear fraction then centrifuged. Mixed lysates were cross-linked as previously described12. For immunoprecipitation, the lysates were then incubated with Protein G–Sepharose beads (Santa Cruz) with antibodies against PSMA1 and eluted with 100 mM Tris-HCl, pH 8, 8 M urea and 50 mM DTT for 30 min at 37 °C. Eluted fractions were analysed by SDS–PAGE to evaluate yield and purity.
Isolation of proteasome-cleaved peptides
Immunoprecipitated proteasomes and their associated peptides were loaded on C18 cartridges (Waters) that were prewashed with 80% acetonitrile (ACN) in 0.1% trifluoroacetic acid (TFA) followed by washing with 0.1% TFA only. After loading, the cartridges were washed with 0.1% TFA. Peptides were eluted with 30% ACN in 0.1% TFA.
Assessing the proteasome composition
After immunoprecipitation, proteasomes were denatured by 8 M urea for 30 min at room temperature, reduced with 5 mM dithiothreitol (Sigma) for 1 h at 25 °C and alkylated with 10 mM iodoacetamide (Sigma) in the dark for 45 min at 25 °C. Samples were diluted to 2 M urea with 50 mM ammonium bicarbonate. Proteins were then digested with trypsin (Promega) overnight at 37 °C at 50:1 protein:trypsin ratio, followed by a second trypsin digestion for 4 h. The digestions were stopped by adding TFA (1% final concentration). Then, peptides were desalted using Oasis HLB, μElution format (Waters). The samples were vacuum dried and stored at −80 °C until further analysis.
Proteomic analysis by liquid chromatography (LC)–MS
Lysates in 5% SDS in 50 mM Tris-HCl were incubated at 96 °C for 5 min, followed by six cycles of 30 s of sonication (Bioruptor Pico, Diagenode). Proteins were reduced with 5 mM dithiothreitol and alkylated with 10 mM iodoacetamide in the dark. Each sample was loaded onto S-Trap microcolumns (Protifi) according to the manufacturer’s instructions. In brief, after loading, samples were washed with a 90:10 ratio (v/v) of methanol and 50 mM ammonium bicarbonate. Samples were then digested with trypsin for 1.5 h at 47 °C. The digested peptides were eluted using 50 mM ammonium bicarbonate; trypsin was added to this fraction and incubated overnight at 37 °C. Two more elutions were made using 0.2% formic acid and 0.2% formic acid in 50% acetonitrile. The three eluents were pooled and vacuum dried. Samples were kept at −80 °C until analysis.
Ultra-LC–MS grade solvents were used for all chromatographic steps. Each sample was loaded using split-less nano-ultra performance LC (10K psi nanoAcquity; Waters). The mobile phase was H2O + 0.1% formic acid (A) then acetonitrile + 0.1% formic acid (B). Desalting of the samples was performed online using a reversed-phase Symmetry C18 trapping column (180 µm internal diameter, 20 mm length, 5 µm particle size; Waters). The peptides were then separated using a T3 HSS nano-column (75 µm internal diameter, 250 mm length, 1.8 µm particle size; Waters) at 0.35 µl min–1. Peptides were eluted from the column into the mass spectrometer using the following gradient: 4% to 35% B in 120 min, 35% to 90% B in 5 min, maintained at 90% for 5 min and then back to initial conditions.
The nanoLC (Ultimate3000, Thermo Fisher Scientific) was coupled online through a nESI emitter (10 μm tip; FossilIonTech) to a quadrupole Orbitrap mass spectrometer (Exploris480, Thermo Fisher Scientific).
Data were acquired in data-dependent acquisition mode, using a Top10 method. MS1 resolution was set to 70,000 (at 400 m/z), a mass range of 375–1,650 m/z, automatic gain control (AGC) of 3 × 10⁶ and the maximum injection time was set to 100 ms. MS2 resolution was set to 17,500, quadrupole isolation 1.7 m/z, AGC of 1 × 10⁵, dynamic exclusion of 40 s and a maximum injection time of 150 ms.
MAPP data analysis and label-free quantification
Raw data were analysed in MaxQuant software96 (v.1.6.0.16) with the default parameters for the analysis of the proteasomal peptides, except for the following: unspecific enzyme, label-free quantification minimum ratio count of 1, minimum peptide length for unspecific search of 6, maximum peptide length for non-specific search of 40 and match between runs enabled. A false discovery rate of 1% was applied for peptide identification. For the analysis of tryptic digests, the default parameters were set, apart from a minimum peptide length of 6. Masses were searched against the human proteome database from UniProtKB (April 2020).
Peptides resulting from MaxQuant were initially filtered to remove reverse sequences and known MS contaminants. For the MAPP peptide fraction, we removed antibody and proteasome peptides as contaminants. To decrease ambiguity, we filtered out peptides that did not have at least two valid label-free quantification intensities, per condition. We included razor peptides, which belong to a unique MaxQuant ‘protein group’. MAPP protein intensities were inferred with MaxQuant. For graphical representation, intensities were log-transformed and zero intensity was imputed to a random value chosen from a normal distribution of 0.3 s.d. and downshifted by 1.8 s.d.
Peptide cleavage analysis
For each peptide, its absence or presence in each sample was annotated (scored 0 or 1) and the C-terminal amino acid was determined (N-terminal amino acid is the amino acid before the peptide start or cleavage site). Cysteines were not quantified as they might be affected by the crosslinker. Per sample, the relative frequency of each amino acid was calculated and standardized on the amino acid level for the heat map representation (z-scores). Heat maps were generated with the ComplexHeatmap (v.2.18.0) package with row clustering using Euclidean distances.
Activity assay of isolated proteasomes
Cells were lysed with 25 mM HEPES, pH 7.4, 10% glycerol, 5 mM MgCl2, 1 mM ATP and 1:400 protease-inhibitor mixture (Calbiochem), homogenized through freeze–thaw cycles and passed through a needle (25G). The lysates were cleared by 30-min centrifugation at 21,130g at 4 °C. Protein concentration was assessed using a BC Assay Protein Quantitation Kit (Interchim). The immunoprecipitation was performed with Protein G–MagBeads (GeneScript) bound to PSMA1 proteasome subunit antibody, in a black 96-well plate and incubated overnight on an orbital shaker. The next day, the beads were washed three times in PBS and incubated in a reaction buffer (50 mM HEPES, pH 7.5, 1 mM dithiothreitol, 5 mM MgCl2 and 2 mM ATP). Proteasome activity was determined as previously described97, by cleavage of the fluorogenic precursor substrates Suc-Leu-Leu-Val-Tyr-AMC (Suc-LLVY-AMC) and Ac-Arg-Leu-Arg-AMC (Ac-RLR-AMC) (Bachem). The increase in fluorescence resulting from the degradation of peptide–AMC at 37 °C was monitored over time using a fluorometer (Synergy H1 Hybrid Multi-Mode Microplate Reader, BioTek) at 340 nm excitation and 460 nm emission. The resulting product curves were followed for up to 3.5 h. Each fluorescence intensity represents a mean value obtained from three or more independent experiments.
Secretome analysis by MS
Analysis of secreted peptides was performed as previously described98. In brief, A549 cells were washed twice with PBS and incubated in serum-free and phenol-red-free DMEM (Sartorius; 01-053-1 A) for 4 and 8 h. For dTAG secretome analysis, A549 cells expressing PPP1CB– and eGFP–dTAG (see above) were incubated in serum-free and phenol-red-free DMEM with DMSO or 500 nM of the dTAGV-1 compound for 6 h. Then, the medium was collected and a proteinase inhibitor (Calbiochem) was added. Then the medium was diluted in 80/20/0.1 ACN/H2O/formic acid (v/v/v) in a 1:7 ratio. Samples were vortexed and centrifuged at 14,000g at 4 °C 10 min. The supernatants were collected and dried. Peptides were then purified by C18 cartridges (Waters) and analysed by the LC–MS/MS as described above. The dTAG secretomes were analysed by MaxQuant (v.1.6.0.16). Identification of peptides in the A549 secretome was performed using FragPipe (v.22.0; MSFragger v.4.1, IonQuant v.1.10.27, Python v.3.8.13) according to the standard ‘non-specific-peptidome’ workflow with minor modifications. The raw data from both instruments were combined as two technical replicates per sample. The human reference proteome UP000005640 was used for peptide identification (uploaded 6 November 2024). The standard list of FragPipe contaminants was included. Methionine oxidation and N-terminal acetylation were used as variable modifications. Peptide length was set from 7 to 40 amino acids. The ‘split database’ parameter was set to 4 and match between runs (MBR) was used.
Notably, detection of PDDPs using peptidomics is challenging. Although MAPP-based proteasome profiling stabilizes peptides through cross-linking, enriches them through pull-down and achieves high purity and identification rates, extracellular peptidomics faces challenges owing to lower peptide stability, purity and identification rates caused by peptide variability, dynamic ranges and degradation factors. Furthermore, the overlap between MAPP and extracellular peptidomics is inherently limited, as PDDPs constitute less than 2% of proteasome-derived peptides and the extracellular environment reflects final stable peptide derivatives, often after additional cleavages. Therefore, only 11% of extracellular peptides are identical to MAPP-identified peptides, with 40% showing partial overlap, emphasizing the complementary yet distinct nature of these approaches (Fig. 2c).
Statistics and reproducibility
All experiments were performed at least twice, and in three biological replicates, unless otherwise stated. For each experiment, all compared conditions were analysed by MS at the same time to maintain comparability across samples and decrease batch effects.
Reporting summary
Further information on research design is available in the Nature Portfolio Reporting Summary linked to this article.
Responses