Cellular immune breadth of an Omicron-specific, self-amplifying monovalent mRNA vaccine booster for COVID-19

Introduction
The rollout of COVID-19 vaccines is marked as a major advancement in the battle against the pandemic. However, the ongoing emergence of new variants of severe acute respiratory syndrome coronavirus-2 (SARS-CoV-2) poses a significant challenge to global public health, raising concerns about the effectiveness of current vaccines1,2. To combat these new variants, booster vaccination strategies have been implemented to enhance and prolong vaccine-induced immunity3,4. Bivalent booster vaccines that were initially used to target both the ancestral SARS-CoV-2 and the Omicron variant, did not produce significantly higher antibodies specific to Omicron subvariants due to immune imprinting5. As a result, the US Food and Drug Administration has recommended monovalent vaccines as boosters based on animal and human studies6. Nonetheless, breakthrough infections with both the original virus and the Omicron variant have occurred, emphasizing the need to generate a diverse range of memory B-cells and T-cells7,8,9. This is crucial when selecting booster vaccine strategies to effectively recall the specific cellular reservoirs upon infection with new variants7,8,9,10,11,12.
Many factors influence the effectiveness of a vaccine, including the vaccine platform, immunogen design, formulation, adjuvant system, individual variations, delivery routes, vaccine doses, and dose intervals13. Self-amplifying mRNA (samRNA) vaccines can induce potent immune responses at lower vaccine doses due to their ability to amplify antigen production within the body, potentially reducing the risk of adverse reactions14,15. The ability of samRNA vaccines to mimic natural infection by continuously producing antigens makes them promising tools in developing highly immunogenic vaccines14,15,16. A recent study in Japanese adults reported a more robust and long-lasting immune response from the samRNA COVID booster vaccine at a lower dose than the nucleoside-modified BNT162b2 vaccine17. The intradermal vaccination strategy has been extensively studied against various viral diseases, and these studies have reported the dose-sparing effects of the intradermal route in inducing non-inferior immune responses. Taking these three crucial factors into account: first, a monovalent Omicron Spike-encoding vaccine; second, the samRNA platform; and third, the intradermal route of administration; we recently reported immunogenicity findings from a multicenter, open-label, randomized phase 2 and phase 3 study using GEMCOVAC-OM as a heterologous booster in healthy adults aged 18 years and older18. During this trial, no mRNA or Omicron-specific vaccines were available in India, and this was the regulatory recommendation to use the approved ChAdOx1 nCoV-19 vaccine as comparator arm. In contrast, mRNA vaccines, such as those developed by Pfizer-BioNTech and Moderna, were not approved or accessible within the country. Consequently, ChAdOx1 nCoV-19 was selected as the comparator to evaluate the immunogenicity of the Omicron-specific samRNA vaccine in this setting. Although, mRNA vaccines have demonstrated superior immunogenicity and durability in other contexts19,20,21,22; using ChAdOx1 nCoV-19 allowed us to directly assess the performance of a next-generation mRNA vaccine against the most relevant and widely deployed vaccine platform in India during the study period. This was especially relevant as prototype vaccines demonstrated reduced immunogenicity against Omicron lineages post-infection, emphasizing the need for Omicron-specific boosters23,24,25.
New SARS-CoV-2 variants evading the vaccine-induced protection emphasizes the limitation of cellular immunity in combating severe COVID-1926,27. This study investigates the cellular immune breadth following booster vaccinations with GEMCOVAC-OM and ChAdOx1 nCoV-19 in a multicentred open-label, randomized phase 3 study. This study seeks to unravel the persistence, quality, and comparative strengths of immune responses induced by distinct vaccine platforms post-booster administration, particularly against the Omicron lineages. The comprehensive nature of this study is crucial for advancing our understanding of the immune responses to booster vaccines against emerging variants, and it provides valuable information for ongoing and future vaccination strategies.
Results
Cellular immune responses were assessed in a total of 105 subjects, representing 25% of the immunogenicity cohort as per the clinical study protocol, detailed in the CONSORT diagram (Fig. 1). On day 1, PBMCs from 106 subjects were collected in a 1:2 ratio from the ChAdOx1 nCoV-19 and GEMCOVAC-OM cohorts at clinical sites. Subsequently, one subject from the GEMCOVAC-OM cohort withdrew consent. Focusing on the T-cell effector response as the proposed objective of the clinical study, we analyzed PBMCs from 105 subjects (ChAdOx1 nCoV-19, n = 35; GEMCOVAC-OM, n = 70). T-cell memory responses were also assessed in all 105 subjects on day 90 using the activation-induced markers (AIMs) assay. To evaluate the B-cell immune breadth against emerging SARS-CoV-2 variants, we conducted B-cell analysis on PBMC samples from 101 subjects (ChAdOx1 nCoV-19, n = 34; GEMCOVAC-OM, n = 67), as four samples were insufficient for the assays.

Cellular immune responses were assessed in 25% of the immunogenicity cohort.
Omicron B.1.1.529 Spike protein-specific memory B-cell responses
Omicron B.1.1.529 Spike protein-specific memory B-cell responses were assessed in PBMCs collected on day-1 (before the vaccine), day-29 (4 weeks post boost) and day-90 (3 months post boost) using multi-parametric flow cytometry (Fig. 2a). The cohort immunized with ChAdOx1 nCoV-19 exhibited a notable increase in circulatory non-naïve B-cells (CD19+ CD20+ IgDlo CD27+ Cells) specific to the Omicron B.1.1.529 Spike protein at both day-20 (p = 0.001 vs day-1) and day-90 (p = 0.001 vs day-1 and p = 0.016 vs day-29; Fig. 2b; Supplementary Information, Supplementary Fig. 1a–c). GEMCOVAC-OM immunized groups also displayed significantly elevated non-naïve B-cells specific to the Omicron B.1.1.529 Spike protein at both day-29 (p < 0.001 vs day-1) and day-90 (p = 0.016 vs day-1 and day-29; Fig. 2b; Supplementary Information, Supplementary Fig. 1j–l). GEMCOVAC-OM cohort demonstrated significantly higher levels of Spike+ non-naïve B-cells than the ChAdOx1 nCoV-19 cohort at both day-29 (p < 0.001) and day-90 (p = 0.021; Fig. 2b). ChAdOx1 nCoV-19 cohort showed a notable increase (p < 0.001 vs day-1) in Omicron B.1.1.529 Spike+ plasmablasts (PBs) (B.1.1.529-Spike+ CD19+ CD20+ IgDlo CD27+ CD38+ Cells; Fig. 2c; Supplementary Information, Supplementary Fig. 1d–f) at both day-29 and day-90 time points. Similarly, the GEMCOVAC-OM vaccinated groups exhibited significantly higher (p < 0.001 vs day-1) B.1.1.529-Spike+ PBs at both day-29 and day-90 (Fig. 2c, Supplementary Information, Supplementary Fig. 1m–o). GEMCOVAC-OM cohort also showed significantly higher (p = 0.005) B.1.1.529-Spike+ PBs at day-29 (Fig. 2c). In the subset analysis of non-naïve B-cells, we quantified B.1.1.529-Spike+ CD19+ CD20+ IgDlo CD27+ CD38+/lo cells, identifying them as Omicron B.1.1.529 Spike protein-specific memory B-cells (MBCs). ChAdOx1 nCoV-19 cohort exhibited a significant increase in circulating MBCs specific to the Omicron B.1.1.529 Spike protein at both day-29 (p = 0.002 vs day-1) and day-90 (p < 0.001 vs day-1 and p = 0.007 vs day-29) (Fig. 2d, Supplementary Information, Supplementary Fig. 1d–f). GEMCOVAC-OM vaccinated groups displayed significantly higher Omicron B.1.1.529 Spike protein-specific circulatory MBCs at both day-29 (p < 0.001 vs day-1) and day-90 (p < 0.001 vs day-1; Fig. 2d, Supplementary Information, Supplementary Fig. 1m–o). Moreover, the GEMCOVAC-OM cohort demonstrated significantly elevated levels of Omicron B.1.1.529 Spike-specific circulatory MBCs compared to the ChAdOx1 nCoV-19 cohort at both day-29 (p < 0.001 vs day-29) and day-90 (p = 0.018 vs day-90; Fig. 2d), underscoring the heightened Omicron Spike-specific memory B-cell response elicited by GEMCOVAC-OM. Resting MBCs (rMBCs) retain a memory of the encountered antigen, enabling a quicker and more robust response upon re-exposure to the same antigen28,29. While not actively producing antibodies, rMBCs serve as a reservoir of immunological memory, ready to rapidly differentiate into antibody-producing plasma cells or effector cells upon encountering the antigen again, thus aiding in mounting a faster and more effective immune response28,29. Therefore, we have also quantified Omicron B.1.1.529 Spike-specific rMBCs marked as B.1.1.529-Spike+ CD19+ CD20+ IgDlo CD27+ CD38+/lo CD20+ cells. ChAdOx1 nCoV-19 cohort exhibited a significant increase in circulating rMBCs specific to the Omicron B.1.1.529 Spike protein at both day-29 (p = 0.075 vs day-1) and day-90 (p = 0.007 vs day-1) (Fig. 2e, Supplementary Information, Supplementary Fig. 1p–r). GEMCOVAC-OM vaccinated groups displayed significantly higher Omicron B.1.1.529 Spike protein-specific circulatory rMBCs at both day-29 (p < 0.001 vs day-1) and day-90 (p < 0.001 vs day-1; Fig. 2e, Supplementary Information, Supplementary Fig. 1p–r). Notably, the GEMCOVAC-OM immunized cohort showed a significant increase in Spike-specific rMBCs at day-29 -time point as compared to the ChAdOx1 nCoV-19 cohort (p = 0.032; Fig. 2e, Supplementary Information, Supplementary Fig. 1p–r). All B-cell subset populations were non-significant at baseline between both ChAdOx1 nCoV-19 and GEMCOVAC-OM cohorts (Fig. 2b–e). We have also tested the confounding effects contributed by age, gender, and previous vaccine arm. For Omicron B.1.1.529 Spike protein-specific MBCs, unadjusted estimate for GEMCOVAC-OM booster was 0.2593 (95% CI 0.0372-0.4813, p = 0.0226) and adjusted estimate (adjusted for previous vaccine arm, gender and age) for GEMCOVAC-OM booster was 0.2416 (95% CI 0.0102–0.4729, p = 0.0409). Since there is no significant difference between unadjusted and adjusted estimates of the booster, conclude that the possibility of confounding effects by previous vaccine arm, gender, and age are not likely to be present. Moreover, the p values for an estimate of the previous vaccine arm (0.4460), for an estimate of gender (0.8282), and for an estimate of age (0.3767) obtained from the multiple regression analysis confirmed the absence of cofounding effects of these variables on MBCs response.
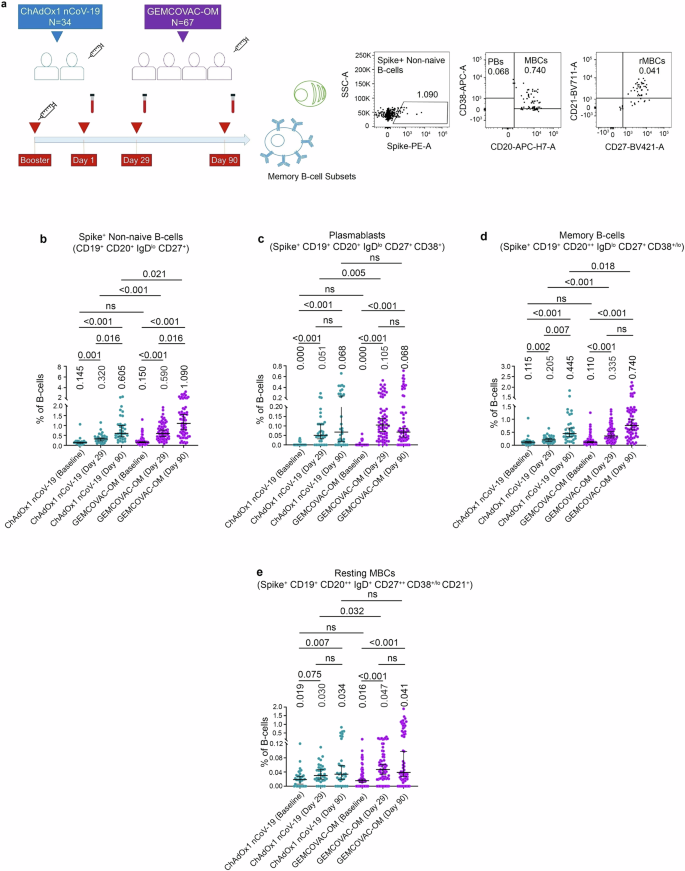
a Experimental design. Blood samples were collected before vaccine booster (day-1), day-29, and day-90. Representative dot plots showing gates for B.1.1.529 Spike+ non-naive B-cells, PBs, MBCs, and rMBCs. b B.1.1.529 Spike-specific non-naïve B-cells gated as the frequency of IgDloCD27+B.1.1.529 Spike+ cells in CD3–CD19+CD20+ B-cells. c B.1.1.529 Spike-specific PBs gated as the frequency of IgDloCD27+B.1.1.529 Spike+ CD38+ cells in CD3–CD19+CD20+ B-cells. d B.1.1.529 Spike-specific MBCs gated as the frequency of IgDloCD27+B.1.1.529 Spike+CD38+/lo cells in CD3–CD19+CD20+ B-cells. e B.1.1.529 Spike-specific rMBCs gated as frequency of IgDloCD27+B.1.1.529 Spike+CD38+/loCD21+ cells in CD3–CD19+CD20+ B-cells. The data were presented as median with interquartile range. Statistical comparisons within the cohorts and between the cohorts were performed by using Friedman test and Mann–Whitney test, respectively. p values are shown to represent statistical comparison within or between GEMCOVAC-OM and ChAdOx1 nCoV-19 booster cohorts.
Cross-reactive B-cell responses against XBB.1.5 and BA.2.86 Spike protein
To examine B-cell breadth following GEMCOVAC-OM and ChAdOx1 nCoV-19 boosters, we assessed the Omicron XBB.1.5 and BA.2.86 Spike cross-reactive B-cells at day-90 (Fig. 3a). Notably, individuals boosted with GEMCOVAC-OM exhibited significantly higher circulating XBB.1.5 and BA.2.86 reactive B cells compared to ChAdOx1 nCoV-19 booster group (p < 0.0001; Fig. 3b, c). In contrast, the wild-type Spike-encoding ChAdOx1 nCoV-19 booster elicits minimal XBB.1.5 and BA.2.86 reactive B cells (Fig. 3b, c). We assessed antibody titers targeting the Spike protein of the XBB.1.5 variant at the 90-day time point using the pseudovirus neutralization test (pVNT). The results indicate that the GEMCOVAC-OM cohort exhibited significantly higher levels of XBB.1.5-specific neutralizing antibodies (4.5 times), compared to the ChAdOx1 nCoV-19 cohort (p < 0.009; Fig. 3d). This finding is consistent with the presence of a cross-reactive B-cell population. We also examined the correlation between B.1.1.529 B-cell subsets with XBB.1.5 and BA.2.86 cross-reactive B cells (Fig. 3e, f). Notably, in the ChAdOx1 nCoV-19 boosted cohort, B.1.1.529 Spike+ PBs significantly correlated positively with B.1.1.529, XBB.1.5, and BA.2.86 Spike reactive B cells (Fig. 3e). XBB.1.5 Spike reactive B cells significantly correlated positively with non-naïve and MBC subsets of B.1.1.529 Spike+ B cells in both the booster cohorts (Fig. 3e, f). In contrast, in the GEMCOVAC-OM booster group, BA.2.86 Spike reactive B cells positively correlated with B.1.1.529 Spike+ MBC subsets and XBB.1.5 Spike reactive B cells (Fig. 3f).
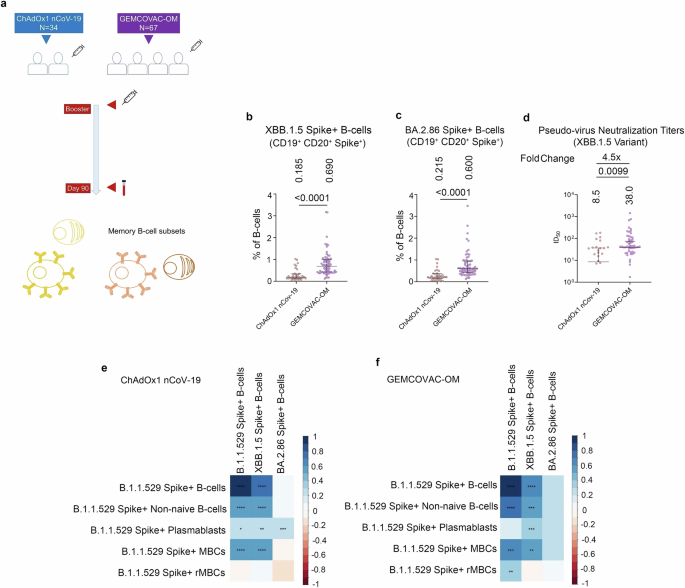
a Experimental design. Cross-reactive B-cell responses against XBB.1.5 and BA.2.86 Spike protein were assessed in PBMCs from day-90. b Total XBB.1.5 Spike reactive B-cells gated as frequency in CD3–CD19+CD20+ B-cells. c Total BA.2.86 Spike reactive B-cells gated as frequency in CD3–CD19+CD20+ B-cells. d Pseudovirus neutralization titers at day-90 time points harboring the Spike protein of XBB.1.5. The data were presented as median with interquartile range. Statistical comparison was performed by using the Mann–Whitney test. p values are shown to represent statistical comparison within or between GEMCOVAC-OM and ChAdOx1 nCoV-19 booster cohorts. e, f Spearman correlation between B.1.1.529 Spike-specific B-cell subsets and B.1.1.529, XBB.1.5, and BA.2.86 Spike+ B-cells in ChAdOx1 nCoV-19 (e) and GEMCOVAC-OM (f) cohorts. In corrplot, the blue boxes represent positive correlations and the red boxes represents negative correlation. Significant correlations were represented as an asterisk in the boxes. *P < 0.05, **P < 0.01, ***P < 0.001, and ****P < 0.0001.
MBC breadth against XBB.1.5 and BA.2.86 Spike protein
To further examine the breadth of B-cell response, we assessed the Omicron XBB.1.5 and BA.2.86 Spike reactive memory B-cell compartment in the PBMCs samples from day-90 (Fig. 4a). We noted significantly elevated levels of XBB.1.5 Spike reactive non-naïve B-cells (p < 0.0001; Fig. 3b), MBCs (p < 0.0001; Fig. 4d), and rMBCs (p = 0.0044; Fig. 4e; Supplementary Information, Supplementary Fig. 2a–l) in the GEMCOVAC-OM immunized group compared to the ChAdOx1 nCoV-19 cohort. Similarly, we noted significantly elevated levels of BA.2.86 Spike reactive non-naïve B-cells (p < 0.0001; Fig. 4f), MBCs (p < 0.0001; Fig. 4h), and rMBCs (p = 0.0006; Fig. 4i; Supplementary Information, Supplementary Fig. 2m–r) in the GEMCOVAC-OM immunized group compared to the ChAdOx1 nCoV-19 cohort. No difference in XBB.1.5 and BA.2.86 Spike reactive PBs was observed in both the immunization cohorts (Fig. 4c, g; Supplementary Information, Supplementary Fig. 2). We also examined the correlation between XBB.1.5 and BA.2.86 Spike reactive MBC subsets and B.1.1.529 Spike-specific MBC subsets from both the vaccine cohorts (Fig. 4j, k). XBB.1.5 Spike+ non-naïve B-cells and XBB.1.5 Spike+ MBCs showed a significant positive correlation with B.1.1.529 Spike+ non-naïve B-cells and B.1.1.529 Spike+ MBCs in both vaccine cohorts (Fig. 4j, k). Notably, in the ChAdOx1 nCoV-19 cohort, these XBB.1.5 Spike reactive B-cells also correlated positively with B.1.1.529 Spike+ PBs (Fig. 4j), while in the GEMCOVAC-OM cohort, they correlated positively with B.1.1.529 Spike+ resting MBCs (rMBCs) (Fig. 4k). Additionally, XBB.1.5 Spike+ rMBCs in the ChAdOx1 nCoV-19 cohort correlated positively with B.1.1.529 Spike+ rMBCs and negatively with B.1.1.529 Spike+ PBs (Fig. 4j). In the GEMCOVAC-OM cohort, XBB.1.5 Spike+ rMBCs showed positive correlations with B.1.1.529 Spike+ non-naïve B-cells, B.1.1.529 Spike+ MBCs, and B.1.1.529 Spike+ rMBCs, but negatively correlated with B.1.1.529 Spike+ PBs (Fig. 4k). Furthermore, XBB.1.5 Spike+ PBs demonstrated positive correlations with B.1.1.529 Spike+ non-naïve B-cells and B.1.1.529 Spike+ PBs in both vaccine cohorts (Fig. 4j, k). No significant correlations were observed between BA.2.86 Spike+ B-cells and B.1.1.529 Spike+ memory B-cell subsets in the ChAdOx1 nCoV-19 cohort (Fig. 4j); however, BA.2.86 Spike+ rMBCs showed a significant positive correlation with B.1.1.529 Spike+ rMBCs in the GEMCOVAC-OM cohort (Fig. 4k). Aforementioned B-cell subset analysis was performed using manual gating based on their surface markers. We then combined these markers or subsets with a t-distributed stochastic neighbor embedding (tSNE) dimensionality reduction algorithm to gain a global picture of the different variant spike reactive B cell subsets. In these tSNE maps, B.1.1.529 (blue), XBB.1.5 (yellow), and B.2.86 (orange) B-cell clusters displayed a higher distribution of spike-specific B cells (red dots) occupying the CD27, CD38, and CD21 spaces in the GEMCOVAC-OM cohort compared to the ChAdOx1 nCoV-19 cohort (Fig. 4l–m).
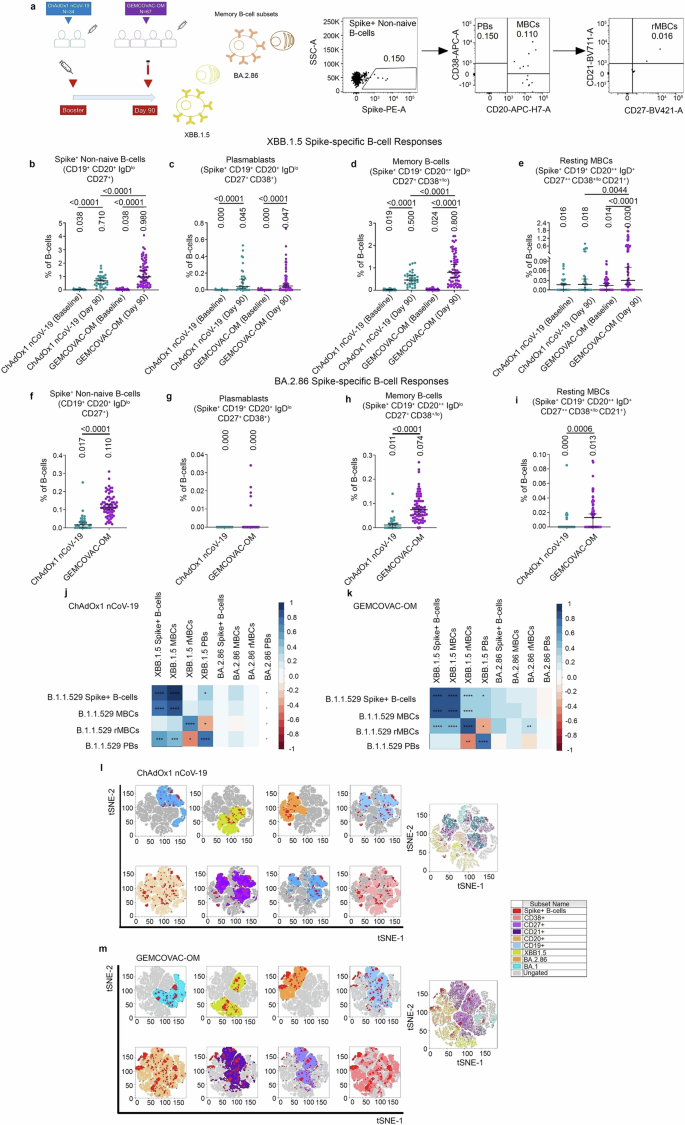
a Experimental design. Cross-reactive MBC responses against XBB.1.5 Spike protein were assessed in PBMCs from day-1 (baseline) and day-90. Cross-reactive MBC responses against BA.2.86 Spike protein were assessed in PBMCs from the day-90 study time point. Representative dot plots showing gates for XBB.1.5 and BA.2.86 Spike+ non-naive B-cells, PBs, MBCs, and rMBCs. b XBB.1.5 Spike reactive non-naïve B-cells c XBB.1.5 Spike reactive PBs. d XBB.1.5 Spike reactive MBCs. e XBB.1.5 Spike reactive rMBCs. f BA.2.86 Spike reactive non-naïve B-cells. g BA.2.86 Spike reactive PBs. h BA.2.86 Spike reactive MBCs i, BA.2.86 Spike reactive rMBCs. The data were presented as median with interquartile range. Statistical comparison was performed by using the Mann–Whitney test to compare XBB.1.5 reactive B-cell subsets. and BA.2.86 reactive B-cell subsets. p values are shown to represent statistical comparison within or between GEMCOVAC-OM and ChAdOx1 nCoV-19 booster cohorts. j, k Spearman correlation between B.1.1.529 Spike-specific B-cell subsets and XBB.1.5 and BA.2.86 Spike reactive B-cell subsets in ChAdOx1 nCoV-19 (j) and GEMCOVAC-OM (k) cohorts. In corrplot, the blue boxes represent positive correlations and the red boxes represents negative correlation. Significant correlations were represented as an asterisk in the boxes. *P < 0.05, **P < 0.01, ***P < 0.001, and ****P < 0.0001. l, m tSNE maps display the distribution of Spike+ B cells (red dots) in B.1.1.529 (blue), XBB.1.5 (yellow), and B.2.86 (orange) B-cell experimental clusters having CD27, CD38, and CD21 memory markers spaces in the ChAdOx1 nCoV-19 (l) and GEMCOVAC-OM (m) cohorts.
Omicron Spike protein-specific poly-functional T-cell responses (PFR)
To evaluate T-cell responses, PBMCs from day-90 were stimulated with an overlapping 15-mer peptides of the SARS-CoV-2 Omicron B.1.1.529 Spike protein (PepTivator®). Earlier, we have reported the effector T-cell responses induced by GEMCOVAC-OM18. COMPASS R Package30,31 was used to compute functionality scores and poly-functionality scores for CD4+ and CD8+ T-cell subsets expressing boolean combinations of IL2, TNFα, and IFNγ from two cohorts (GEMCOVAC-OM and ChAdOx1 nCoV-19) against Omicron B.1.1.529 variant. A heat-map of subset-specific posterior probabilities for CD4+ T-cells is given in Supplementary Information, Supplementary Fig. 3a and for CD8+ T-cells in Supplementary Information, Supplementary Fig. 3b. The heat-maps for CD4+ T-cells and CD8+ T-cells illustrate greater degree of poly-functionality in GEMCOVAC-OM cohort than ChAdOx1 nCoV-19 cohort. The boxplots of functionality scores and poly-functionality scores of the GEMCOVAC-OM cohort and ChAdOx1 nCoV-19 cohort are presented in Supplementary Information, Supplementary Fig. 3c. The p value from Mann–Whitney test performed to compare the functionality scores of two groups i.e., ChAdOx1 nCoV-19 and GEMCOVAC-OM for CD4 + T-cells was <0.001 and that for CD8 + T-cells was <0.001. Thus, in all cases, the median of GEMCOVAC-OM cohort was significantly different (at higher side) that the ChAdOx1 nCoV-19 cohort indicating higher degree of T-cell poly-functionality post GEMCOVAC-OM booster.
Omicron Spike protein-specific memory T-cell responses
To further confirm the memory T-cell formation, we measured SARS-CoV-2 Omicron Spike-specific memory T-cell responses at day-90 using activation-induced marker (AIM) assay (Fig. 5a). CD4+OX40+CD137+ cells were identified as AIM+ helper T-cells (Fig. 5b) and CD8+CD69+CD137+ cells were identified as AIM+ cytotoxic T-cells (Fig. 5c). GEMCOVAC-OM elicited significantly higher levels of Omicron Spike-specific AIM+ T-cells, including both CD4+ and CD8+ T-cell subsets (p < 0.0001), compared to the ChAdOx1 nCoV-19 booster (Fig. 5b–e). We have also tested the confounding effects of age, gender, and previous vaccine arm on AIM+ T-cells. For CD4+ T-cell response, the unadjusted estimate for GEMCOVAC-OM booster was 0.2540 (95% CI 0.1964-0.3116, p < 0.001), and the adjusted estimate (adjusted for previous vaccine arm, gender, and age) for GEMCOVAC-OM booster was 0.2513 (95% CI 0.1935-0.3092, p < 0.001). No significant change in the values of unadjusted and adjusted estimates of the GEMCOVAC-OM booster indicated that the possibility of confounding effects is negligible. The p values for estimate of previous vaccine arm (0.7538) and for the estimate of age (0.1065) obtained from the multiple regression analysis confirmed the absence of cofounding effects of these variables. However, the p value for the estimate of gender was found to be statistically significant (0.0058), suggesting gender as a possible confounder (male-biased) for CD4+ T-cell response. For CD8+ T-cell response, unadjusted estimate for GEMCOVAC-OM booster was 0.6289 (95% CI 0.3436–0.9142, p < 0.001) and adjusted estimate (adjusted for previous vaccine arm, gender, and age) for GEMCOVAC-OM booster was 0.6467 (95% CI 0.3491–0.9443, p < 0.001). No significant change in the values of unadjusted and adjusted estimates of booster indicated that the possibility of confounding effects is negligible. Moreover, the p values for the estimate of the previous vaccine arm (0.4986), for the estimate of gender (0.4316), and for the estimate of age (0.9118) obtained from the multiple regression analysis confirmed the absence of cofounding effects of these variables on CD8+ T-cell response.
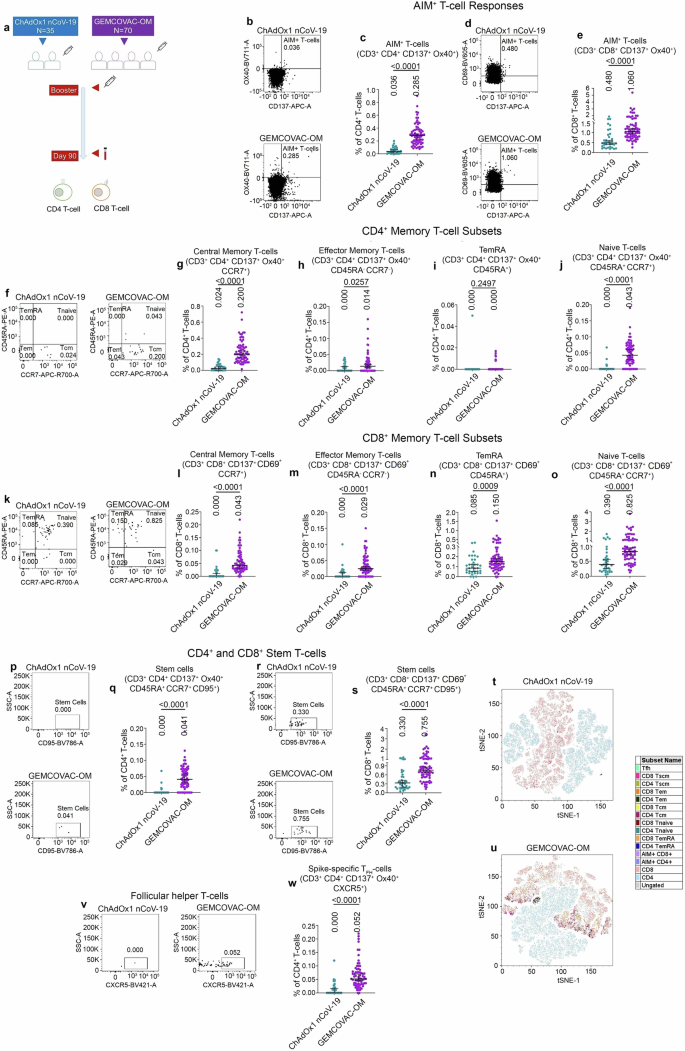
a Experimental design. Omicron B.1.1.529 specific memory T-cell responses were assessed using AIMs assay in the PBMCs from day-90. b Representative dot plots showing gates for CD4+ T-cells, CD8+ T-cells, CD137+Ox40+, or AIMs+ CD4 T-cells. c Total AIMs+ CD4+ T-cells. d Representative dot plots showing gates for CD137+CD69+ or AIMs+ CD8+ T-cells. e Total AIMs+ CD8 T-cell. f Representative dot plots showing gates for central memory CD4+ T-cells (CD4+ Tcm), effector memory CD4+ T-cells (CD4+ Tem), terminal effective RA+ (CD4+ TemRA) and Naive CD4+ T-cells (CD4+ Tnaive). g–j Total CD4+ Tcm (g), CD4+ Tem (h), CD4+ TemRA (i), and CD4+ Tnaive (j), cell frequency as % of grandparent CD4+ T-cell gate. k Representative dot plots showing gates for central memory CD8+ T-cells (CD8+ Tcm), effector memory CD8+ T-cells (CD8+ Tem), terminal effective RA+ (CD8+ TemRA) and Naive CD8+ T-cells (CD8+ Tnaive). l–o Total CD8+ Tcm (l), CD8+ Tem (m), CD8+ TemRA (n), and CD8+ Tnaive (o), cell frequency as % of grandparent CD8+ T-cell gate. p Representative dot plots showing gates for stem T-cells (CD4+ Tscm). q Total CD4+ Tscm cell frequency as % of CD4+ T-cell gate. r Representative dot plots showing gates for CD8+ stem T-cells (CD8+ Tscm). s Total CD8+ Tscm cell frequency as % of CD8+ T-cell gate. t, u tSNE maps display distribution of Omicron B.1.1.529 Spike-specific memory T-cell sub-populations in CD4+ T-cell and CD8+ T-cell clusters in the ChAdOx1 nCoV-19 (t) and GEMCOVAC-OM (u) cohorts. v Representative dot plots showing gates for follicular helper CD4+ T-cells (CD4+ TFH). w Total CD4+ TFH cell frequency as % of CD4+ T-cell gate. The data were presented as median with interquartile range. Statistical comparison was performed by using the Mann–Whitney test. p values are shown to represent statistical comparison within or between GEMCOVAC-OM and ChAdOx1 nCoV-19 booster cohorts.
Analysis of memory T-cell populations based on CD45RA and CCR7 expression revealed significantly greater Omicron Spike-specific central memory (p < 0.0001) and effector memory (p = 0.0257) CD4+ T-cells in subjects who received the GEMCOVAC-OM booster compared to those who received the ChAdOx1 nCoV-19 booster (Fig. 5f–h). Omicron Spike-specific central memory CD4+ T-cells were predominantly induced following GEMCOVAC-OM immunization (Fig. 5f, g). Similarly, recipients of the GEMCOVAC-OM booster exhibited significantly elevated levels of Omicron Spike-specific central memory (p < 0.0001), effector memory (p < 0.0001), and terminally differentiated RA+ (TemRA; p = 0.0009) CD8+ T-cells compared to those who received ChAdOx1 nCoV-19 (Fig. 5k–n). GEMCOVAC-OM induced nearly equivalent levels of Omicron Spike-specific central and effector memory CD8+ T-cells (Fig. 5k–m). In addition, we also observed significantly higher CD45RA+CCR7+ naïve CD4+ and CD8 + T-cells (p < 0.0001) in the GEMCOVAC-OM cohort (Fig. 5f, j, k, o). GEMCOVAC-OM booster also led to significantly higher levels of omicron-specific CD45RA+CCR7+CD95+ stem T-cells in both CD4+ and CD8+ T-cell (p < 0.0001) subsets (Fig. 5p–s). We again performed a tSNE clustering analysis to visualize the T-cell memory distribution in both T-cell clusters. These memory clusters were found to be minimal in the ChAdOx1 nCoV-19 cohort (Fig. 5t, Supplementary Information, Supplementary Fig. 4a). However, we observed higher scattered clusters of Spike-specific Tcm, Tem, Tscm, and AIMs in both T-cell subsets in GEMCOVAC-OM cohort (Fig. 5u, Supplementary Information, Supplementary Fig. 4b). The GEMCOVAC-OM cohort exhibited significantly higher levels of Omicron Spike-specific circulating follicular helper T-cells (p < 0.0001) compared to the ChAdOx1 nCoV-19 cohort (Fig. 5v–w).
Discussion
In this study, we evaluated the immunogenicity of GEMCOVAC-OM, encoding the Omicron Spike protein, as a heterologous booster compared to the ChAdOx1 nCoV-19 vaccine. GEMCOVAC-OM demonstrated superior memory B-cell and T-cell responses, which are crucial for rapid and effective immune reactions to new variants. Notably, the GEMCOVAC-OM booster elicited robust Omicron-specific memory T-cells, indicating a significant advantage over ChAdOx1 nCoV-19 in providing sustained protection against SARS-CoV-2.
Comparative studies of vaccine platforms indicate that mRNA vaccines elicit stronger and more durable SARS-CoV-2 Spike-specific immune responses compared to adenovector-based vaccines19,20,21,22. Similar trends were observed for Omicron variants23,24,25. A preclinical study of adenovector vaccines showed that monovalent vaccines elicited high neutralizing titers against the matched strain but reduced responses to other variants, whereas bivalent vaccines containing omicron spike broadened the immune response to some extent, albeit less effectively against newer Omicron subvariants like XBB32. Notably, mRNA vaccines induced 2.1 times higher memory B cell proliferation than adenovector vaccines33. Further, within mRNA platforms, samRNA vaccines have demonstrated advantages over nucleoside-modified mRNA vaccines, including higher and more durable antibody titers, as well as cross-reactive immunity against BA.4/BA.5 and XBB.1.5 variants34,35. These findings highlight the combined importance of variant-specific inserts and vaccine platforms in driving broad and durable immune responses. Moreover, samRNA vaccines, which require lower doses of mRNA, could enhance global vaccine equity while maintaining comparable or superior immunogenicity to conventional mRNA vaccines. Thus, studying immunogenicity at the cellular level was crucial to understand the breadth and durability of immunity conferred by samRNA vaccines. In this study, we have evaluated the breadth of cellular immune response induced by two vaccines: adenovector-based ChAdOx1 nCoV-19, which encodes the Spike protein of the original Wuhan strain, and samRNA-based monovalent vaccine GEMCOVAC-OM, which encodes the Omicron B.1.1.529 Spike protein. We examined the Omicron B.1.1.529 Spike protein-specific B-cells at day-1, day-29, and day-90 time points during the Phase-III study of GEMCOVAC-OM18. With a focus on B-cell breadth analysis, our initial objective was to measure the formation of Omicron B.1.1.529 Spike-specific memory following booster doses of ChAdOx1 nCoV-19 and GEMCOVAC-OM. Briefly, we analyzed memory cell responses in PBMCs collected from the Phase-III clinical study. MBC analysis indicated that the variant-specific GEMCOVAC-OM booster dose generated significant Omicron B.1.1.529 Spike reactive MBC reservoir as compared to ChAdOx1 nCoV-19 vaccine booster. The MBC reservoir responded rapidly to SARS-CoV-2 variants, prompting the need to examine the cross-reactive B-cells or B-cell breath after both vaccines. Individuals vaccinated with GEMCOVAC-OM had similar levels of circulating XBB.1.5 and BA.2.86 Spike reactive B cells to those observed with Omicron B.1.1.529 variants. However, ChAdOx1 nCoV-19 immunization generated minimal XBB.1.5 and BA.2.86 Spike reactive B cells. The observed significantly higher levels of XBB.1.5-specific neutralizing antibodies in the GEMCOVAC-OM cohort suggest a robust immune response against this variant, likely driven by enhanced cross-reactivity within the B-cell population. These findings underscore the potential of samRNA vaccine GEMCOVAC-OM in providing B-cell immune breadth. The GEMCOVAC-OM cohorts also showed significantly higher levels of XBB.1.5 and BA.2.86 Spike reactive MBCs. These observations indicate that the B-cell immune breadth generated by GEMCOVAC-OM extends and is beneficial to variants with greater antigenic differences. However, the quantitative abundance of BA.2.86 reactive MBCs was almost ten times lower compared to Omicron B.1.1.529 reactive MBCs. A positive correlation between Omicron B.1.1.529 Spike reactive MBCs and XBB.1.5 and BA.2.86 reactive MBCs in the GEMCOVAC-OM cohort suggested a comprehensive interconnected B-cell response and breadth. These findings underscored the advantage of GEMCOVAC-OM over ChAdOx1 nCoV-19 in confronting recent SARS-CoV-2 variants.
T-cells, a key component of cellular immunity, can recognize and respond to various parts of the virus, not just the specific regions targeted by antibodies. This cross-reactivity allows them to acknowledge and combat new variants, even if these variants have mutations in regions targeted by antibodies36. Cellular immune responses, particularly T-cell responses, may be less affected by mutations in the virus compared to antibody-based immunity37. This adaptability can provide protection against a broader range of variants. Memory T-cells can persist for an extended period, contributing to long-term protection against COVID-19 and potentially reducing the severity of illness upon subsequent exposures, including new variants38,39,40. At day-90, robust poly-functional T-cell responses in the GEMCOVAC-OM immunized group, as compared to the ChAdOx1 nCoV-19 cohort, suggested durable T-cell responses. Notably, TNFα and IL-2α alone expressing T-cells were also elevated in the GEMCOVAC-OM immunized group, suggesting memory T-cell formation. To delve deeper into memory T-cell responses, we conducted AIM assays on day-90. Our analysis revealed markedly elevated levels of Omicron Spike-specific AIM-positive T-cells in the GEMCOVAC-OM booster group compared to the ChAdOx1 nCoV-19 group. Within the T-cell memory compartment, the GEMCOVAC-OM booster group exhibited substantially heightened levels of effector and central memory CD4+ and CD8+ T-cells specific to Omicron. Stem T-cells possess unique properties that contribute to durable immunity, serving as a reservoir for the replenishment of effector and memory T-cell populations over time41. Importantly, the robust induction of these stem T-cells by GEMCOVAC-OM suggests a mechanism for sustained protection against Omicron and potentially other variants. A limitation of this study is that GEMCOVAC-OM was administered via the intradermal route, while ChAdOx1 nCoV-19 was given intramuscularly, which limits the assessment of the impact of administration route on cellular immunogenicity.
In conclusion, GEMCOVAC-OM booster immunization elicits a broader Omicron-specific cellular immune responses compared to ChAdOx1 nCoV-19. This study underscores the potential of the intradermally administered samRNA GEMCOVAC-OM vaccine in generating durable and broad cellular immunity against emerging SARS-CoV-2 variants. These findings represent a significant advancement in vaccine development to effectively combat emerging virus variants.
Methods
Materials
Listed in Supplementary Table 1.
Study participants
Study participants were from a multicentre, randomized phase 3 study as reported previously18. This was a prospective, multicenter, open-label, randomized phase 2/3 study to assess the safety, tolerability, and immunogenicity of GEMCOVAC-OM as a booster in adults aged 18 and older. In the seamless design, phase 2 safety data up to day 7 were reviewed by an independent Data Safety Monitoring Board (DSMB), which approved the transition to phase 3. The phase 3 study was conducted at 20 hospitals across 13 cities in India, in compliance with the Declaration of Helsinki and ICH-GCP guidelines. The study protocol was approved by the Central Drugs Standard Control Organization (central licensing authority) and the local Ethics Committees of each study site. This clinical trial is registered with the Clinical Trial Registry India, registration number CTRI/2022/10/046475, dated October 14, 2022. The participants were recruited between November 15, 2022, and November 24, 2022, Briefly, phase 3 study comprised a safety cohort and an immunogenicity cohort, with a total of 3140 subjects, of which 3000 were assigned to the GEMCOVAC-OM arm and 140 to the ChAdOx1 nCoV-19 arm. Within the safety cohort, the immunogenicity cohort consisted of 420 participants, with 280 enrolled in the GEMCOVAC-OM arm and 140 in the ChAdOx1 nCoV-19 arm, as per the clinical study protocol. Eligibility criteria included healthy adults aged 18 years or older, having received two doses of either BBV152 or ChAdOx1 nCoV-19 at least 4 months before the screening visit, and without any documented COVID-19 infection at least 3 months prior. Randomization into the GEMCOVAC-OM and ChAdOx1 nCoV-19 arms was conducted at a 2:1 ratio through stratified block randomization using the IWRS. Cellular immune responses were assessed subset population (25% of participants from each arm) in accordance with the clinical study protocol as shown in CONSORT diagram (Fig. 1).
Vaccines
GEMCOVAC-OM, a thermostable self-amplifying mRNA vaccine, encodes the Spike protein of the Omicron B.1.529 variant of SARS-CoV-2, with its complete antigenic sequence published in the DDBJ database (Accession no. – LC769018). Administered intradermally at a dose of 10 µg in 0.1 mL volume. GEMCOVAC-OM utilized the Tropis® needle-free injection system (PharmaJet®, USA) for intradermal delivery.
The comparator vaccine, ChAdOx1 nCoV-19 (COVISHIELD), consisted of 5 × 10¹⁰ viral particles of corona virus vaccine based on a recombinant, replication-deficient chimpanzee adenovirus vector encoding the Spike protein of the prototype Wuhan variant of SARS-CoV-2. ChAdOx1 nCoV-19 was administered intramuscularly.
PBMC isolation
PBMC were isolated using BD Vacutainer® CPT™ (Cell Preparation Tube) with sodium citrate following standard protocols. Briefly, whole blood was collected into CPT tubes and centrifuged at 1800×g for 20 min at room temperature. The PBMC layer was carefully aspirated, transferred into a sterile tube, and washed twice with phosphate-buffered saline (PBS). Following the RBC lysis and washes, the PBMCs were cryopreserved in 90% heat-inactivated fetal bovine serum (FBS) and 10% dimethyl sulfoxide (DMSO) media. Aliquots of the PBMC suspension were then transferred into cryovials, gradually cooled to −80 °C, and subsequently transferred to liquid nitrogen for long-term cryopreservation. For cellular immune response assessments, frozen PBMCs were thawed and revived in complete RPMI 1640 culture medium (cRPMI) supplemented with 10% FBS, 100 U/ml penicillin, and 0.1 mg/ml streptomycin (1X pen-strep) in CO2 incubator at 37 °C and 5% CO2 for 18–22 h.
B-cell experiments
To evaluate the B-cell population specific to the variant’s Spike protein, PBMCs were labeled with fluorescent tagged either Omicron B.1.1.529, XBB.1.5 or BA.2.86 Spike protein probes (Supplementary Information, Supplementary Table 1) followed by surface staining using B-cell panel CD3 BV605 (BD 563219, clone SK7, 1:20), CD19 PerCP-Cy5.5 (BD 561295, clone HIB19, 1:20), CD20 APC-H7 (BD 560734, clone 2H7, 1:20), CD27, CD21, CD38, and IgD. After staining and washing procedures, PBMCs were suspended in FACS buffer, acquired in the FACSLyric™ system (BD Biosciences), and analyzed with FlowJo software version 10.8.1 (FlowJo LLC, BD Biosciences). tSNE (t-distributed stochastic neighbor embedding) was performed by concatenating the fcs files from all three B.1.1.529, XBB.1.5, and BA.2.86 B-cell experiments. Spike-specific memory B-cell populations were visualized by downsampling CD3–CD19+CD20+IgD–CD27+ non-naïve B-cell. The gating strategies for B-cell experiments were applied as described previously42, according to the specific population of interest Supplementary Information, Supplementary Fig. 5a.
T-cell effector assay
In the T-cell effector assay, intracellular cytokine staining (ICS) was performed using 0.5 million PBMCs in 100 µL CRPMI medium per well in a V-bottom plate18. Cells were stimulated with 1 µg/ml epitope mapping 15-mer Omicron PepTivator® SARS-CoV-2 Prot S B.1.1.529/BA.1 Mutation Pool (Supplementary Information, Supplementary Table 1). Stimulation was carried out in the presence of 1 µg/ml BD FastImmune™ (anti-CD28/49 d antibody) for 6 h, with the addition of 1 µL of Brefeldin-A during the final 4 h of stimulation. After stimulation, PBMCs were washed and subjected to surface and ICS staining using antibodies targeting CD3 PE-Cy7 (BD 557851, clone SK7, 1:20), CD4 BV480 (BD 566104, clone SK3, 1:20), CD8 FITC (BD 555366, clone RPA-T8, 1:5), IFNg PE (BD 559327, clone B27, 1:5), TNFa APC (BD 551384, clone MAb11, 1:5), IL2 BV421 (BD 562914, clone 5344.111, 1:20), IL2 BV786 (BD 564113, clone MP4-25D2, 1:10), IL13 BV711 (BD 564288, clone JES10-5A2, 1:10), CD19 PerCP-Cy5.5 (BD 561295, clone HIB19, 1:20) markers. ICS was executed utilizing the BD cytofix/cytoperm kit following the manufacturer’s instructions. Antibody incubation was carried out for 30 minutes at 4 °C. PMA-Ionomycin was used as positive control. After staining and washing procedures, PBMCs were suspended in FACS buffer, acquired in the FACSLyric™ system (BD Biosciences), and analyzed with FlowJo software version 10.8.1 (FlowJo LLC, BD Biosciences).
T-cell memory assay
AIM assay was performed to measure memory T-cell responses. Briefly, 0.5 million PBMCs were taken in 100 µL CRPMI medium per well in a V-bottom plate. Cells were stimulated with 1 µg/ml epitope mapping 15-mer Omicron PepTivator® SARS-CoV-2 Prot S B.1.1.529/BA.1 Mutation Pool for 20–22 h. After stimulation, PBMCs were washed and subjected to surface using antibodies targeting CD3 PE-Cy7 (BD 557851, clone SK7, 1:20), CD4 BV480 (BD 566104, clone SK3, 1:20), CD8 FITC (BD 555366, clone RPA-T8, 1:5), CD19 PerCP-Cy5.5 (BD 561295, clone HIB19, 1:20), CD137, Ox40, CD69, CXCR5, CCR7, and CD45RA markers. Antibody incubation was carried out for 30 min at 4 °C. PHA was used as a positive control. After staining and washing procedures, PBMCs were suspended in FACS buffer, acquired in the FACSLyric™ system (BD Biosciences), and analyzed with FlowJo software version 10.8.1 (FlowJo LLC, BD Biosciences). The gating strategies for AIMs experiments and follicular helper T-cell quantification were used as described previously43 and shown in Supplementary Information, Supplementary Fig. 5b,c, respectively.
In flow cytometry experiments, lymphocyte clusters were gated using an FSC-A/SSC-A plot, followed by singlet selection using an FSC-A/FSC-H plot. Two-color, five-color, and seven-color Fc beads from BD Biosciences were utilized for reference setting and compensation calculations to apply gates. CS&T beads were used for performance qualification of the BD FACS Lyric flow cytometer.
Pseudovirus neutralization test (pVNT)
The genetic sequence for the gene XBB.1.5 was obtained from the GISAID database using an in-house algorithm44. The gene encoding Spike protein was cloned into an envelope vector, NR53765. The XBB.1.5 Spike pseudotyped pseudovirus was prepared by transfecting plasmids (NR53765-XBB.1.5, psPAX2, and pLenti-CMV_luciferase EF1-PURO Lentiviral reporter plasmid) into HEK293T cells45. For the neutralization assay, the serum was first diluted to a 1:10 ratio, followed by a two-fold dilution in the culturing media. The XBB.1.5 Spike pseudotyped pseudovirus was then incubated with the diluted serum for 60 min at 37 °C. After incubation, the virus-serum complex was added to ACE-2 expressing HEK293T cells, which were seeded at a density of 20,000 cells per well in 96-well plates, along with 8 µg/mL of polybrene, and incubated for 48 h. Luminescence was detected using the Pierce Firefly Luc One-step Glow Assay Kit and a multi-plate reader. The percentage inhibition (neutralization) in relative light units (RLU) was calculated using the equation provided below:
The percentage inhibition was plotted against the logarithmic (log10) values of the dilution factor for serum samples, and the data were fitted into the equation for log (inhibitor) versus normalized response.
Statistics
Statistical analysis was performed using GraphPad Prism (Version 10.2.3). Data were presented as mean ± SD. Comparisons were made by Mann–Whitney test and Friedman test as appropriate. P value <0.05 was considered statistically significant. The Spearman rank correlation coefficient (denoted as “r”) was computed for all pairs of parameters utilizing the corrplot package (Version 0.92) within RStudio (Version 2022.12.0.0). To complement the correlogram, two-tailed p values associated with Spearman rank correlations were calculated through the corr.mtest function and visualized using the corrplot function. tSNE clustering analysis was performed using FlowJo software (Version 10.8.1). Briefly, all the fcs files were concatenated into two cohort-specific files. 3000 CD19+CD20+ B-cells and 5000 CD3+ T-cells were used for downsampling in B-cell and T-cell tSNE analyses, respectively. COMbinatorial Poly-functionality analysis of antigen-specific T-cell subsets (COMPASS, Version 1.32.0 in R version 4.1.2) statistical model was used for the analysis of T-cell poly-functional response analysis. The presence of confounding effects contributed by age, gender, and previous vaccine arm (either Covishield™ or Covaxin™) was evaluated by using a comparison of unadjusted and adjusted estimates of Booster (calculated by using multiple regression analysis). This evaluation was done for Omicron B.1.1.529 Spike protein-specific MBCs, AIM+ CD4+ T-cell, and CD8+ T-cell responses.


Responses