Characteristics and mechanism of MBT anomaly of Karakum desert related with the Hindu Kush earthquake

Introduction
Earthquakes are the result of tectonic deformation and fault rupture under the action of tectonic stresses between plates, causing the earth’s crust to release elastic energy rapidly and suddenly. Although the changes in ground stress cannot be directly observed1, changes in heat-related physical quantities during the seismogenic period of earthquakes, subsurface tectonic stress in seismic zones can be indirectly detected and simulated2,3,4. The common thermal anomaly parameters used to study earthquakes are surface skin temperature5,6, infrared brightness temperature7,8, outgoing longwave radiation9,10,11, wavelet power spectrum of infrared radiation12,13 and Microwave brightness temperature (MBT)14,15,16,17,18. Compared with the former two parameters, the surface microwave radiation signal can pass through clouds and be detected by satellite sensors, and is basically less even not affected by the meteorological conditions19. It has been widely used to explore pre-earthquake thermal anomalies.
The Indian Ocean Plate is subducting and squeezing continuously the Eurasian Plate from south to north at a rate of ~40 mm per year, causing the Himalayas Mountains, the Karakoram Mountains and the Hindu Kush Mountains uplift20. As a result, tectonic stress accumulation is becoming active around the Pamir Plateau being the conjunction zone of Himalayas, Karakoram and Hindu Kush, and earthquakes are much more frequent in Hindu Kush in recent years21. Due to the economic poverty and frequent wars in this area, there are few site observations and surface measurements on earthquakes. Satellite remote sensing, as a long-distance and large-scale remote observation, is very good for the earthquake research in this area. Gopal et al.22 found that the vertical total electron content of the ionosphere showed significant anomalies a few days before the 2015 Hindu Kush Ms7.5 mainshock. Ding et al. 23 found that there were positive MBT anomalies appeared on the Quaternary caprock and along some faults near the epicenter before a Ms 6.0 earthquake in Pakatika, the southern part of Hindu Kush. Satellite technology is promising in detecting seismic anomalies and precursors in this region. Unfortunately, the Hindu Kush region lacks sufficient attention yet, and the seismic research remains insufficiently deep.
A Mw 6.4 earthquake occurred to the north of Afghanistan at 9:20 Am on January 11, 2024 (UTC), with the epicenter located in the Hindu Kush mountains and a focal depth of 204 km. Seismic activity is prevalent in the study region (Fig. 1a). Since the beginning of the 21st century, 40 earthquakes of magnitude 6 or above have occurred, mostly concentrated in the Hindu Kush region. The magnitude and timing of the 40 major earthquakes are depicted in Fig. 2. The seismic temporal and spatial data are from the United States Geological Survey (USGS). Spatially, most earthquakes including this Ms6.4 one occurred in the Hindu Kush Mountain area. This indicated that the Hindu Kush region had been a stress concentration zone for much a long time. Seismic activity was frequent in the study area from 2000 to 2010. However, there were no significant earthquakes happened from 2010 to 2015, during which stress and energy accumulated until two earthquakes of magnitude 7 or above occurred in late 2015. Subsequently, earthquakes occurred frequently from 2016 to 2019. From 2020 to 2023, the study area experienced another period of calm, suggesting that the crust elastic energy is again in process of accumulation. Therefore, the study of the 2024 Hindu Kush earthquake has a certain degree of typicality and predictability.

The regional terrain and the epicenter of earthquakes since 2000 (a); geological map (b) and land cover (c). The red point in subgraph (a) indicates the Hindu Kush Mw 6.4 earthquake, and the white dots represent other historical earthquakes.
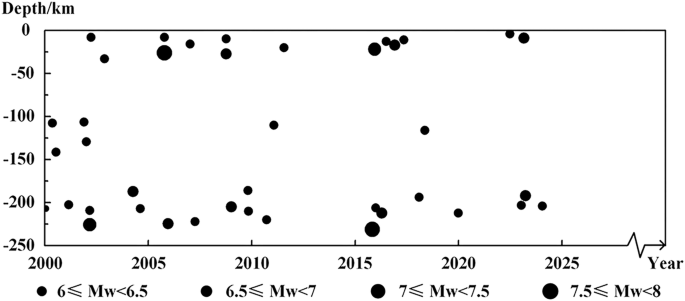
Time distribution and focal depth of EQs occurred in and around the Hindu Kush mountains since 2000.
Considering the Dobrovolsky seismogenic range of the Hindu Kush earthquake24, the structural characteristics of the study area and the scanning bandwidth of the satellite, a geographical region being 66°–76°E and 32°–42°N was selected as the study area, as shown in Fig. 1. The terrain of the study area is complex and changes significantly. The central and eastern parts are dominated by the high-altitude Hindu Kush Mountain, while the southeastern, northwestern and western parts consist of the flat terrain of the Indus Plain, Kizilkum Desert and the Karakum Desert, respectively (Fig. 1a). Furthermore, the fault systems are very complex (Fig. 1b), further contributing to it being a region prone to frequent earthquake25. The land cover is relatively uniform in the study area, mainly consisting of forests, grasslands, bare land, and cropland (Fig. 1c), which is beneficial for MBT analysis. The study area has low rainfall and few clouds throughout the year26, making it suitable for satellite observations.
Results
Spatiotemporal features of ΔMBT
Figure 3 shows the basic features and trends of the ΔMBT in the study area 15 days before and after the Ms 6.4 mainshock on January 11, 2024. The positive ΔMBT firstly appeared in the Karakum Desert on December 28, 2023, which became increasingly prominent in amplitude and scope until January 4, 2024. Subsequently, the ΔMBT weakened to some extent until January 8, 2024. From January 10 to 13, 2024, the ΔMBT increased sharply. Afterwards, it gradually calmed down again until January 20. This abnormal behavior of the ΔMBT can be summarized as in sequence: pre-EQ rising, near-EQ enhancing, co-EQ peaking, after-EQ persisting and dissipating eventually.
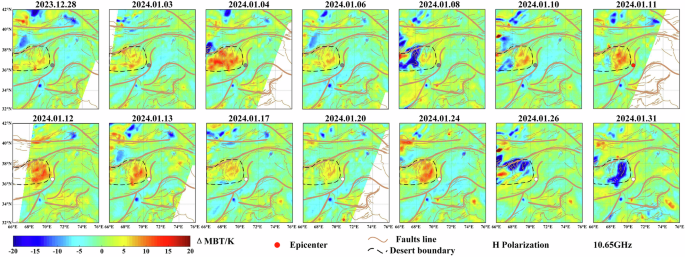
The white, gray and red dots mark the epicenter and show the time before, after, and the day shocking, respectively. The dashed polygon is Karakum Desert, the thick brown lines represent the major faults.
The temporal characteristics of positive ΔMBT residuals were essentially consistent with the thermal curves of the laboratory rock compressively loaded to failure27,28. According to the DTS criteria29, the ΔMBT in the Karakum Desert occurred not only temporally close to the day of the Hindu Kush earthquake, but also spatially adjacent to the left side of the epicenter with a significant amplitude, especially reaching 20 K in the immediate days before and after the earthquake, which could be identified as a seismic anomaly. In addition, the ΔMBT in the Karakum Desert showed negative ΔMBT on January 4, January 8 and January 10, 2024, and positive ΔMBT on January 24. The above negative MBT anomaly phenomena were related to changes in rainfall and soil moisture while the positive MBT anomaly was related to an increase in skin temperature. The details of these phenomena are further analyzed in the next paragraph.
Mechanism of positive ΔMBT in the Karakum desert
Considering the positive ΔMBT in the Karakum Desert, the core area was narrowed to (35–39°N, 66–71°E), and further analysis was based on auxiliary data including ST, MPDI, SM, rainfall, and snowfall. The results are shown in Fig. 4. Although the ΔST of the Karakum Desert increased locally (≈10 K) on January 11, 12, 13 and 24, it was insufficient to explain effectively the large ΔMBT (≈20 K). The ΔST in the Karakum Desert was relatively stable in other periods, but ΔMBT still showed large positive anomalies. It inferred that the main reason for the ΔMBT change in the Karakum Desert could be owing to the change both in ST and the dielectric properties of ground surface. Besides, the ΔMBT of Karakum Desert exhibited extremely negative anomalies on January 4, 8, 10 and 11. Although low-frequency MBT has good penetration into the atmosphere and vegetation, it is easily affected by SM30,31. By comparing the daily rainfalls, we know that this was indeed caused by rainfall. Rainfall leads to an increase in SM, resulting in higher surface soil dielectric constant and MPDI, and ultimately causing the decrease in MBT. Through daily snowfall images, we also found that the local snowfall had little effect on MPDI and MBT of the earth surface, which was due to the similarity in the dielectric constant of snow, ice and dry sand.
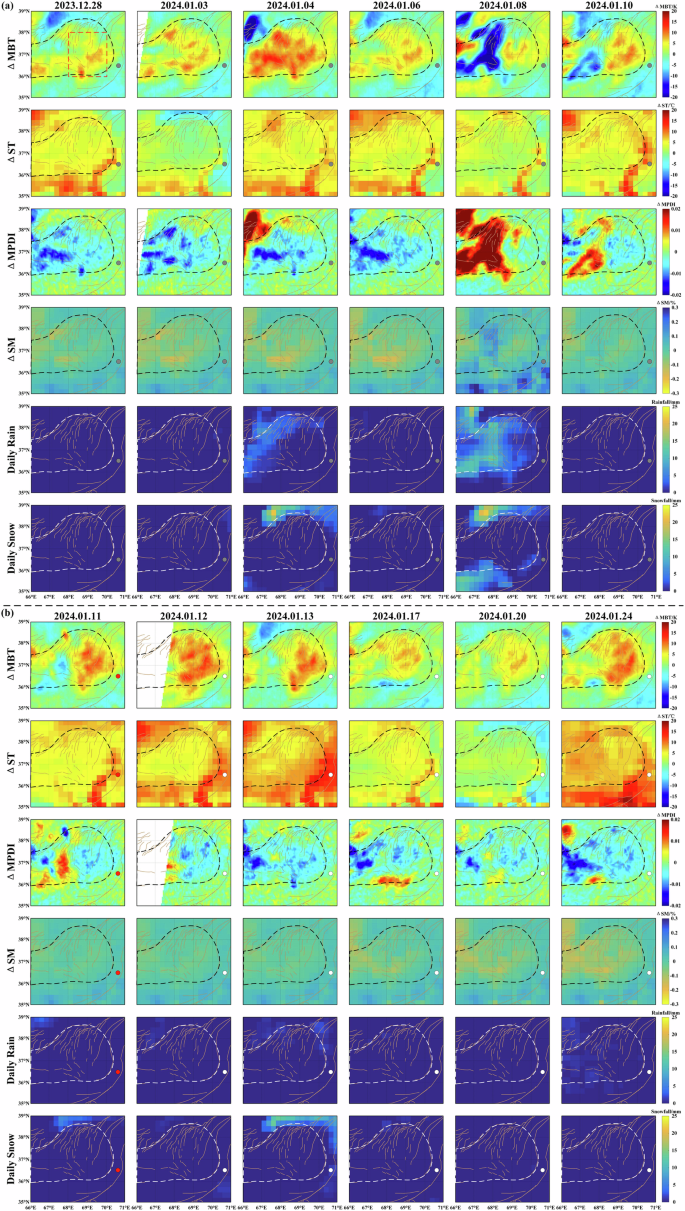
a, b The typical images of ΔMBT, ΔST, ΔMPDI, ΔSM, daily rainfall and snowfall. The solid dots have the same meanings as in Fig. 3. The dashed polygon is Karakum Desert, and the brown lines represent faults.
As for the positive ΔMBT, the influence from meteorology factors could be basically ruled out through SM, rainfall and snowfall images. From December 28, 2023 to January 6, 2024, both the SM and MPDI in Krakum Desert decreased, but the MBT increased. It showed that the reduction of SM was the key factor of decreasing MPDI and rising MBT. It should be particularly noted that on January 8, 2024, due to the influence of rainfall, the SM in the east part of Karakum Desert was relatively stable, but the ΔMBT still showed positive anomalies. Also, from January 10 (1 d before the EQ) to January 13 (2 d after the EQ), the SM had almost no change, but ΔMPDI and ΔMBT showed negative anomalies and positive anomalies, respectively. This phenomenon showed that in addition to SM, other factors might had caused the change of surface dielectric constant. Finally, on January 17, 2024, there was another significant reduction in SM. This phenomenon suggested that the positive ΔMBT on January 17 and thereafter was caused by the decrement in SM.
Moreover, by analyzing the ΔMBT images on January 8, 2024, the Karakum Desert was segmented into three parts: western, central, and eastern. The central region displayed a negative MBT anomaly attributed to rainfall. While the western areas, receiving less rainfall, exhibited a positive anomaly. Analysis of ΔST, ΔSM, and ΔMPDI images indicated that increased ST, decreased MPDI, and stable SM had occurred in this region. This suggests that increased ST and decreased dielectric constant were primary factors behind the positive MBT anomaly observed in the west. Similarly, the positive MBT anomaly in the east was linked to variations in the dielectric constant.
To further verify the abnormal phenomenon of ΔMBT before and after the earthquake, this study calculated the average values of ∆MBT, ∆ST, ∆MPDI, and ∆SM in the eastern Karakum Desert and analyzed them in conjunction with daily rainfalls (Fig. 5), in that rainfalls have negative impact on MBT, MPDI, SM and ST. For better description and understanding, the result curves are divided into three phases according to the evolutions of ∆MBT as: (1) Firstly, despite the inhibitory effect of rainfalls to MBT and ST, ∆MBT and ∆ST are positive under clear sky conditions, and the magnitude of positive ∆ST was not as large as that of ∆MBT. It means that the positive ∆MBT was affected not only by ∆ST, but also by the dielectric constant of ground surface. Combining the ∆MPDI and ∆SM curves, we found that when ∆SM was positively high or stable, ∆MPDI was still negative around October 25, 2023 and November 16, 2023. This particular abnormity implies that in addition to SM there were other factors led to the decrease of ground surface’s dielectric constant. (2) Secondly, two rainfall events caused the ΔMBT approaching zero on December 30, 2023 and January 9, 2024. It showed that the positive ΔMBT was caused by some factors offset the impact of rainfalls, and the ΔMBT kept positive for the rest of the time. After the earthquake, ∆SM and ∆ST approached zero on January 16, 2024 and January 21, 2024, while ∆MBT and ∆MPDI continued to be positive and negative, respectively. This suggested that there were other factors besides ST and SM leading to the positive ΔMBT. (3) Thirdly, due to long-term and frequent rainfalls in the rainy season, the MBT and ST decreased significantly but the MPDI and SM increased. The data from this stage were greatly affected by weather, and the results cannot be used to analyze surface and shallow MBT phenomena.
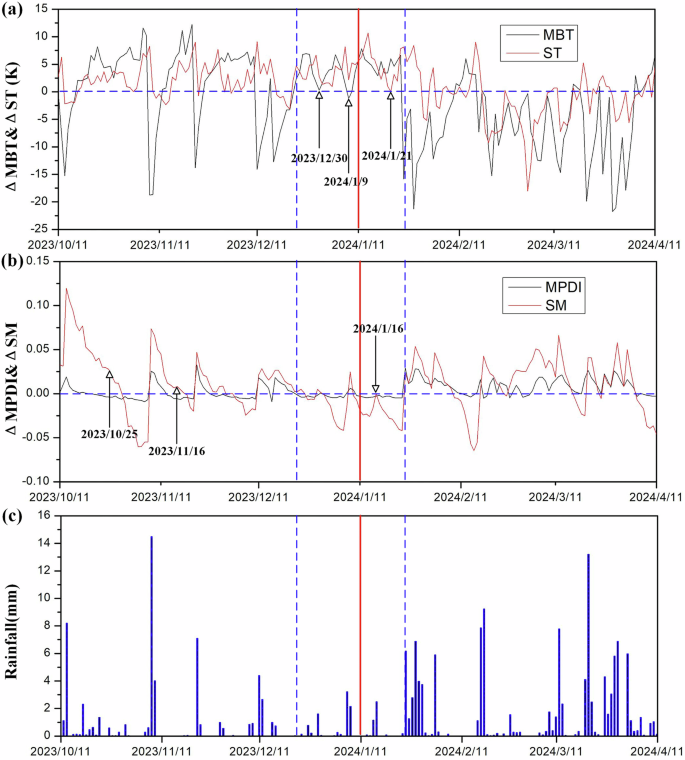
a MBT and ST; b MPDI and SM; c rainfall. The selected area is shown in red dashed border in Fig. 4. The red vertical line indicates the day of the main shock. The blue vertical and horizontal dashed lines represent the MBT abnormal period before and after the main shock and the zero scale line, respectively.
CH4 anomaly in the Karakum desert
Figure 6a shows the changing of layer concentration of CH4 in the Karakum Desert and its around shortly before and after the Ms6.4 earthquake. Abnormally high CH4 concentration occurred on January 7th, 10th, and 17th, 2024. The abnormity on January 10th were greater in extent and concentration than those on other days. Surprisingly, this CH4 anomaly occurred just one day before the shocking, and displayed similarly to that related with 2022 Pakatica Ms 6.0 earthquake23. Figure 6b shows the variation of CH4 concentration at different atmospheric pressure layers on January 10, 2024. Obviously, the CH4 concentration decreased with altitude, which excluded the possibility that the CH4 came from outside or be generated by internal chemical reactions. Moreover, the CH4 concentration area is in spatial consistency to Triassic coal mines and Carboniferous coal mines32. We speculated that the change of crustal stress field in the seismogenious area shortly before the shocking had caused the relax or opening of local faults in and nearby the Karakum Desert, and greenhouse gases such as CH4 in the coal-related strata was released subsequently to ground surface and got concentration in the atmosphere above ground.
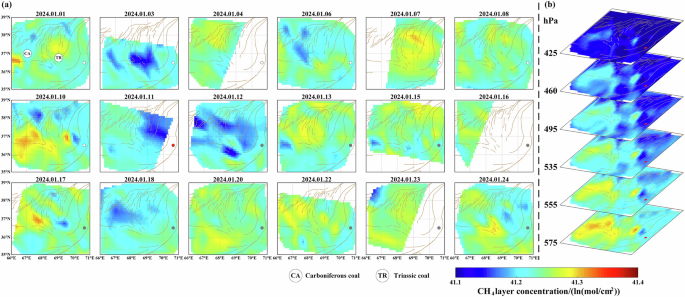
a At the pressure level of 575 hPa and b variation at different pressure levels 425–575 hPa. The coal mine position adapted from Wunk32.
Discussion
It is very necessary to carry out multi-parameter seismic anomalies research, and the use of multiple auxiliary data can eliminate the MBT anomalies caused by non-seismic factors. This study analyzed mainly the anomalies of MBT and MPDI, and applied the ST, SM, rainfall and snowfall data for validation to eliminate the non-seismic changes in dielectric constant and temperature, which might be caused by weather factors. Although the temporal resolutions of auxiliary data are various (1 h or 12 h as in Table 1) but it is better than that of MBT (1 d), which does not affect the validation in that we focused on the positive ΔMBT and negative ΔMPDI anomalies and its evolutionary trends in this study. The analytical methods exhibit a certain degree of transferability and repeatability, but additional parameters need to be added for further investigation.
In laboratory experimental electric observation on rock samples loaded to fracturing, stress-activated positive charge carriers (P-holes) appear when the rock is stressed33,34. In condition of seismogenious process, the activated P-holes will migrate upward along stress gradient and eventually accumulate on ground surface or distant low-stress zones, where an additional electric field will be generated on the rock surface35. The accumulation of P-holes on the ground surface adds additional positive potential to the rock surface, reducing the surface’s dielectric constant, and ultimately lifting its microwave radiation energy. Experiments on the microwave radiation and dielectric changes of the surface of rock samples loaded to fracturing also observed significant rise of MBT36 as well as obvious drop of microwave dielectric constant37.
The change of crustal stress field and the development of rock fractures during the imminent earthquake period are the essential reasons for the appearance of abnormal seismic signals38. Combining existing geological data (fault orientation, Crust1.0 global 3D crustal data), taking into account the GNSS velocity field, the ANSYS finite element method was applied to simulate the underground stress filed alteration with a carefully constructed 3D model. Considering that the depth of the earth’s crust is 0–40 km, this range of depths was selected for geostress simulation (Fig. 7a). For further analysis, the 3D model of simulated stress filed was sectioned at different depths (5–30 km) to obtain the corresponding pattern of crust stress altering with depth (Fig. 7b). The ground horizontal stress gradient of the Karakum Desert runs generally from east to west. As a result, large amounts of CH4 escaped from Carboniferous coal mines in the western part of the desert, while less CH4 escaped from Triassic coal mines in the eastern part of the desert. The focal depth of the Hindu Kush earthquake was 204 km, which was a deep-source earthquake. And the electric charge generated by plate compression was difficult to be transferred from such a deep area to the surface. However, there was a high-stress concentration area at depth 10–15 km, which was benefit for the activation and propagation of P-holes. The magnitude and area of concentrated stresses on the ground were relatively smaller than those at depth, which means that there was an upward stress gradient. The seismic zone was in a stress blocking state for a long time, and elastic energy was accumulated without strong earthquakes happened to get release. With the accumulation of local crustal stress, a large number of P-holes should had been activated underground in the seismogenious region, especially in the hypocenter zone, and flowed upward to the ground surface of Karakum Desert.
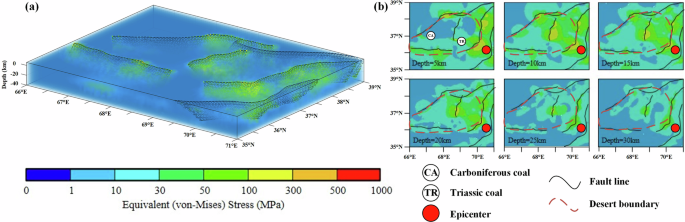
3D visualization (a) and profiles at different depths (b) The loading time of the geostress simulation is 1000 years. The red and white circles represent the main shock and the location of the coal site, respectively. The solid black line and the dashed red line represent the fault zone and the Karakum Desert boundary, respectively.
Therefore, the ground surface of Karakum Desert, which is above the high-stress concentration zone, might had acted as the core area of P-holes accumulation, which corresponded to the positive ΔMBT anomaly. Other experiments showed that during the rock loading process, the covering of sands layer on the surface of ballast rock samples lifted the microwave radiation from the rock sample39. The stratigraphic age of the Karakum Desert in the west of the study area is Quaternary, the surface cover is bare land and cultivated land (Figs. 1b, 1c), the Quaternary strata have loose lithology, and the gravel and sandy particles contain metamorphic rock fragments40. The sandstones and metamorphic rocks embody with extensive stress sensitive peroxy defects, which are easily activated by stress to produce P-holes33. As a result, the Quaternary system is not only the medium for the transfer or propagation of P-holes from underground deep to ground surface, but also a source of P-holes production in shallow underground where are stressed also. Therefore, the frequent occurrence of positive ΔMBT anomalies in the seismogenious zone is due to coupling of the locally accumulated crustal stress and the objective regional geo-environments. In addition, the western part of the crust under the Karakum Desert generally suffered low stress accumulation, which spatially corresponded to the CH4 anomaly occurred one day before the shocking.
The spatio-temporal evolution characteristics of abnormal MBT related to the 2024 Hindu Kush earthquake was revealed from AMSR-2 observation data. The positive MBT anomaly occurred in Karakum desert was attributed to the transfer of stress-activated P-holes to the Quaternary strata, which reduces the surface dielectric constant and ultimately leads to the rise of surface MBT. The change in local tectonic stress led to also the escape of underground trace gases such as methane to ground surface. Affected by many factors such as regional plate tectonic activity, geological lithology, surface cover type and weather conditions, which requires careful identification using multi-source information and multi-parameters, the uncover of the seismic related MBT positive anomaly is challenging. This work has reference significance for searching earthquake precursors using multi-parameter data, and is of special significance in earthquake remote sensing study in the Hindu Kush region.
Methods
Microwave brightness temperature (MBT) dataset
The Advanced Microwave Scanning Radiometer-2 (AMSR-2) sensors, on boarding the GCOM-W1 satellite, were employed for observing the MBT data related with the EQ. The AMSR-2 sensors mainly include 5 frequencies (10.65-89 GHz) and dual polarization channels (horizontal and vertical)41. The main performance parameters are listed in Table 1. Compared to high-frequency signals, the low-frequency signals are less sensitive to cloud and meteorological disturbances and can detect shallow ground physical information at a certain depth. Therefore, the lowest frequency at 10.65 GHz is usually selected for seismic anomalies42. Compared with V polarization, H polarization is more sensitive to the change in the dielectric constant of ground surface and can better reflect its abnormal amplitude and details43, so the MBT of H polarization at 10.65 GHz is used in this study. The revisit of the GCOM-W1 satellite is 1:30 am and 1:30 pm local time. To avoid the influence of solar radiation, the MBT data obtained at 1:30 am was used.
Furthermore, the microwave polarization difference index (MPDI) calculated by polarized MBT is independent of ST and can separate the correlation between vegetation and SM44. The calculation method of MPDI is as follows:
where ({{MBT}}_{{fv}}) and ({{MBT}}_{{fh}}) represent the MBT under V and H polarization at frequency (f), respectively. Qi et al.45 found that the terrestrial MPDI was related to the incident angle and the dielectric constant via a simplified formula. The incidence angle of the selected band is fixed (at 55.0°), so the characteristic change of the dielectric constant can be uncovered using MPDI. MBT and MPDI can be approximated as a form closely related to emissivity.
Where (T) represents the physical temperature of the land surface, (p) refers to the polarization of the microwave signal, (g) and (Q) represent the vegetation coverage and surface roughness, respectively, and (varepsilon) is the microwave emissivity. In the same area and same period, (g) and (Q) remain unchanged so the combined application of MBT and MPDI can remove the influence of physical temperature (T). If MPDI shows a negative anomaly, it means that the dielectric constant of this place decreases, otherwise it increases.
ERA5 dataset
ERA5 is the fifth generation reanalysis dataset of ECMWF (European Center for Medium-range Weather Forecasts) on global climate and weather over the past 80 years. Compared to the previous versions, the ERA-5 dataset has a higher spatio-temporal resolution and more real-time products46. ERA5 provides hourly estimated data on atmospheric, ocean-wave and land-surface quantities since 1940, and it is updated daily with a latency of approximately 5 days47. Precipitation, snowfall, skin temperature (ST) and soil moisture (SM) from the ERA5 dataset were selected as auxiliary parameters in this study. Precipitation is the accumulated liquid and frozen water, consisting of rain and snow, that falls to the Earth’s surface, while the snowfall is the accumulated snow. The amount of rainfall can be determined from the difference between snowfall and precipitation. ST is the temperature of the earth’s surface, which can be converted to degrees Celsius by subtracting 273.15. SM is the volume of water 0–7 cm below the surface.
AIRS dataset
The Atmospheric Infrared Sounder (AIRS), is a hyperspectral infrared spectrometer onboarding NASA’s Aqua satellite since May 2002, whose primary mission is to monitor the vertical structure of the Earth’s atmosphere48. The bandwidth of AIRS allows the observation of gas data, such as CO2, water vapor, O3 and CH4. The concentration column data of CH4 was used as an important parameter in this study. Due to the large terrain variations in the study area, the dataset below the 575 hPa atmospheric pressure layer had many spatial gaps, and the gas concentration above the 425 hPa atmospheric pressure layer was usually low. We used the data of the 575 hPa atmospheric pressure layer located on the surface of the Hindu Kush mountains for the spatio-temporal characteristics analysis, and the data of the 425–575 hPa atmospheric pressure layer for the variation analysis referring to the altitude. The original data of CH4 is reported in the unit of molecules/cm2, which was loga-rithmically calculated during the pre-processing process in this study, and the final unit was expressed as logarithmic molecules/cm2. In addition, to avoid the influence of solar radiation on the hyperspectral infrared inversion data, the nighttime data were selected for analysis in this study.
Geological dataset
In February 2000, the Shuttle Radar Topography Mission (SRTM) successfully recorded the Earth’s land elevation between 60°N and 57°S, and digital elevation models of spatial resolution 30 m are now widely used49. The land cover comes from the GlobeLand30 dataset with a resolution of 30 m, which was developed by the National Geomatics Center of China (NGCC). Also, the generalized geological map data provided by the Geological Survey of Canada (GSC) meets the requirements for analyzing the correlation between surface rock formations and MBT anomalies in the study area.
The basic information of all the auxiliary data sets used is shown in Table 2.
To investigate the potential seismic anomalies, the changes of multiple parameters including MBT, MPDI, ST and SM were calculated by subtracting its background field data averaged over the past decade (2014–2023) from the data of seismic-year (2024), respectively, so as to obtain its residual images. Daily rainfall and snowfall amounts are obtained by adding the hourly products for the year of 2024. Since gases are susceptible to the interference from multiple factors such as meteorological conditions and atmospheric transport50, it is difficult to establish a pure background field to extract the residual images of CH4. Currently, spatial relative changes in images are used to identify CH4 anomalies. To investigate the MBT anomaly in the Hind Kush region, we propose an overall flow chart as in Fig. 8, and the specific steps are shown below.
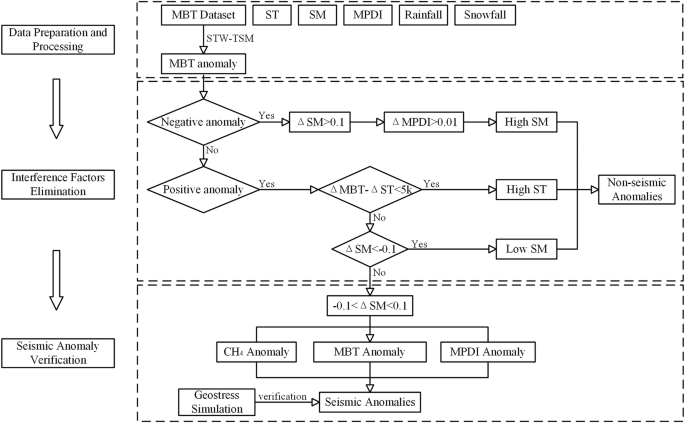
The flowchart is mainly divided into three parts, in which the thresholds of multiple remote sensing parameters fluctuate slightly depending on the study area.
(1) Data preparation and processing: The spatio-temporally weighted two-step method (STW-TSM)43, was used to investigate potential MBT anomalies51. Firstly, the basic residuals are obtained by removing the time-weighted background of the MBT series in the non-earthquake years before and after earthquakes. Secondly, based on the Euclidean distance between the center pixel and the edge pixel, the residual value with random meteorological noise is removed. After processing the MBT data, the stable effects of geography, terrain and seasons as well as random influences of weather conditions can be removed or suppressed, and the ΔMBT signals related to earthquakes can be retained and obtained. The ΔMBT images can then be used to explore potential seismic MBT anomalies.
(2) Interference factors elimination: Increased SM is often the main cause of negative ΔMBT, which reduces MBT by increasing the dielectric constant of ground surface. For positive ΔMBT, if the ΔST is also positive, we consider the rising ST to be the primary factor rising MBT. If the SM shows a large negative residual, we believe that the reduction of SM is the main reason of rising MBT. Otherwise, the positive ΔMBT could be attributed to seismic activities.
(3) Seismic anomaly verification: If the SM remains stable while MBT and MPDI show also significant anomalies, it could be inferred that seismic factors were causing a decreasing dielectric constant of ground surface, thereby leading to the rising MBT. Additionally, changes and adjustments in local stress can lead also to fault relax or extension and the release of underground gases. These phenomena are further verified by numerical simulation on the crustal stress field alteration.

 intercalated MnBi2Te4 for realizing interlayer ferromagnetism and quantum anomalous hall effect")


Responses