Characterization of cardiac autonomic dysfunction in acute Schizophrenia: a cluster analysis of heart rate variability parameters

Introduction
Schizophrenia (SCZ) is associated with a significant reduction in life expectancy of 15–20 years compared to the general population1,2,3, with cardiovascular disease (CVD) being a leading cause of death in this population4,5,6,7.
A key contributor to this elevated cardiovascular risk is cardiac autonomic dysfunction (CADF), characterized by decreased vagal and increased sympathetic modulation, which is an independent risk factor for premature mortality and life-threatening arrhythmias in individuals with or without structural heart disease8,9,10. This dysregulated autonomic balance, consistently observed in SCZ patients11, plays a critical role in the development and progression of major CVD, such as myocardial infarction, heart failure, and sudden cardiac death12,13,14,15. Understanding and addressing CADF in SCZ may therefore offer valuable insights for cardiovascular risk stratification and prevention of adverse outcomes in SCZ patients.
Notably, CADF in patients with SCZ reflects not merely transient stress-induced arousal, but persistent underlying alterations in autonomic regulation16. On the one hand, CADF in first-degree relatives suggests a genetic predisposition17, which is further supported by SCZ-associated loci that regulate cardiac function18,19. On the other hand, while general contributors such as smoking20, BMI21, and age22,23,24 are well-documented, more specific SCZ-associated factors such as chronic stress, systemic inflammation, and metabolic dysregulation may further exacerbate CADF25. Beyond these general factors, antipsychotic medication use and symptom severity must also be considered, as they may uniquely interact with SCZ’s underlying pathophysiology. Understanding the multifactorial nature of CADF, including both general and SCZ-associated factors, and its interactions with genetic influences is essential to develop accurate assessments to quantify cardiac autonomic risk in this vulnerable population.
A key marker of CADF is heart rate variability (HRV), which reflects the dynamic interplay between sympathetic and parasympathetic modulation and serves as a noninvasive assessment of autonomic regulation, with higher variability generally indicating better cardiovascular adaptability and overall health26.
Classical HRV analysis includes time-domain measures that quantify the variability of RR intervals over time (e.g., SDNN for overall variability and RMSSD for parasympathetic activity) and frequency-domain measures that assess the distribution of power across frequency bands (e.g., LF and HF) to evaluate autonomic balance27. However, nonlinear HRV measures provide deeper insights into the complexity and irregularity of heart rate dynamics28,29. These include entropy measures, which quantify randomness30,31, symbolic dynamics, which analyzes variability and complexity in RR interval patterns32,33; Poincaré plot analysis, which evaluates short- and long-term variability34,35; and compression entropy, which measures signal complexity32,36. Integrating classical HRV measures with nonlinear dynamics enhances sensitivity in detecting subtle autonomic dysfunction37,38,39. While classical parameters provide robust markers of overall autonomic activity, nonlinear measures uncover hidden patterns, providing a more comprehensive view of cardiac regulation16,29.
Despite extensive research on CADF in SCZ, previous studies have been limited by small sample sizes or confounded by the effects of antipsychotic medication25. To address these limitations, the current study examines a robust cohort of 119 unmedicated SCZ patients using a comprehensive set of HRV parameters to evaluate the prevalence of CADF compared to healthy controls.
We hypothesize that CADF is highly prevalent in unmedicated SCZ patients and that its severity correlates with advanced age, increased BMI, severity of SCZ positive and negative symptoms, and longer disease duration. This study aims to deepen our understanding of the autonomic dysfunction underlying SCZ and identify risk characteristics for CADF, ultimately contributing to improved cardiovascular risk assessment and management in this population.
Methods
Participants
A total of 119 patients with SCZ from the Department of Psychiatry and Psychotherapy at the University Hospital Jena participated in this single-center investigation between January 2010 and December 2017 (see Supplementary Table S1). Inclusion criteria required a diagnosis of SCZ according to the Diagnostic and Statistical Manual of Mental Disorders, 4th revision (DSM-IV) criteria, an age between 18 and 45 years, and a minimum of antipsychotic-free period of at least 8 weeks before admission to the hospital. Moreover, Patients had to be legally competent. The Brief Structured Diagnostic Interview for Major Psychiatric Disorders (SCID)40 was administered by a staff psychiatrist to identify relevant psychiatric comorbidities and to determine disease duration in patients with SCZ. The diagnosis of SCZ was independently confirmed by another psychiatrist. Exclusion criteria included psychiatric comorbidities (e.g., current substance abuse or dependence, assessed by urine drug screen), clinically relevant medical conditions (e.g., cardiovascular, peripheral nervous system, or endocrine disorders, assessed by clinical interview and review of medical records), involuntary hospitalization, or pregnancy. Symptom severity was assessed using the Scale for the Assessment of Negative Symptoms (SANS)41, and the Scale for the Assessment of Positive Symptoms (SAPS)42.
Data were collected cross-sectionally within one week after hospital admission. Inclusion in the study did not affect the clinical course or treatment decisions of the participants. Routine psychotherapeutic crisis interventions, such as supportive conversations may have occurred as part of standard care, but no specific stress-reduction therapies, such as biofeedback, relaxation exercises, or guided breathing techniques, were administered.
In addition, we recruited 119 healthy controls (HC) matched for age, gender, and BMI, from the hospital staff, medical students and the local community. The SCID was performed to exclude any current or past psychiatric disorders, and somatic diseases were ruled out through clinical interview. Participants taking medications affecting the cardiovascular or autonomic nervous system (e.g., beta-blockers, antiarrhythmics, antipsychotics, antidepressants) were excluded.
All participants underwent a comprehensive clinical examination, ECG assessment and a routine laboratory testing.
The study was approved by the local ethics committee and conducted in accordance with the Declaration of Helsinki. All participants provided written informed consent, and patients were assured that declining participation at any time would not affect future treatment.
Analysis of heart rate variability parameters
ECG recording and Data preparation
A high-resolution 3-channel electrocardiogram (1000 Hz) was obtained from all participants for 30 min using a Task Force® Monitor (CNSystems Medizintechnik AG, Graz, Austria). The recording was conducted in a quiet room with stable air temperature maintained at 22 ± 2 °C. Participants were asked to breathe evenly, move as little as possible, to not talk and avoid falling asleep. Furthermore, patients with SCZ as well as HC were asked to avoid physical strain, eating large meals and the use of nicotine or caffeine for 2 h prior to the ECG recording.
The ECG was acquired by arranging three electrodes on the chest according to an adjusted Einthoven triangle. ECG signals were band-pass filtered between 0.05 and 35 Hz. Automatically detected R-waves were manually reviewed for ectopic beats and artifacts. Missed heartbeats were identified, and artifacts were removed based on the morphology of QRS complexes in the ECG signals. The resulting heartbeat interval time series was further screened for outliers using adaptive filtering43. Detected abnormal intervals were corrected by replacing them with randomized values within a range defined by the mean and standard deviation of the neighboring heartbeat intervals. This approach minimizes systematic influences on specific HRV parameters, which have been shown to occur when linear or spline interpolation was used after artifacts removal44,45.
Due to the high scanning frequency and thus temporal resolution of the ECG recordings the obtained measures regarding heart beat intervals allow a reliable calculation of parameters of HRV46. The calculation of HRV parameters was based on the time series of normal-to-normal (NN) intervals derived from ECG signals, processed as described above.
To comprehensively capture abnormalities and changes in heart rate patterns over time, we integrated parameters from various domains into our model, each providing distinct insights into the dynamics of heart rate time series. The following is a brief overview of each domain. For a detailed description of domains, see Supplementary material information.
Time domain analysis
HRV is assessed by measuring the intervals between successive heartbeats, known as NN intervals (normal-to-normal intervals) or RR intervals (time between two R waves on an ECG). Traditional time and frequency domain parameters for describing HRV are well defined and widely accepted27. The time domain approach provides valuable insight into autonomic cardiac regulation by the sympathetic and parasympathetic nervous systems using parameters such as standard deviation of NN intervals (SDNN), reflecting the total variability in heart rate, and root mean square of successive differences (RMSSD), specifically measuring short-term variability driven by vagal influences47. While mean heart rate (HR) is not a direct HRV parameter, it is derived from time-domain data. Given its fundamental importance, HR was included in our analysis.
Frequency domain analysis
HRV signals are decomposed into frequency bands using spectral analysis methods such as Fast Fourier Transformation48. High frequency (HF: 0.15–0.4 Hz) components indicate vagal modulation, while low frequency (LF: 0.04–0.15 Hz) components reflect both sympathetic and vagal influences, including baroreflex activity. The LF/HF ratio represents the balance of autonomic inputs. These parameters provide a detailed understanding of cardiac autonomic modulation.
Multiscale entropy (MSE)
MSE, introduced by Costa and colleagues, assesses HRV complexity by measuring entropy across multiple time scales30. The time series is coarse-grained by averaging successive data points over increasing windows. The sample entropy (SampEn) is calculated for each time scale to quantify regularity and complexity. Higher SampEn values indicate more complex and less predictable HR patterns, reflecting robust physiological regulation.
Detrended fluctuation analysis (DFA)
Trend-adjusted fluctuation analysis is a widely used method for the quantification of correlations in nonstationary HRV time series49. RR intervals are integrated, segmented, and detrended by removing local linear trends. The fluctuation function F(n) is calculated for each segment length n, and the scaling exponent alpha, derived from the slope of a log-log plot of F(n) versus n, represents correlation properties. Short-term scaling alpha1 (4–16 intervals) and long-term scaling alpha2 provide insight into autonomic dynamics and system adaptability.
Compression entropy (Hc)
Hc quantifies the compressibility and complexity of RR intervals using the LZ77 algorithm50. It is calculated as the ratio of the compressed length to the original length of the time series. A higher Hc indicates greater complexity, reflecting a diverse and adaptive heart rate regulation.
Symbolic dynamics
The symbolic dynamics method analyzes the temporal dynamics of HRV by comparing each heartbeat to the previous one51. RR intervals are converted into symbols representing changes (e.g., increases, decreases, or stability), and word sequences derived from these symbols provide insight into the dynamics of the system. Entropic measures, such as Rényi entropy, and specific word distributions quantify nonlinear variability and complexity. Reduced symbol sets, as proposed by Voss and colleagues, allow the identification of high and low variability states, enhancing the analysis of regulatory patterns52.
Poincaré plot analysis
Trend-adjusted fluctuation analysis is widely used to quantify correlations in nonstationary series49. This nonlinear method visualizes the relationship between successive RR intervals by plotting each interval against the next. The resulting scatterplot provides qualitative and quantitative measures of variability. An ellipse fitted to the plot quantifies short-term variability (SD1) and long-term variability (SD2). Advanced methods include rotation and segmentation of the plot to analyze specific trends and patterns in HRV dynamics, providing deeper insight into autonomic regulation.
Clustering CADF phenotypes by using HRV parameters
To quantify the extent of CADF in unmedicated patients with SCZ, we applied an unsupervised machine learning clustering algorithm to HRV parameters from the previously described domains (Fig. 1). Supplementary Table S2 summarizes all 97 HRV parameters analyzed in this study.
First, we scanned all HRV parameters for outliers using a median absolute deviation threshold of 10%. An imputation strategy using mean values was employed to replace missing or zero values. This step ensured a complete dataset, which is crucial for subsequent analysis. Next, the data was standardized using robust range scaling to normalize the feature set.
The k-means and Gaussian Mixture Model (GMM) algorithms were used to partition data sets according to HRV parameters into a defined number of clusters53. K-means is the most-used clustering technique for its simplicity and efficiency. Gaussian processes provided a more flexible, probabilistic approach, which was useful in capturing potential non-linear relationships and uncertainties in the data. In k-means, clusters of data points were defined by cluster centroids that have small distances to other points of this cluster but large distances to centroids of other clusters. In an iterative process, data points were assigned to their nearest cluster centroid and optimal cluster centroids were re-calculated. The process continues, reducing the sum of distances after each reassignment to minimize the sum of point-to-centroid distances.
GMM assumes that the data points within each cluster are generated from a mixture of several Gaussian distributions with unknown parameters. Unlike k-means, where each data point is assigned exclusively to one cluster, GMM allows for soft clustering. This means that each data point is assigned a probability distribution over all clusters, reflecting the uncertainty about its cluster assignment. This flexibility can be advantageous when dealing with data that doesn’t have clearly defined boundaries between clusters.
We determined the optimal number of clusters by systematically evaluating several established clustering performance indices. The Silhouette Score was used to assess the compactness and separation of clusters, with higher scores indicating better-defined clusters and the peak score corresponding to the most appropriate number of clusters. The Calinski-Harabasz Index evaluated the ratio of between-cluster dispersion to within-cluster dispersion, with higher values reflecting more distinct clustering structures. The Davies-Bouldin Index measured the average similarity between each cluster and its most similar counterpart, where lower values indicated better separation and compactness. To identify the optimal clustering solution, we evaluated these indices across a range of cluster counts (k) from 2 to 14 separated by k-means. The final number of clusters was determined by selecting the k value at which the Silhouette Score peaked, further validated by maximizing the Calinski-Harabasz Index and minimizing the Davies-Bouldin Index.
The hyperparameters for each clustering method, such as the initialization method, the number of initializations for K-means, and the initialization parameters and covariance type for GMM, were meticulously optimized, ensuring the robustness of our methodology. All algorithms used here are part of the scikit-learn (version 1.2.2) package implemented in python (version 3.11.3)54.
Statistical analysis
Statistical analyses were performed using SPSS for Windows (version 26.0). Multivariate analysis of variance (MANOVA) was performed to assess differences in HRV parameters between diagnostic groups (SCZ vs. HC). To evaluate HRV differences between patient clusters (CADF vs. no CADF), age and sex were included as covariates in the MANOVA.
To determine which HRV parameters contributed to CADF cluster classification, a bivariate Spearman correlation analysis was performed correlating each HRV feature with CADF group assignment (group = 1 for CADF, group = 0 for no CADF).
In addition, sociodemographic factors, psychometric scales, and clinical characteristics, including age, BMI, physical activity, smoking status, disease duration, and symptom severity (measured by SANS and SAPS) were compared between CADF clusters. Spearman correlation analysis was also performed to examine associations between sociodemographic variables, psychometric measures, and cluster assignment, with a focus on age, body mass index (BMI), disease duration, and symptom severity.
Results
Study sample and group comparisons of HRV parameters
Our sample consisted of 119 patients (52% female, mean age 32.8 years) and 119 healthy controls (45% female, mean age 31.5 years; see Supplementary Table S1 for details).
The MANOVA showed a significant effect of diagnosis (F = 2.306, p < 0.001) on HRV parameters.

Heartbeats were extracted from ECG recordings for all participants, and HRV parameters from multiple domains (e.g., time, frequency, and nonlinear dynamics) were derived from the interbeat interval series. These features were then used for clustering, with k-means and Gaussian mixture models applied to classify patient samples into distinct subgroups.
Prevalence of CADF in unmedicated patients with schizophrenia based on HRV clustering
After the automatic clustering of our data set, the cohort of 119 unmedicated patients with SCZ was divided into two clusters as indicated by different methods to derive the optimal number of clusters. K-means and Gaussian mixture models revealed the identical separation into two clusters containing 52.1% (CADF) and 47.9% (no CADF) of patients with SCZ (see Fig. 2).
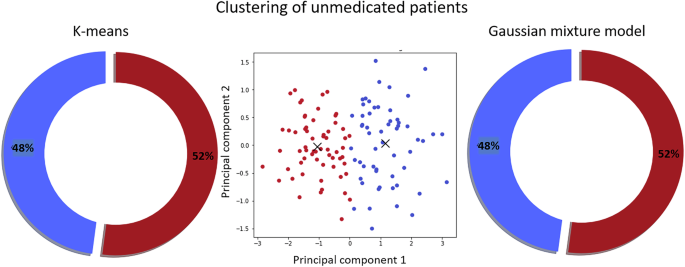
Two clustering techniques, k-means (left) and Gaussian mixture model (right), produced identical patient group separations. The middle panel visualizes the clustering using the first two principal components.
Differences in HRV parameters between clusters
The MANOVA revealed significant differences in HRV parameters between the CADF cluster and the HC group (F = 4.524, p < 0.001). As shown in Fig. 3, most HRV parameters in the CADF cluster deviated several standard deviations from the HC mean (red circles, Fig. 3B), indicating CADF in these patients. In contrast, HRV parameters in the no CADF cluster remained largely within half a standard deviation of the HC mean (blue circles, Fig. 3B), with no significant group differences (F = 1.336, n.s.).
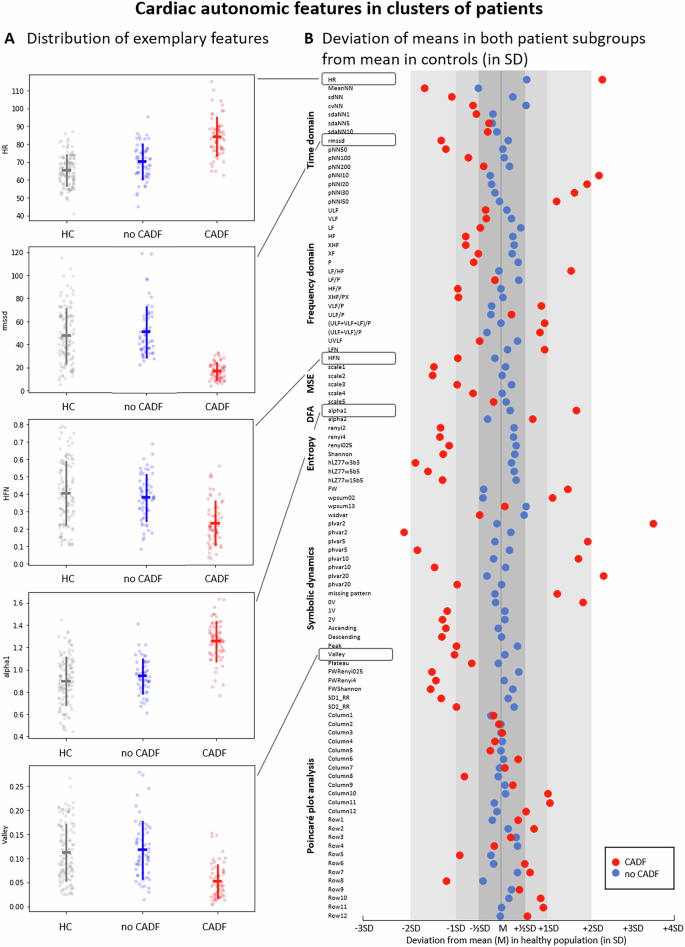
A Distribution of HRV parameters in healthy controls (HC) and patient clusters (CADF in red and no CADF in blue). Parameters shown include mean heart rate (HR), root mean square of successive interbeat intervals (RMSSD), normalized high-frequency power (HFN), short-term fluctuations in detrended fluctuation analysis (alpha1), and the proportion of the Valley symbolic pattern family. Error bars show standard deviation around the mean. B Deviation of the mean values of HRV parameters in the two patient clusters: red (CADF) and blue (no CADF) relative to the HC mean, expressed in standard deviation (SD) units of the control group. Abbreviations of the HRV parameters are detailed in Supplementary Table S2.
Correlation of HRV parameters with CADF clusters
To identify the HRV parameters relevant for CADF clustering, we performed a bivariate correlation analysis between each feature and CADF group assignments (see Supplementary Fig. S1). High positive correlation coefficients indicate that the higher this HRV parameter, the more likely this patient was classified in the CADF group.
The strongest positive correlations were observed in the two time-domain parameters: the percentage of consecutive NN intervals differing by less than 20 ms (pNNl20, r = 0.87) and 30 ms (pNNl30, r = 0.85), and the symbolic dynamics feature representing the number of rare word types (FW, r = 0.84). Conversely, the most pronounced negative correlations were found in two symbolic dynamics parameters: the proportion of high variability patterns (phvar5, r = −0.84) and the Renyi entropy of the word distribution (FWRenyi025, r = −0.82). In addition, the compression entropy (hLZ77w3b3) showed a significant negative correlation with the CADF clustering (r = −0.81).
Sociodemographic and clinical differences between CADF clusters
The CADF cluster differed significantly from the no CADF cluster in age (F = 5.11, p = 0.001) and BMI (F = 2.24, p = 0.027), while no significant differences were observed in physical activity or smoking status. Patients in the CADF cluster had a significantly longer disease duration compared to those in the no CADF cluster (T = −2.86, p = 0.003). In terms of symptom severity, patients in the CADF cluster had higher negative and positive symptom scores as measured by SANS (F(2,116) = 2.41, p = 0.009) and SAPS (T = −3.31, p < 0.001) compared to the no CADF cluster (See Supplementary Table S3 for details).
Age showed the strongest correlation with CADF classification, indicating that older patients were more likely to be identified in the CADF cluster. In addition, higher BMI, longer disease duration, and greater negative symptom severity were associated with CADF classification. Figure 4 summarizes these relationships using Spearman correlation analysis.
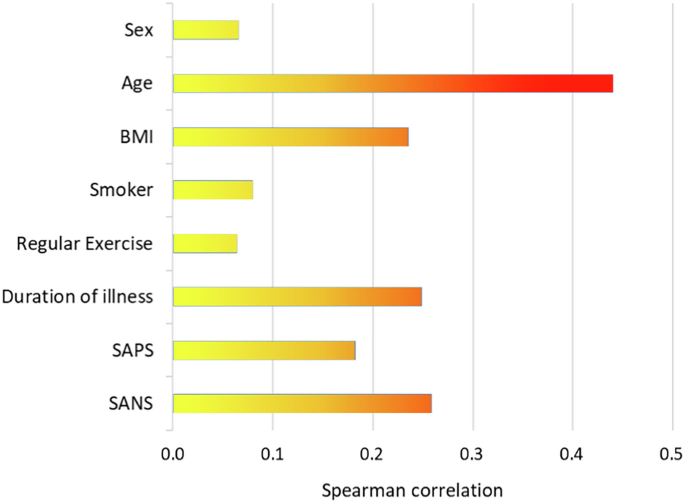
BMI body mass index, SAPS Scale for the Assessment of Positive Symptoms, SANS Scale for the Assessment of Negative Symptoms.
Discussion
This is the first study to examine the prevalence of CADF in a large cohort of unmedicated patients with SCZ. Based on a comprehensive analysis of multiple HRV parameters, the present study used unsupervised learning to show that approximately 50% of patients have significant impairments in cardiac autonomic modulation, independent of antipsychotic medication, compared to healthy controls.
Our classification approach showed strong robustness, with clusters remaining stable across multiple statistical tests. The fact that both k-means clustering and Gaussian processes produced the same classification further validates their reliability. While k-means is optimized for well-defined, linearly separable clusters, Gaussian processes account for more complex relationships and uncertainties, confirming that the clustering patterns reflect intrinsic data structures rather than methodological artifacts.
Given the critical role of vagal and sympathetic modulation in the regulation of essential cardiac function, such as chronotropy, inotropy, dromotropy, and lusitropy, CADF results in constant stress on the cardiovascular system, placing these patients at increased risk for cardiac events, including myocardial infarction, heart failure, and sudden cardiac death12,13,14,15. Notably, even patients classified as “no CADF” showed considerable deviations in several HRV parameters compared to healthy controls, suggesting that the at-risk population may be even larger.
From a clinical perspective, the identification of these patients at increased cardiac autonomic risk is crucial. To ensure rigorous and unbiased identification of HRV parameters associated with CADF clustering, we used correlation-based feature analysis rather than classification-based approaches, ensuring transparency and interpretability without introducing potential classification biases.
Among the 97 HRV parameters, mean heart rate (HR) contributed significantly to clustering, which is particularly noteworthy because “simply taking the pulse” serves as an immediate indicator of cardiovascular risk16, as HR is an independent predictor of reduced life expectancy in both the general population and CVD patients55,56, with a 10 bpm increase associated with a 30% increase in mortality57.
However, nonlinear measures, which quantify the unpredictability and randomness of heart rate dynamics, are highly sensitive to subtle signal variations and effectively capture higher-order HRV characteristics that are commonly disrupted in SCZ28. Notably, both nonlinear complexity measures, particularly those derived from symbolic dynamics and entropy, as well as classical HRV parameters, such as pNNI20, have proven highly relevant for CADF classification. These findings highlight the importance of integrating multiple HRV metrics to enhance clustering robustness and improve risk stratification and patient identification. Thus, parameters such as pNNl20 (time domain) and phvar5 (symbolic dynamics) may emerge as powerful biomarkers for CADF in SCZ, warranting further validation for their role in refining cardiac risk screening in clinical practice.
The underlying biological mechanisms leading to CADF remain unclear. It is uncertain whether CADF is an intrinsic feature of SCZ or whether both conditions share common pathophysiological pathways. Interestingly, first-degree relatives of SCZ patients also exhibit reduced HRV, suggesting a possible genetic predisposition17,58,59,60. Advances in genetics have identified SCZ-associated loci that regulate cardiac function, further strengthening these links18,19,61,62,63,64. In addition, CADF may manifest before the clinical onset of SCZ, raising questions about its potential role as an early biomarker65,66.
Beyond genetic factors, several external sociodemographic and clinical variables emerge during disease progression and may influence the severity of CADF in SCZ according to individual predisposition. For instance, our data are consistent with previous findings indicating an age-related decline in cardiac autonomic function67,68,69, as the CADF cluster was significantly older compared to the no CADF subgroup. In addition, patients in the CADF cluster had higher positive and negative symptom scores, which is consistent with previous research linking symptom severity to CADF25,70,71. While increased positive symptom scores may reflect stressful experiences during psychotic episodes, higher negative symptom scores may be confounded by a greater proportion of chronicity in these patients16,25. These findings support the widely accepted view that age, disease chronicity, and symptom severity collectively contribute to CADF in SCZ25. Accelerated brain aging, particularly within the central autonomic network72,73, may underlie these associations, as it has been linked to mental disorders, particularly psychotic conditions, with longer disease duration correlating with advanced brain aging74.
In addition, chronic stress, lifestyle factors, and metabolic dysfunction may contribute to progressive autonomic decline over time. Thus, increased BMI was also a significant factor associated with CADF clustering, with elevated BMI levels observed in the CADF cluster. This is consistent with previous studies linking excess body fat to reduced vagal modulation in both the general population and individuals with mental disorders75,76,77,78,79. The relationship between CADF and increased BMI appears to be bidirectional: the vagus nerve plays a central role in regulating metabolic homeostasis, and autonomic dysfunction may contribute to energy imbalance80,81. Conversely, chronic low-grade inflammation and metabolic dysregulation associated with obesity may further exacerbate CADF, underscoring the need for targeted interventions to reduce obesity-related cardiovascular risks79,82.
Although smoking prevalence did not differ significantly between clusters in our cohort, its ubiquitous role as a modifiable lifestyle factor also warrants attention. Smoking is highly prevalent in patients with SCZ83 with well-documented effects on autonomic regulation, primarily by impairing vagal control of heart rate and increasing sympathetic activity via catecholamine release84,85,86,87. However, previous studies have reported conflicting results, likely due to population heterogeneity, BMI confounders, and differences in short-term versus long-term effects of smoking on autonomic function87,88,89,90,91, underscoring the need for further research.
The main findings of the present study hold several relevant implications for future research. First, cardiovascular risk profiling in mental disorders should be optimized by implementing HRV-based analyses, as current approaches focus primarily on metabolic factors92,93,94 and neglect obvious intrinsic changes in cardiac rhythmicity. While heart rate analysis has long been established as a tool for cardiac risk assessment in clinical cardiology37,95,96,97,98, data on prognostic relevance in mental disorders are lacking. Second, targeted interventions are needed to improve physical health and quality of life of these patients. Regular physical activity is a key approach99,100,101, but many patients with SCZ do not benefit from standard aerobic exercise in terms of cardiorespiratory fitness or HR99,102, highlighting the need for tailored exercise programs. Finally, patients with severe mental disorders remain less likely to receive cardioprotective treatments after cardiac events103,104, despite evidence that such treatments significantly reduce mortality105. Addressing barriers to care, such as integrating physical health needs into mental health care systems, is critical to overcoming patient nonadherence and improving access to somatic care106,107, ultimately improving cardiovascular outcomes in SCZ.
Several limitations of this study need to be considered. First, a major limitation of this study is its cross-sectional design. Although large-scale longitudinal studies strongly indicate that elevated HR and reduced HRV are linked to increased mortality and morbidity, this study cannot directly confirm an elevated cardiac risk in CADF patients. Moreover, we are not able to evaluate the course of CADF in our cohort. Second, our patient cohort stood out for their smoking habits. Since tobacco use affects numerous central and peripheral autonomic functions, we cannot separate the alterations due to the disease from those due to smoking108. Third, since no further cardiac diagnostic examinations such as echocardiography were performed, the presence of structural heart diseases could not be assessed. Further, we cannot assess a subclinical somatic disease although we have not observed any indication of an underlying inflammatory or cardiac disease during hospitalization. Fourth, HRV parameters were derived from 30-minute ECG recordings. To account for circadian influences, long-term measurements over a 24-hour period would be required. Further, despite of prior toxicological testing and precise medical records on an antipsychotic-free interval of at least 8 weeks, possible drug residues or compensatory processes by previous medication affecting autonomic function cannot be ruled out completely. Finally, a potential limitation is the possible influence of routine psychotherapeutic interventions on HRV, although no specific stress reduction therapies were administered.
In conclusion, this is the first study to investigate the extent of CADF in unmedicated patients with SCZ, showing that approximately half of the cohort had significant HRV reductions associated with increased cardiac risk. These patients were more likely to have chronic disease, greater symptom severity, older age, and higher BMI. Given the marked increase in cardiovascular mortality in SCZ, future studies should focus on refining cardiac risk prediction models and developing targeted interventions to mitigate CADF, ultimately improving long-term health outcomes in this vulnerable population.


Responses