Chromosome-level genome assembly and annotation of pawak croaker (Pennahia pawak)
")
Background & Summary
The Sciaenidae family, within the order Perciformes, comprises approximately 270 species across 70 genera distributed globally1 Fig. 1. These species are of significant commercial importance, primarily serving as food fish. A unique characteristic of sciaenids is their ability to produce croaking sounds1, which play various ecological roles. While Sciaenidae species share similar morphological traits, their body color is highly variable, including black, yellow, multi-colored, and color-changing patterns2. In contrast to other Sciaenidae, species in the genus Pennahia generally exhibit a monotone and stable body color, primarily presenting a silver-white hue3. This distinct coloration makes them ideal candidates for studying fish body colour variation, particularly in the context of countershading camouflage and light response adaptations. To better understand these traits, we sequenced and investigated a high-quality genome of this species.
")
Pawak croaker, P. pawak was collected from the intertidal zone of Zhoushan, Zhejiang Province, China.
We integrated multiple sequencing technologies, including Illumina sequencing, PacBio circular consensus sequencing (CCS), and Hi-C techniques. The final assembly size of the P. pawak genome was 613.02 Mb, with 99.31% of the contigs anchored to 24 chromosomes. The contig N50 length was 26.06 Mb, and the scaffold N50 length was 27.09 Mb. The genome contained 26.20% repetitive sequences. We predicted a total of 25,885 protein-coding genes, with 98.19% functionally annotated, reflecting the high quality of the assembled genome. These comprehensive genomic resources will facilitate future research into the molecular mechanisms of fish body color polymorphism and the adaptive mechanisms of P. pawak.
Methods
Sampling
The P. pawak sample was collected from the intertidal zone of Zhoushan, Zhejiang Province, China (30.65°N, 122.78°E). The dissection of the sample was conducted in a sterilized environment, where organs including muscle, liver, and brain were sampled and snap-frozen in liquid nitrogen for nucleic acid extraction. All anatomical procedures complied with ethical regulations set by the Institutional Animal Care and Use Committee of Zhejiang Ocean University, Zhejiang, China (Protocol Number: 2023082). The size and integrity of the extracted DNA and RNA were evaluated using 1% agarose gel electrophoresis. Additionally, the concentration and purity of DNA and RNA were analyzed using a Nanodrop 2000c ultraviolet spectrophotometer.
Library construction & sequencing
Genomic DNA was extracted from muscle samples using the E.Z.N.A.® Tissue DNA Kit (Omega Bio-tek, USA). For HiFi library preparation and sequencing, the SMRTbell prep kit 3.0 was used, and sequencing was performed in CCS mode on the PacBio Sequel II system (Pacific Biosciences, USA), following the manufacturer’s protocols. For Illumina sequencing, a short-fragment library with an insert size of 300–500 bp was prepared using the TruSeq™ Nano DNA Sample Prep Kit (Illumina, USA). The library was purified with AMPure XP Beads (Beckman Coulter, USA) and sequenced on an Illumina NovaSeq 6000 platform (Illumina, USA) to generate 150-bp paired-end (PE150) reads. Hi-C library preparation and sequencing were performed with muscle tissue using a Dovetail Hi-C Core Kit (Dovetail Genomics, USA) following protocol instructions. The library was assessed with an Agilent 2100 Bioanalyzer (Agilent, USA) to ensure sufficient concentration and an insert size of 300–500 bp. Sequencing was done on an Illumina NovaSeq. 6000 platform (Illumina, USA) to generate PE150 reads. For transcriptome analysis, muscle, brain, and liver tissues of P. pawak were processed individually to generate separate transcriptomic data for each tissue. Total RNA was extracted using an E.Z.N.A.® HP Total RNA Kit (Omega Bio-tek, USA) following the manufacturer’s instructions. The quality and concentration of the extracted RNA were assessed using a NanoDrop® Series (Thermo Scientific, USA) and an Agilent 2100 Bioanalyzer. Three cDNA libraries(muscle, liver, brain; Table 4) were prepared from total RNA using the NEBNext® Ultra™ RNA Library Prep Kit (New England Biolabs, USA) and sequenced on an Illumina NovaSeq. 6000 platform (Illumina, USA).
Quality control of raw sequencing data
All raw sequencing data were processed to remove adaptors, low-quality bases, and duplicate reads using various strategies based on the platform. For Illumina PE150 reads, Trimmomatic v0.394 was used with parameters set as “ILLUMINACLIP:adapters.fa:2:30:10 SLIDINGWINDOW:4:15 MINLEN:75” to remove adaptor sequences, low-quality reads, and short sequences. The quality assessment of the cleaned data was conducted using FastQC software v0.11.35, which showed very high base scores, indicating high quality of the sequencing data(Fig. 2). The same filtering methods and parameter settings were applied to the Hi-C and RNA-seq data. The sequencing data output included 84.03 Gb of Illumina PE150 reads (Table 1), 50.75 Gb of HiFi long reads with an N50 length of 18.40 Kb (Table 2), 73.95 Gb of Hi-C sequencing data (Table 3), and transcriptome data consisting of 32.60 Gb from the liver, 36.68 Gb from muscle, and 32.50 Gb from the brain (Table 4).
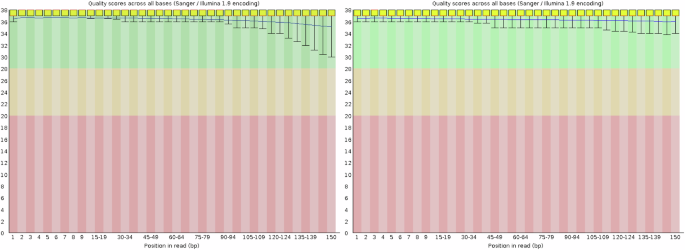
Base quality examined for Illumina PE150 reads using FastQC software. Note: X-axis represents the position in reads, and the Y-axis represents the quality scores across the bases. The colored area illuminates the low (pink), middle (yellow) and high (green) quality scores of the bases.
Genome size estimation
Illumina PE150 reads were used for genome size estimation based on k-mer analyses. Filtered high-quality Illumina PE150 reads were analyzed using jellyfish software v2.2.66 with parameters set as “-C -m 21”.The genome size was calculated using the formula: genome size = TKN21-mer/PKFD21-mer, where TKN21-mer represents the total number of k-mers and PKFD21-mer represents the peak frequency depth of the 21-mer. The analysis revealed an estimated genome size of approximately 570.33 Mb for P. pawak. We used GenomeScope software v2.0.17 with parameters set as “-k 21 -p2” to generate the k-mer frequency distribution plot. The k-mer distribution of the genome exhibited three peaks (Fig. 3), which likely correspond to heterozygous, homozygous, and repeated k-mers, as commonly observed in many other teleost fishes8,9.
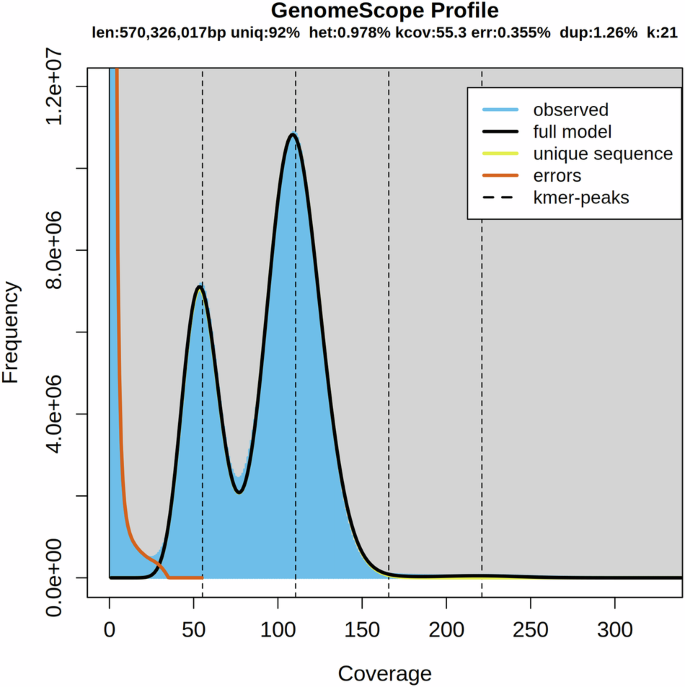
K-mer analysis for the genome size evaluation in P. pawak. Note: The distribution of 21-mer frequency in P. pawak genome was shown. The X-axis represents the k-mer depth, and the Y-axis represents the frequency of the k-mer for a given depth. The first, second and third peaks in the figure corresponded to the heterozygous homozygous, and repeated Kmers, respectively.
Genome assembly
Illumina PE150 reads, which have a relatively higher error rate at the single-base level compared to HiFi long reads, underwent error correction using BLESS software v0.6.310 with parameters set as “-kmerlength 21” to produce clean reads.These corrected reads were then assembled into the genome using Hifiasm software v0.19.8-r60311 with parameters set to “-t 50 -l 0”. Redundant heterozygous contigs were identified and removed using Purge_haplotigs software v1.1.212. The preliminary assembly resulted in a genome size of 617.29 Mb, with 53 contigs and a contig N50 of 26.06 Mb (Table 5). Hi-C sequencing data were employed for chromosome assembly using ALLHIC software v0.9.813, using parameters set to “-e GATC -k 8 -m 50” Interaction maps were generated and error-corrected using Juicer software14 and JuiceBox software v1.11.0815 (Fig. 4). This process produced 24 chromosomes with a scaffold N50 of 27.09 Mb (Table 5; Figs. 4, 5)) and an assembly rate of contigs into chromosomes reaching 99.31% (Table 6). The chromosome number aligns with closely related species such as Collichthys lucidus8, Miichthys miiuy16, and Larimichthys crocea17. Heatmap analysis indicated that all 24 pseudochromosomes were distinguishable (Fig. 4), with strong interaction signals around the diagonal, showcasing the high quality of the genome assembly.
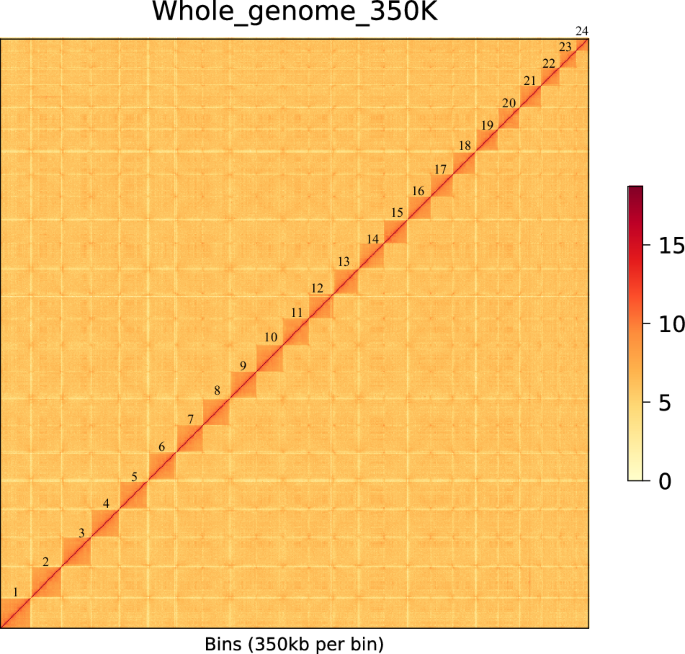
A heatmap of chromosome interaction in P. pawak, the blocks represent the 24 pseudochromosomes. Note: The color bar illuminates the contact density from white (low) to red (high).
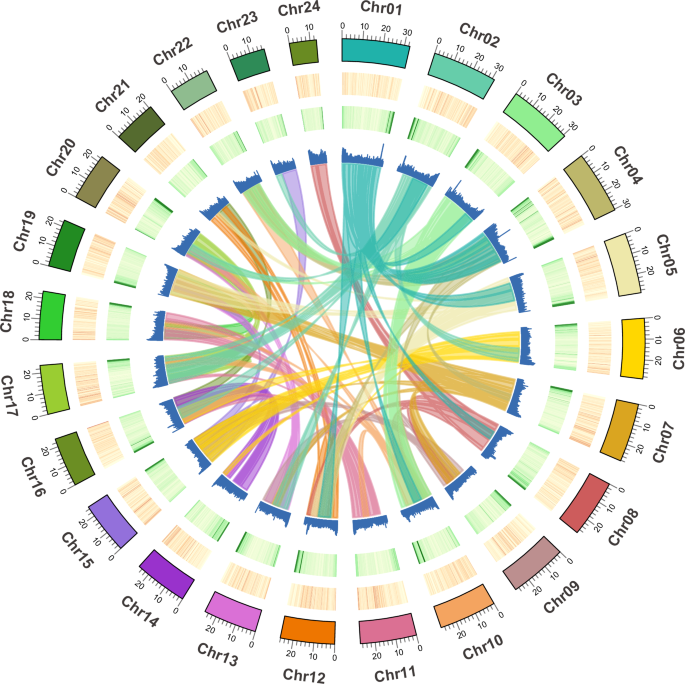
Circos plot indicating gene density, repetitive sequences, GC content, and colinear relationship among chromosomes of the P. pawak genome assembly.
Genome evaluation
The completeness and accuracy of the P. pawak genome assembly were thoroughly assessed. The Contig N50 was 26.06 Mb, and the Scaffold N50 was 27.09 Mb. BUSCO analysis, conducted using BUSCO software v5.4.718 against the Actinopterygii single-copy orthologous gene library, identified 3,640 core genes, including 3,547 complete genes (97.45%), 3,515 single-copy genes (96.57%), 32 multi-copy genes (0.88%), 23 fragmented genes (0.63%), and 70 missing genes (1.92%)(Table 7). Short reads mapping ratio analysis involved building a genome index using BWA-MEM v0.7.17-r118819 with the parameters set to “-a bwtsw” resulting in a total mapping rate of 97.82%, a paired mapping rate of 96.76%, and a properly paired mapping rate of 83.98% for Illumina PE150 reads(Table 8). Additionally, transcript mapping ratio analysis, performed by building a genome index with HISAT2 v2.1.020 and mapping transcripts to the genome, showed that 624,504,850 reads were mapped with a mapping rate of 97.13% (Table 9). These analyses indicated a high-quality chromosome-level assembly of the P. pawak genome.
Annotation of repetitive sequences
Repetitive elements in the P. pawak genome were annotated using a combination of homology prediction with the Repbase library21 and de novo prediction based on self-sequence alignment and repetitive sequence features. Tandem repeats were annotated using Tandem Repeat Finder v4.0922 with parameters set as “Match = 2, Mismatch = 7, Delta = 7, PM = 80, PI = 10, Minscore = 50, MaxPeriod = 2000 -d -h”. Transposable elements (TEs) were identified through de novo prediction at both DNA and protein levels. For the DNA level, RepeatModeler v1.0.1123 (-database redb -pa 10) was employed to build a de novo repeat library, and RepeatMasker v4.0.724 (-nolow -no_is -norna -pa 2) was used to identify homologous repeats against the de novo library and Repbase. At the protein level, RepeatProteinMask v4.0.7 was utilized to search for TEs in its protein database. The annotation results of all repetitive sequences were merged into a final dataset. This comprehensive annotation revealed that 160.64 Mb of sequences, accounting for 26.20% of the P. pawak genome, were repetitive (Table 10). Of these, 82.26 Mb were transposable elements, making up 13.42% of the genome (Table 10). The identified types of TEs included DNA elements, which accounted for 6.81% (41.75 Mb) of the genome, long interspersed nuclear elements (LINEs) at 3.03% (18.56 Mb), short interspersed nuclear elements (SINEs) at 0.35% (2.17 Mb), and long terminal repeats (LTRs) at 3.23% (19.79 Mb).
Prediction of protein-coding genes
A high-confidence gene set for the P. pawak genome was annotated using a combination of three strategies: de novo prediction, homology-based prediction, and transcript-based prediction. De novo prediction was performed using Augustus software v3.3.325 was used with parameters set to “-species = pasa.gb.train -noInFrameStop = true -gf3 = on -strand = both” to ensure accuracy. The gene model file (pasa.gb.train) was generated using transcriptome data to provide a species-specific model for more precise gene predictions. Homology-based prediction involved aligning protein-coding gene sequences from closely related species such as L. crocea (GCF_000972845.2)26, Nibea albiflora (GCA_014281875.1)27, C. lucidus (GCA_004119915.2)28, Scatophagus argus (GCF_020382885.2)29, Chelmon rostratus (GCF_017976325.1)30, Cheilinus undulatus (GCF_018320785.1)31, Cyprinus carpio (GCF_018340385.1)32, and Danio rerio (GCF_000002035.6)33 to the P. pawak genome using BLAST software v2.14.034 with a stringent e-value of 1e-9. The BLAST results were then processed using Wise software v2.4.135 with parameters set to “-init local -alg 623 -gap 12 -ext 2 -pretty -genes -quiet” to identify homologous genes. For transcript-based prediction, transcripts were assembled using StringTie software v2.1.336 with parameters set to “-f 0.1 -m 200 -a 10 -c 2.5 -g 50 -M 1.0” and RNA-seq data were mapped using HISAT2 software v2.1.020 with parameters set to “-summary-file -S -x -1 -2”. Coding regions were predicted using TransDecoder software v5.5.0 with parameters set to “-retain_long_orfs_length 150 -T 500”. The results from all three strategies were integrated using EVidenceModeler software v1.1.137 with parameters set to “-segmentSize 500000 -overlapSize 10000”, resulting in the prediction of 26,361 protein-coding genes in the P. pawak genome(Table 11). Quality validation showed similarities in the distributions of mRNA length, CDS length, exon length, and intron length between the P. pawak genome and those of closely related species (Fig. 6), indicating similar patterns of gene structure distribution.
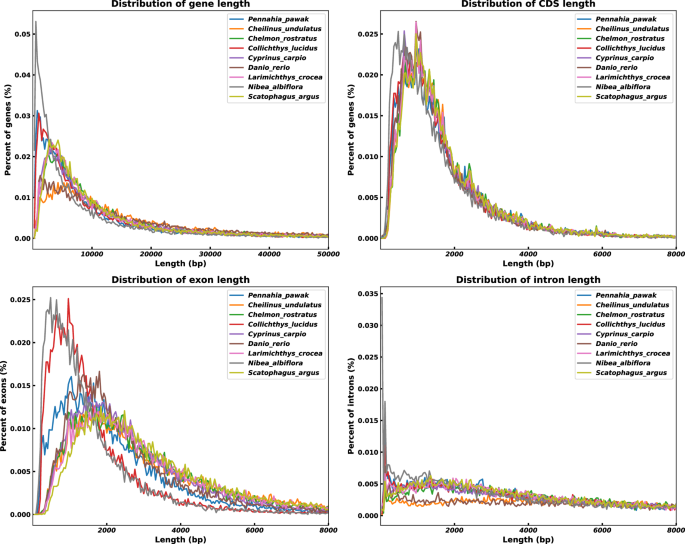
The length of protein-coding genes in P. pawak and their closely related species. Note: The gene length, CDS length, exon length, and intron length were compared among P. pawak and the other eight teleost species to verify the quality of gene annotation.
Functional annotation of protein-coding genes
The quality of the gene annotation and functional information of the P. pawak genome was evaluated by comparing the predicted protein sequences with existing public protein databases. The databases used for comparison included InterPro38, Gene Ontology (GO)39, Kyoto Encyclopedia of Genes and Genomes (KEGG)40, SwissProt41, Pfam42, the NCBI Non-Redundant Protein Sequence Database (NR) (https://www.ncbi.nlm.nih.gov/refseq/about/non-redundantproteins/), eggNOG43, and Eukaryotic Orthologous Groups of Proteins (KOG)44. Functional information analysis was conducted using BLAST software v2.14.034. The annotation results showed that a total of 25,885 genes were annotated, accounting for 98.19% of the protein-coding genes. Only 476 genes, representing 1.81% of the protein-coding genes, could not be annotated (Table 11). These findings suggest a reliable assembly and annotation of the P. pawak genome.
Data Records
The Illumina (SRR30242865), PacBio HiFi (SRR30242864), Hi-C (SRR30242861), and RNA-seq (SRR30242854-SRR30242860, SRR30242862- SRR30242863) data used for the genome assembly of P. pawak were deposited in the Sequence Read Archive (SRA) of the National Center for Biotechnology Information (NCBI)45. Chromosome-level genome assembly of P. pawak was deposited in the NCBI genome database under accession number GCA_042310395.146. The genomic annotation results of P. pawak genome assembly can be found in the Figshare database under DOI code: https://doi.org/10.6084/m9.figshare.2679337947.
Technical Validation
Genome evaluation
Multiple evaluation metrics were utilized to assess the quality and robustness of the P. pawak genome assembly. The assembly was meticulously evaluated using N50, BUSCO, the short reads mapping ratio, and the transcripts mapping ratio. The results confirmed the assembly’s strong contiguity, with a high percentage of complete and single-copy genes detected. Additionally, the high mapping rates of both short reads and transcripts underscored the accuracy and reliability of the assembly. These results collectively indicate that the P. pawak genome assembly is of high quality, making it a reliable resource for future genomic studies and bioinformatics applications.


Responses