Classification of NSCLC subtypes using lung microbiome from resected tissue based on machine learning methods

Introduction
Adenocarcinoma (AC) and squamous cell carcinoma (SCC) are two major subtypes of non-small-cell lung cancer (NSCLC), accounting for more than 80% of lung cancer (LC) cases1,2. A late diagnosis of NSCLC at an advanced stage, a high rate of metastasis, and the development of therapy resistance are responsible for approximately 95% of mortality3. Despite advancements in therapeutic strategies, NSCLC patient survival has not increased significantly. In the United States, the relative survival of 5-year for patients with stage I was 65%, while the patients with stage IV were less than 10%4. Even if the patient underwent surgical resection, the post-operative recurrence rate remains high. Almost 50–90% of postoperative recurrence occurs in the first 2 years5. However, targeted and contemporary immune-based therapy have minimally improved NSCLC survival6,7,8. The probable reason for the poor survival of NSCLC might be due to the underlying heterogeneity and variance in the cell populations9.
AC and SCC have significant heterogeneity, different features, prognostic consequences, and therapeutic responses10,11. Owing to high heterogeneity and variance in NSCLC subtypes, their early-stage classification poses a significant challenge for medical professionals. AC originates from the epithelial cells lining alveoli and airways, where gaseous exchange occurs. These malignant cells often form gland-like structures and produce mucin, a hallmark of AC. Histologically, these cells exhibit columnar or cuboidal shapes, with hyperchromatic and prominent nucleoli exhibiting growth patterns such as acinar, papillary, micropapillary, solid, and lepidic12,13. Additionally, these cells express specific markers like thyroid transcription factor-1 (TTF-1) and napsin A, which aid in differentiating AC from other LC types14. Environmental factors, including smoking, air pollution, and exposure to carcinogens such as asbestos and radon, are strongly associated with an increased risk of AC15,16,17. Molecularly, AC is related to mutations in oncogenes such as EGFR, KRAS, ALK, and BRAF, driving uncontrolled cellular proliferation. Treatment response in AC is primarily determined by these genetic mutations with EGFR (e.g., osimertinib) and ALK inhibitors (e.g., crizotinib), improving outcomes in targeted populations18,19. Immunotherapies like PD-1/PD-L1 inhibitors (e.g., pembrolizumab) have shown significant benefits in patients with high PD-L1 expression20. In contrast, SCC arises from squamous epithelial cells in the bronchial airways, typically in the central lung regions. It is strongly linked to prolonged exposure to carcinogens, particularly cigarette smoke, which induces mutations in critical genes like TP53, PIK3CA, FGFR1, and CDKN2A. These mutations disrupt cell cycle regulation, apoptosis, and oncogenic signaling, promoting tumorigenesis. Specifically, mutations in TP53 and CDKN2A impair tumor suppressive functions, disrupting cell cycle control and apoptosis. Alterations in PIK3CA and FGFR1 enhance oncogenic signaling pathways, promoting uncontrolled cell growth and survival21,22. Other risk factors, including air pollution, asbestos, and radon exposure, also contribute to SCC development23. Histologically, SCC is characterized by keratinized squamous cells, hyperchromatic nuclei, high nuclear-to-cytoplasmic ratios, and keratin pearl formation, reflecting its aggressive phenotype. This cellular architecture, coupled with marked pleomorphism, reflects the aggressive phenotype of SCC24. Growth patterns include solid and papillary structures, with occasional clear-cell or basaloid features12.
Although overall survival rates have improved due to targeted therapies with driver mutations and immunotherapy, resistance to these therapies remains a significant challenge in AC. Furthermore, unlike AC, SCC lacks frequent targetable mutations like EGFR or ALK, limiting therapeutic options25. Additionally, only a small portion of NSCLC patients achieve sustained and optimal responses to immunotherapy. For those who develop resistance to immunotherapy, it presents a critical clinical challenge, with no effective treatment options currently available and a consequent poor prognosis. This issue is further exacerbated in NSCLC patients diagnosed at advanced stages, who face poor prognosis and limited treatment modalities, underscoring the need for novel therapeutic strategies. Thus, early detection and optimized treatment strategies for NSCLC subtypes are urgently needed, which can be achieved by a more significant understanding of the commensal lung microbiome.
The lung microbiota entails a wide range of microorganisms that play a pivotal role in NSCLC etiology19,20,21,22,23,24,25. Growing research has suggested that an imbalanced lung microbiota, termed “dysbiosis,” can cause carcinogenesis through genomic instability, affecting metabolism, induction of inflammatory pathways, and immune response in the host22,26,27,28. For example, studies have shown that certain bacteriotoxins and other pro-inflammatory factors from microorganisms such as Haemophilus influenzae, E. coli, Enterobacter spp., Moraxella, and Legionella genera are correlated that drive the inflammation of lung tissue and contribute to the formation of tumors, to promote carcinogenesis29. Zheng et al. indicated that Firmicutes and Enterobacter are associated with NSCLC through chronic inflammation-associated carcinogenesis. This suggests the causative relationship between specific microbes and cancer development30. Su et al. analyzed lung microbiome in NSCLC patients from four different sites, including lung tumor tissues, matched para-tumor tissues, matched bronchial tissues, and distal normal lung tissues. They found the predominance of Firmicutes, Desulfobacterota, Proteobacteria, and Bacteroidota and suggested their role in carcinogenesis. Moreover, they also found an inverse relationship between host physiological conditions like BMI and alpha diversity within the lung microbiome. This implies that individuals with higher BMI may exhibit lower microbial diversity within their lung microbiome. The interplay between host physiological conditions and microbiome diversity provides novel clues for mechanistic insights into NSCLC development and progression31.
Recent research has highlighted the significant difference in the microbial communities of AC and SCC, which needs to be explored for their potential as predictive and diagnostic markers for early screening of NSCLC complemented with ML methods. For instance, Druzhinin et al. investigated variations in the sputum microbiome among patients with AC, SCC, and healthy controls. Using the LEfSe method, they identified an increased abundance of genera Streptococcus, Bacillus, and Rothia in SCC patients compared to those with AC. However, no significant differences in bacterial composition were observed between AC patients and healthy controls. Sputum samples from SCC patients also exhibited higher levels of genera such as Streptococcus, Bacillus, and Peptostreptococcus compared to controls. These findings indicate distinct microbiome profiles associated with NSCLC histological subtypes32. Similarly, Gomes et al. characterized microbial communities from bronchoalveolar lavage fluid (BALF) samples of AC and SCC patients. They identified a predominance of phylum Proteobacteria across LC cases, with a distinct enrichment of family Enterobacteriaceae in SCC. In AC, the microbiota was characterized by an increased abundance of genera Acinetobacter and Propionibacterium. These findings suggest distinct microbial profiles between AC and SCC, highlighting their potential as biomarkers for patient stratification, prognosis, and therapeutic intervention33. Another recent study by Jang et al. evaluated the BALF of AC and SCC patients. They suggest most patients exhibit overlapping lung microbiome signatures in NSCLC subtypes with varying compositions. They also found that the species Actinomyces graevenitzii was predominant in SCC, while Haemophilus parainfluenzae, Neisseria subflava, Porphyromonas endodontalis, and Fusobacterium nucleatum were enriched in AC. This study highlighted the role of microbiome diversity in lung homeostasis and its potential association with NSCLC progression and prognosis34. However, while these studies identified significant differences between AC and SCC, they did not explore these variations for potential microbial markers or NSCLC subtype classification complemented with ML-based methods. The reliance on BALF and sputum samples also introduces potential contamination from the upper respiratory tract and environmental sources, which may confound results.
In this work, we aimed to analyze the significant differences in resected lung tumor microbiome composition from AC and SCC patients, which are predominant subtypes in NSCLC. Resected lung tissue microbiomes more accurately represent the lung’s microbial community as they are less influenced by external contaminants such as those from the oral cavity or upper airways. Unlike non-invasive methods like sputum or bronchoalveolar lavage, which may be contaminated by microbes from the upper respiratory tract or environmental particles, resected tissue is directly sampled from the lung parenchyma. This minimizes the effects of exogenous microbes, providing a more precise and reliable profile of the endogenous lung microbiome in NSCLC patients35. Additionally, metadata such as patient age, sex, smoking history, and environmental material (malignant or not) are also considered for analysis. These variables were not analyzed earlier, but they are necessary to predict whether the NSCLC subtype is curable. Furthermore, we improved existing methodologies by optimizing the selection of differential microbial features and integrating relevant metadata. By fine-tuning the hyperparameters of existing algorithms, we tailored their ability to achieve enhanced stratification of AC and SCC. We highlight novel microbial markers and provide deeper insights into subtype-specific microbial dynamics associated with the NSCLC subtype. This refined approach underscores the unique contributions of this study to the understanding of NSCLC microbiome heterogeneity.
Results
Taxonomic profiling of lung microbiota composition in AC and SCC
The relative taxon abundance in AC and SCC patients on phylum, class, order, family, genus, and species levels were classified and analyzed. The per-sample genus and phylum bacterial taxonomic distribution that varies significantly between individuals is shown in Fig. 1. The phylum/genus taxonomic characteristics of the lung tissue microbiota between the AC and SCC groups are presented in Fig. 1A, B, and the extended microbiota taxonomic profiles based on the class, order, and family level are given in Supplementary Fig. S1. At the phylum level, Proteobacteria (65.99%), followed by variation in Deinococcota (9.92%), Firmicutes (9.68%), and Bacteroidota (8.53%) were the most common in both the AC and SCC groups, shown in Fig. 1A. At the genus level, Acinetobacter (14.64%), Pseudomonas (14.21%), and Thermus (9.85%) were the core genera present in the AC and SCC samples as shown in Fig. 1B. Additionally, at the family level, the relative abundance of Pseudomonaceae (14.21%), Comamonadaceae (13.16%), Moraxellaceae (15%), Thermaceae (9.85%), and Weeksellaceae (5.44%) was increased more significantly in both groups, as shown in Supplementary Fig. S1.

Taxonomic characterization of the lung microbiota in NSCLC patients with AC and SCC at A Phylum level; B Genus level. Comparison of relative taxa abundance of the lung microbiota in NSCLC patients with AC and SCC at C Phylum level; D Genus level. (Only the relative abundance within each group >0.05% is shown). E Richness was used to evaluate the α-diversity in AC & SCC, respectively. The p-values were computed using the Wilcoxon rank sum test. F The difference in lung microbiota composition between the two groups was displayed by principal coordinate analysis (PCoA) based on Bray–Curtis metrics (p-value calculated based on the PERMANOVA test). The magenta and orange dots represent AC and SCC, respectively.
Figure 1C, D compares the relative taxa abundance of the lung tissue microbiota in AC and SCC patients at the phylum and genus levels. The microbiome composition, which was present in at least 0.05% of samples, is shown here. AC was found to be dominated by the phyla Proteobacteria (29.66%), followed by Deinococcota (7.88%) and Firmicutes (4.45%). In contrast, SCC was dominated by Proteobacteria (36.36%), followed by Firmicutes (5.24%), Bacteroidota (4.20%), and Deinococcota (2.05%) as represented in Fig. 1C. The genus Thermus (7.81%) dominated the microbiome, followed by Acinetobacter (7.07%) and Pseudomonas (4.23%) in AC, whereas, in SCC, Pseudomonas (9.98%) dominated the microbiome, followed by Acinetobacter (7.57%) and Streptococcus (2.64%) as shown in Fig. 1D. Additionally, at the family level, Thermaceae (7.81%) dominated the microbiome, followed by Moraxellaceae (7.31%), Comamonadaceae (6.83%), and Pseudomonadaceae (4.23%) in AC, whereas, in SCC samples, Pseudomonadaceae (9.98%) dominated, followed by Moraxellaceae (7.68%), Comamonadaceae (6.33%) and Sphingomonadaceae (3.20%), which are displayed in Supplementary Fig. S2. The shift in microbiome composition across different tumor stages I to IIIA is also compared and presented in Supplementary material (Supplementary Table S1).
Bacterial diversity and community structure analysis in AC and SCC
The richness and Shannon diversity index were calculated to measure differences in taxonomic diversity among AC and SCC groups. Comparatively, the taxonomic diversity of samples from the AC and SCC groups was significantly distinct. The richness and Shannon index revealed that α-diversity was higher in AC than in the SCC group, with a statistically significant p-value of 0.002, respectively, as shown in Fig. 1E. To evaluate the substantial variation in microbiome structure in AC and SCC, ecological distances were calculated based on the Bray–Curtis and visualized by principal coordinates analysis (PCoA plot) in Fig. 1F. The PERMANOVA with 10,000 permutations yielded a statistically significant p-value of 4e−04, implying no clear distinction between AC and SCC samples. There was relatively weak clustering between the AC and SCC groups, consistent with the findings reported by Gomes et al.33.
Differential microbiota compositions in AC and SCC
The LEfSe algorithm explores potential bacterial biomarkers by detecting taxa with differential abundance among the two groups (AC vs. SCC). This identified the specific lung tissue bacterial taxa associated with two groups. An LDA score above 2.0 indicated the most significant difference in taxa from the phylum to the species level, as shown in Fig. 2A. We found 74 differentially abundant taxa at different levels, including order Thermales, family Thermaceae, phylum Deinococcota, class Deinococci, genus Thermus, etc., differentially abundant in AC. On the other hand, SCC was enriched with the phylum Proteobacteria, class Alphaproteobacteria, family Oxalobacteraceae, genus Herbaspirillum, etc., as shown in Fig. 2A.
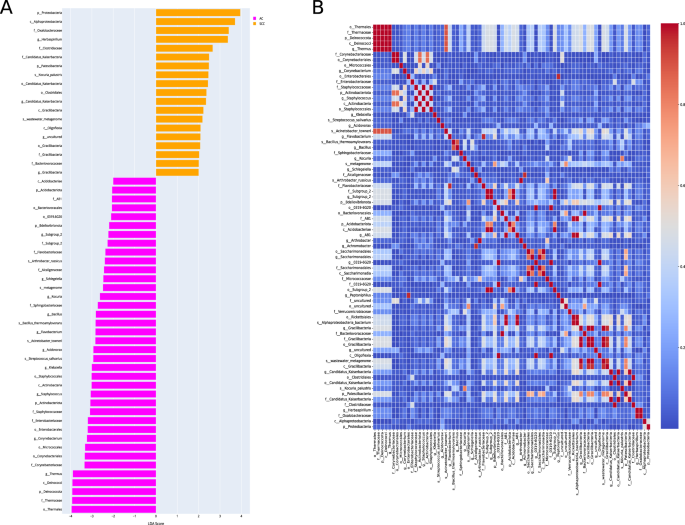
A Linear discriminant analysis effect size (LEfSe) of the dominant bacterial communities in AC and SCC groups. The pink and yellow bars indicate the taxa identified in greater relative abundance in patients with AC and SCC, respectively, with p < 0.05 and LDA ≥ 2.0. B The heatmap shows the Pearson’s correlation between taxonomic features selected from the AC and SCC groups. Features with a correlation coefficient > 0.95, likely due to taxonomic similarities (e.g., genus and order from the same classification level), were filtered to retain only one representative feature per correlated pair. This selection process reduced the feature set to 44 taxonomic features for further consideration.
After LEfSe, Pearson’s correlation analysis was performed to remove the highly correlated features; we achieved 44 features. For instance, the genus Thermus and order Thermales belonged to the same classification and had a correlation coefficient greater than 0.95. Therefore, only one feature from these highly correlated features was selected. The correlation heatmap of these taxonomic features is shown in Fig. 2B. Next, we selected five taxa of each AC and SCC class for our classifier. Thus, a total of 10 features were used for model training. Of these, ten bacteria features belong to the phylum Patescibacetria, Proteobacteria, class Alphaproteobacteria, order Thermus, Micrococcales, Enterobacterales, family Corynebacteiaceae, genus Herbaspirillum, Corynebacterium, and species Kocuria_palustris. The metadata features included environment material (malignant or non-malignant), host sex, host age, and smoking history.
Dimensionality reduction and data transformation using LDA
AC and SCC subtypes have similar lung tissue microbiomes but with varying compositions. Applying LDA transformation to our dataset reduced its dimensionality while maximizing the separation between AC and SCC. Supplementary Fig. S3 shows the dataset after LDA transformation. LDA identifies new axes in such a way that the variance of the original dataset is conserved while maximizing the inter-class distance and minimizing the intra-class distances at the same time. In our case, as the number of classes is two, LDA reduced our number of features to one. The maximum number of features after LDA transformation is always one less than the number of classes in the dataset. Then, we used our LDA-transformed data to classify two classes using the previously mentioned features.
Model evaluation
Performance assessment on the original test dataset
Given the differences in lung microbiome in AC and SCC, we hypothesized that the selected bacterial features might classify these subtypes and metadata information in patients with LC. To this end, we constructed several machine learning classifiers and deep neural networks to identify AC from SCC using the differential features. The top 14 features after LEfSe and LDA selection were chosen for the classification task. We employed six different supervised classification algorithms viz. LR, NB, RF, XGBoost, KNN, and DNN to evaluate their performance. As detailed in Table 1, the performance matrix of these classifiers was evaluated using metrics such as accuracy, precision, recall, specificity, sensitivity, and AUROC (detailed description of model parameters are provided in Supplementary material Note 1). A stacked bar graph representing the performance metrics of all models has been included, as shown in Supplementary Fig. S4. Among these, XGBoost demonstrated the most balanced and reliable performance, with an accuracy of 76.25% and an AUROC of 0.81, making it the most robust model for distinguishing between the two subtypes. Its superior performance can be attributed to its ensemble-based architecture, which leverages gradient boosting to minimize prediction errors and enhance model robustness iteratively.
The variations observed across the classifiers’ performance metrics can be attributed to their distinct assumptions and underlying architectures. For instance, NB, despite achieving the highest specificity (97%), showed lower sensitivity (61%) and accuracy (60%), limiting its reliability in detecting AC patients. This discrepancy can be attributed to NB’s assumption of feature independence, which hinders its ability to capture complex feature interactions, leading to poor sensitivity. Conversely, RF exhibited moderate accuracy (74%), and an AUROC of 0.80, but its overfitting compromised its performance, mainly when applied to smaller datasets. This overfitting reduces the model’s generalizability, limiting its efficacy on unseen data. KNN, which recorded the lowest accuracy (60%) and AUROC (0.60), struggled due to its sensitivity to feature scaling and the curse of dimensionality, impeding its ability to generalize in high-dimensional spaces. DNN achieved a high AUROC of 0.82 but exhibited poor specificity (54%), likely due to its need for larger datasets to prevent overfitting. Finally, LR, constrained by its linear assumptions, achieved moderate accuracy (72%) and AUROC (0.79) but struggled to model the complex, non-linear relationships inherent in the data, resulting in suboptimal performance.
A comprehensive evaluation of classifier performance requires the consideration of key metrics such as accuracy, precision, recall, F1 score, and AUROC, all of which are critical for assessing a model’s clinical utility. In this regard, XGBoost excelled across all these metrics, demonstrating the highest accuracy (76.25%), precision (77%), and recall (76%), making it particularly well-suited for clinical applications where both true positive identification and avoiding false positives are essential. The F1 score of 0.76 further underscores its balanced performance, especially in the context of imbalanced datasets. In contrast, while NB exhibited high specificity (97%), its lower sensitivity (61%) limited its ability to accurately detect AC cases, making it more suitable for contexts where SCC detection is prioritized but at the risk of underdiagnosing AC. RF and DNN, despite performing well in certain metrics, faced challenges as RF suffered from overfitting on small datasets. At the same time, DNN, despite a high AUROC (0.82), exhibited poor specificity, limiting its clinical applicability.
The clinical utility of these classifiers depends on the balance between sensitivity and specificity, as these directly influence the reliability of subtype classification for AC and SCC. XGBoost demonstrated the best balance, with the highest sensitivity (76%) and specificity (69%), indicating its robustness in identifying true positive cases while maintaining reasonable accuracy in identifying negative cases. This makes XGBoost a practical choice for clinical applications, where minimizing misclassification of both subtypes is critical. The high AUROC of 0.81 further supports XGBoost’s reliability in distinguishing between AC and SCC, suggesting its suitability for the diagnostic or prognosis of NSCLC patients. However, in clinical scenarios where SCC detection is paramount, classifiers like NB, which achieved the highest specificity (97%), maybe more appropriate, despite its lower sensitivity (61%), which could lead to underdiagnosis of AC. Similarly, DNN, with its high AUROC (0.82), faced challenges with poor specificity (54%), limiting its clinical utility in settings where balanced performance across subtypes is required. While XGBoost emerged as the most reliable classifier overall, we further validated its performance using an external dataset to strengthen its robustness and ensure its reliability across different datasets of similar ancestry.
Performance assessment on the independent dataset for validation
We also evaluated the performance of our classifiers in discriminating the AC and SCC subtypes using the identified bacterial biomarkers on an independent dataset (PRJNA327258). It was found that XGBoost showed the highest accuracy of 64.4% as compared to other classifiers, as demonstrated by the confusion matrix in Supplementary Fig. S6. In addition, XGBoost has achieved the highest AUROC of 0.71 with 58% specificity and 65% sensitivity, as given in Supplementary Fig. S7. The performance metrics, including sensitivity, specificity, and F1 score, reflect the classifier’s balanced capability to discriminate between AC and SCC subtypes, reinforcing the robustness of microbiome-based biomarkers for subtype classification.
The successful validation of the XGBoost model on the independent dataset PRJNA327258, which shares similar patient demographics and metadata with the training dataset, highlights the model’s robustness and generalizability. This validation addresses concerns about overfitting and confirms that the model’s performance extends beyond the original dataset. Both datasets, derived from the Lombardy region of Italy and representing European ancestry, minimize genetic and environmental variability, ensuring consistency between the datasets. Furthermore, using resected tumor samples in both datasets enhances the reliability of the comparison.
This validation demonstrates the model’s capability to accurately classify NSCLC subtypes in independent datasets, supporting its reliability for analyzing similar populations and sample types. Moreover, using independent yet comparable data highlights the potential for adapting this approach to broader populations and diverse sample types, supporting its generalization across different settings.
Functional enrichment analysis of key bacterial biomarkers
Analysis of metabolic pathway
The analysis of bacterial communities using PICRUSt2 has elucidated differential functional profiles that may influence the progression of NSCLC, particularly in AC and SCC. The predicted KEGG-KO analysis, visualized through the ggpicrust2 package, reveals significant differences between these two subtypes, as depicted in Fig. 3G. Notably, bacterial biomarkers associated with various pathway classes, including genetic information processing and metabolism, have been identified, with specific pathways such as carbohydrate, energy, and amino acid metabolism exhibiting more significant enrichment in adenocarcinoma. In AC, arginine and proline metabolism pathways may enhance nitric oxide synthesis, fostering a tumor-supportive microenvironment conducive to angiogenesis and immune evasion36. Furthermore, pyruvate metabolism and glycolysis are implicated in the Warburg effect, facilitating rapid ATP production and supplying biosynthetic precursors essential for tumor progression37,38. Additionally, carbon fixation pathways contribute by providing vital biomolecules under nutrient-limited conditions. Conversely, in SCC, secondary metabolite biosynthesis and xenobiotic degradation pathways appear to play a pivotal role in tumor adaptation. These pathways enhance resistance to oxidative stress while facilitating the degradation of therapeutic agents, thus conferring drug resistance. Recent research underscores the significance of secondary metabolite biosynthesis in NSCLC progression, as it enables tumor cells to adapt to adverse conditions and diminishes the efficacy of anticancer treatments39,40. Moreover, genetic information processing pathways—including transcription, protein folding, and degradation, are critical for tumor viability. These pathways help meet the biosynthetic demands of rapidly proliferating cancer cells while managing cellular stress. The interplay of these pathways suggests that specific metabolic functions within the lung microbiome can significantly influence NSCLC progression and treatment responses41. This understanding highlights potential therapeutic targets aimed at disrupting these tumor-supporting mechanisms.
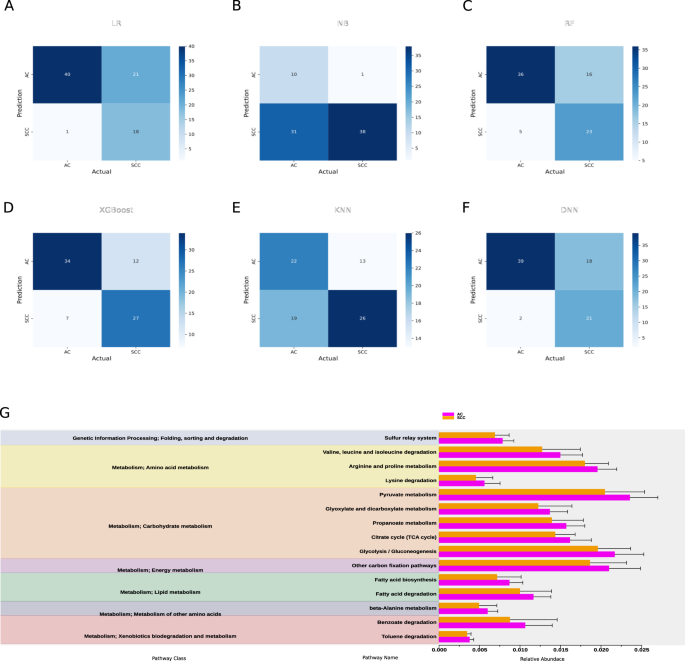
Evaluation of taxonomic features classification performance using confusion matrix in A Logistic regression (LR); B Naïve Bayes classifier (NB); C Random forest (RF); D Extreme boost (XGBoost); E K nearest neighbor (KNN); F Deep neural network (DNN); G Downstream pathway enrichment analysis of the identified taxonomic features using PICRUSt2. The columns in red and blue represent the AC and SCC groups, respectively.
Comparison with previous findings
The involvement of the identified bacterial taxa with NSCLC progression and development has been supported by several studies. For instance, members of the phylum Proteobacteria, including Alphaproteobacteria42, Herbaspirillum43, and Enterobacterales44, have been reported to influence NSCLC progression by modulating immune responses, promoting inflammation, and altering the tumor microenvironment. These bacteria may contribute to the inflammatory processes crucial in tumor development and progression. The genus Thermus from the order Thermales might contribute to cancer development in AC through mechanisms such as amino acid metabolism and reduced signal transduction, both are vital for tumor growth45. Additionally, bacteria from the Corynebacterium genus, belonging to the Corynebacteriaceae family, are implicated in chronic inflammation and immune evasion, further supporting NSCLC progression44. Kocuria palustris from the order Micrococcales might also play a role in local immune modulation and chronic inflammation, processes that are critical in fostering tumor growth44. Finally, the presence of Patescibacteria could indicate disruptions in metabolic pathways relevant to cancer biology, potentially aiding in cancer cell survival and proliferation46. These bacteria may significantly impact NSCLC pathogenesis through diverse mechanisms, contributing to tumor development and progression.
Discussion
The intricate relationship between humans and microbes spans millennia, shaping the very fabric of our existence. As we delve into the depths of this symbiotic relationship, we uncover a world teeming with microbial life—a vast ecosystem known as the human microbiome47. Comprising a diverse array of microorganisms, including bacteria, yeasts, archaea, fungi, protozoa, and viruses, the microbiome orchestrates essential functions within our bodies, from immune system regulation to digestion and disease prevention48. At the heart of this microbial symphony lies the respiratory tract, a complex landscape inhabited by its distinct microbiota. From the upper reaches of the nasal cavity and nasopharynx to the depths of the lungs, each region harbors a unique community of microorganisms intricately woven into the fabric of respiratory health42,49. In the upper respiratory tract, bacteria such as Moraxella, Staphylococcus, Corynebacterium, Haemophilus, and Streptococcus reign supreme, forming a protective barrier against invading pathogens50. Meanwhile, the lower respiratory tract maintains a lower microbial biomass, essential for the delicate balance of gas exchange and mucosal immunology51.
Recent advancements unveiled the pivotal role of the lung microbiome in the early detection and screening of non-small cell lung cancer (NSCLC)38,39,40. Armed with state-of-the-art machine learning algorithms and 16S rRNA gene sequencing technology, researchers embarked on a groundbreaking journey to decipher the intricate relationship between the lung microbiome and NSCLC subtypes52,53. By analyzing resected lung tissue samples—a less susceptible source of contamination compared to other sampling methods—scientists sought to unravel the unique microbial signatures associated with adenocarcinoma (AC) and squamous cell carcinoma (SCC) subtypes54. In this work, we attempted to distinguish two major NSCLC subtypes using ML-based classification algorithms and 16S rRNA gene sequencing data obtained from resected lung tissue samples of 263 patients of European ancestry. To our knowledge, this is the first study to classify NSCLC subtypes using lung microbiome data from resected lung tissue samples.
Our findings showed significant differences in microbial composition between AC and SCC subtypes, with distinct taxa prevailing in each. Interestingly, there was a substantial difference in the relative abundance of Firmicutes, Bacteroidota, and Deinococcota in AC and SCC. At the genus level, Thermus was found to be dominant in AC, while Pseudomonas was dominant in SCC patients. The trend of differentiation was observed in the overall structure of the microbial communities between the two subtypes based on α diversity. This suggested a significant difference in the richness and diversity of microbiota in the lung tissue samples of the AC and SCC patients. This observed heterogeneity in AC and SCC might be due to differences in the smoking status, age, sex, and environment (malignant or not) of patients52,55. In line with a previous study33, we also observed no difference in the β diversity between AC and SCC.
Further, through the meticulous application of advanced analytical techniques such as Linear Discriminant Analysis Effect Size (LEfSe) and Pearson correlation analysis, we identified taxonomic features that could serve as potential biomarkers for subtype classification. We found that the AC group was associated with a significantly higher amount of order Thermales, followed by the family Corynebacteriaceae and order Micrococcales. Conversely, the species Kocuria palustris, followed by phylum Patescibacteria in SCC, were differentially abundant. Pearson correlation was applied to remove the highly correlated features, and after selecting the top five features of each AC and SCC subtype, we found ten taxonomic features, including order Thermales, family Corynebacteriaceae, order Micrococcales, species Kocuria palustris, phylum Patescibacteria and five others which are used for classifying the AC, and SCC.
We then applied LDA, a supervised machine learning algorithm, to reduce the dimensionality of the dataset while also maximizing the inter-class distances and minimizing the intra-class distances between AC and SCC. Leveraging these findings, a classification approach using five supervised ML algorithms was built for subtype classification. We used metadata including age, sex, malignant status, and smoking history as features and ten other LDA-transformed differential bacterial genera to train our classification model with optimized hyperparameters using Bayesian optimization. Our benchmarking analysis showed the XGBoost algorithm to be the best performer with an accuracy of 76.25%, likely due to its ensemble-based approach, which is particularly effective at capturing the unique characteristics of AC and SCC. Our work revealed ten bacterial genera and four metadata features potentially able to classify AC and SCC.
Moreover, our analysis revealed differential metabolic pathways associated with AC and SCC, which shed light on the role of the lung microbiome in cancer progression and development. Noteworthy, pathways such as pyruvate metabolism, glycolysis, and carbon fixation pathways were predominant in the AC group. In contrast, the pathway related to amino acid and carbohydrate metabolism, like the TCA cycle, was predominant in the SCC group. Emerging evidence demonstrates that specific cancer cells, particularly those with deregulated oncogene and tumor suppressor expression, rely heavily on the TCA cycle for energy production and macromolecule synthesis56. Increased nucleotide metabolism, a critical pathway for DNA replication, RNA synthesis, and cellular bioenergetics, suggests uncontrolled growth of tumors and is a hallmark of NSCLC57. Further studies are required, focusing on the mechanism of these associated pathways for a better understanding of host-microbiome interactions in AC and SCC.
While these findings represent a significant understanding of the lung microbiome’s role in NSCLC subtypes, further exploration of microbiome-based biomarkers is needed to translate these findings into clinical practice. The identified lung microbiome, as a potential classifier for AC and SCC, holds promise for diagnostic applications. Since these microbiomes were derived from resected tumors, more representative of the actual lung microbial communities, their presence can typically only be detected in patients who have undergone biopsy. To address this limitation, we compared identified bacterial microbiomes from resected tumor samples across various minimally invasive or non-invasive sample sites, including sputum, saliva, and BALF. Our findings show that Proteobacteria was also detected in these sample sites, underscoring its potential as a diagnostic biomarker for AC35. Future longitudinal studies with larger sample sizes, conducted across diverse geographical regions, should aim to compare microbiome profiles from the upper respiratory tract (e.g., saliva and sputum) and lower respiratory tract (e.g., BALF, bronchial washing fluid, protected specimen brushing, lung tissue, and resected lung tumor tissue) within the same individuals. Additionally, these studies could implement our ML-based classification method to detect NSCLC subtypes by identifying common microbiome markers from minimally invasive or non-invasive samples. Such efforts would enhance the robustness and generalizability of our proposed approach. Integrating microbiome profiling in clinical diagnostics could revolutionize cancer detection by providing a non-invasive method for detecting early-stage cancers and assessing treatment responses. One promising avenue for integration is the development of microbiome-based diagnostic panels, which could be used alongside conventional diagnostic approaches such as bronchoscopy or biopsy. These panels would analyze microbial signatures in bodily fluids, such as sputum, saliva, or BALF, enabling clinicians to detect the presence of disease or track tumor progression non-invasively before morphological changes are visible on imaging.
In addition, future studies must address confounding factors that can significantly influence microbiome composition, including antibiotic use, medical conditions (e.g., COPD), and environmental or lifestyle factors such as smoking, diet, and occupational exposures. Recent findings suggest that antibiotic treatment before immunotherapy is associated with poorer outcomes in NSCLC patients, underscoring the significance of microbial influences on treatment efficacy58. This suggests that antibiotic use can alter microbiome diversity and complicate the interpretation of cancer-specific microbial changes. Comorbidities, such as COPD, environmental and lifestyle factors, smoking history, dietary habits, and occupational exposures, also significantly modulate microbiome composition, necessitating their inclusion as covariates in analyses26,59. Integrating confounder analysis in future studies will enhance the specificity and reliability of microbiome data, improving the clinical utility of microbial signatures for NSCLC diagnostics and prognostics.
ML methods offer significant potential for classifying NSCLC subtypes, and future studies should focus on advancing key areas to enhance their clinical applicability. One critical area is reducing bias in model training. This can be achieved by expanding sample sizes across diverse geographical regions and incorporating various sample types from the upper and lower respiratory tracts using non-invasive and minimally invasive methods. Additionally, ensuring adequate representation of patients across all age groups, geographical locations, and ethnicities will further enrich the training data, enhancing model robustness and generalizability. Such diversity will make the model more reliable and applicable to a wide range of clinical settings. Another key focus should be optimizing model generalization to address the challenge of overfitting, where models perform well on training data but struggle with unseen, real-world data. Future research should prioritize hyperparameter optimization to balance bias and variance. In our study, we employed a Bayesian algorithm, improving model robustness and performance across various datasets. By addressing these factors, future ML models for NSCLC subtype classification will be more reliable and applicable in clinical practice.
In conclusion, our study addresses key limitations of previous research, such as the reliance on non-invasive samples prone to contamination and the lack of ML integration for subtype classification. By analyzing resected lung tumor tissue and incorporating clinical metadata, we provide a more accurate representation of the lung microbiome. Our approach, leveraging optimized feature selection and fine-tuned ML models, identified novel microbial markers and achieved enhanced stratification of AC and SCC. These findings advance our understanding of subtype-specific microbial dynamics and highlight the potential avenues for further research into microbiome-based biomarkers for NSCLC.
Methods
The data analysis workflow of our study is illustrated in Fig. 4 and described in detail below. Figure 4A describes the overview of the study design, starting from data collection and its preprocessing, followed by feature selection and model building. Finally, evaluation of the model on certain parameters. All statistical analyses have been performed using R software (version 4.3.1) and Python (version 3.6.7), as applicable. All the data analysis codes are publicly available on the GitHub repository (URL: https://github.com/kashpk/Lung-microbiome-biomarker-analysis).
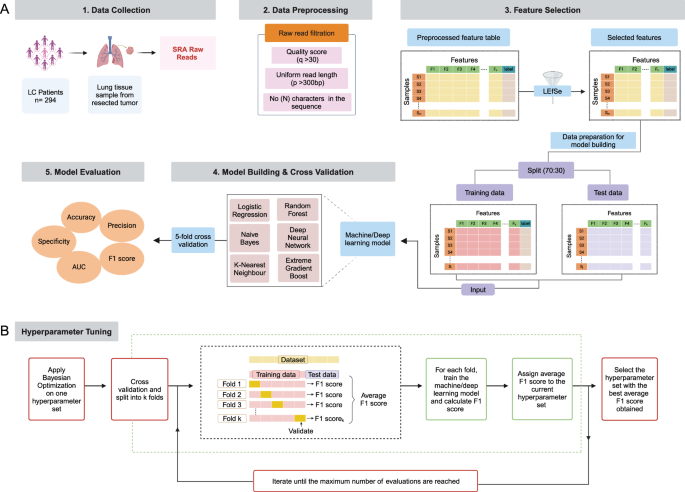
A Overview of the proposed methodology for ML-based lung microbiome data analysis, including steps like data collection, its preprocessing, feature selection, model building & cross-validation, and its evaluation; B Summary of hyperparameter tuning using the Bayesian optimization algorithm. (“Created with BioRender.com”).
Data collection
The raw 16S rRNA sequencing data on NSCLC patients was collected from the NCBI database using the sequence read archive (SRA) toolkit (version 2.9.1). The complete dataset is available at NCBI under the identifier PRJNA303190. This data was collected from patients of European ancestry (Italy) using Illumina high-throughput sequencing to target the V3-V4 region of the 16S rRNA gene. We used lung microbiome data collected from their resected lung tissue samples. This dataset includes 294 samples, with 159 AC and 135 SCC. Moreover, patient metadata, such as age, sex, smoking history, and environmental material (malignant or not), were considered for analysis. To clarify, non-malignant and tumor samples were segregated and treated as two distinct classes for stratification in our analysis. The patient’s NSCLC stage information was obtained directly from the original study’s authors via email45. Most patients were in the early stages (i.e., stages I to IIIA). We also used another independent dataset with the identifier PRJNA327258 to validate our findings. This dataset comprises 97 samples, with 43 AC and 50 SCC. This dataset was selected due to its similarity in characteristics to the training data, including patient demographics, geographic region (Lombardy, Italy), European ancestry, and metadata relevant to NSCLC subtypes classification. Both datasets include samples derived from resected tumors. PRJNA327258 study was unpublished and was separately available in SRA.
Data pre-processing and taxonomy profiling
The 16S rRNA gene sequencing data was processed using a standardized pipeline implemented in the QIIME2 tool60. Briefly, paired-end demultiplexed reads were joined using fastq-pair61 followed by primary and secondary level filtering as described by Bokulich et al. year62. At first, the reads with a Phred score < 30 were removed. Then, the remaining reads were checked for ambiguous base calls and adapters. In addition, reads were trimmed to a uniform length of 300 bp, with any reads shorter than 300 bp excluded from the analysis. 26 samples out of 294 were removed following the parameters mentioned above. Next, the Deblur approach was used to obtain error-free biological sequences referred to as amplicon sequence variants (ASV)63. The denoised ASV data from 268 samples (136 AC and 132 SCC) was obtained after quality filtering and denoising. The ASV data was further assessed to find their taxonomy lineage using a sklearn classifier pre-trained on the Silva database (version 138-99)64. The sequence reads originating from chloroplast or human mitochondrial DNA was excluded from further analysis. A total of 5 samples that did not have metadata information on smoking status were removed, resulting in 263 (136 AC and 127 SCC) samples for further analysis. Then, Richness diversity indices as a measure of α-diversity were computed to reflect the microbial diversity within a single sample. Similarly, β-diversity was assessed based on Bray-Curtis dissimilarity and visualized using principal coordinate analysis (PCoA) in R.
Feature selection
The LefSe65 method eliminated redundant features and selected features relevant to AC and SCC. This method uses the non-parametric Wilcoxon rank-sum and Kruskal–Wallis tests to find statistically significant differences between the AC and SCC groups. The selected features with an LDA score greater than 2.0 and p-value < 0.05 were substantial and of greater effect size. We selected features by eliminating features with a correlation coefficient >0.95. Only one feature from each correlated pair was retained for further consideration. This correlation occurred due to features selected from the LEfSe method showing similarities between belonging to the same classification level.
Data transformation using LDA
The data transformation was done to reduce the dimensionality of the above dataset resulting from feature selection to maximize inter-class distances and minimize intra-class distances. For this purpose, we divided this dataset comprising 263 samples (136 AC and 127 SCC) into training and test datasets with a 7:3 ratio. The dataset split is done to maintain the class ratio in both datasets. The train and test datasets comprised 183 and 80 samples, respectively. Next, we applied LDA to the training dataset and used the transformed train dataset matrix as an input to transform the test dataset.
Classification using machine and deep learning methods
We further implemented six ML/DL algorithms to determine the predictive potential of the features selected post-data transformation step for classifying NSCLC subtypes. Table 2 provides an overview of the six ML/DL algorithms used in our analysis. These classification algorithms were used from publicly available Python libraries and are briefly described below.
ML and DL algorithms and hyperparameters tuning
We used a Bayesian optimization-based algorithm for hyperparameter tuning66. It is an optimization algorithm that utilizes a Gaussian process and tries to minimize the loss concerning the hyperparameters. It is computationally more efficient and gives global optima, while other optimization algorithms like random search67 and grid search68 tend to get stuck at local minima. All the ML and DL algorithms were optimized using Bayesian optimization to balance model complexity and generalization, thereby reducing the risk of overfitting. For each hyperparameter configuration proposed by the Bayesian optimization process, we performed 5-fold cross-validation on the training dataset, and the model was evaluated on a test subset to compute the F1 score. The average F1 score across all folds was calculated and assigned to the respective hyperparameter configuration as its performance metric. This iterative process was repeated for a predefined maximum number of evaluations, allowing Bayesian optimization to efficiently explore the hyperparameter space and identify configurations that maximized the average F1 score. Finally, the hyperparameter configuration with the highest average F1 score was selected as the optimal setup for model training. This is illustrated in Fig. 4B. Subsequently, the ML and DL algorithms were trained with the optimized hyperparameters using training data and evaluated using test data.
-
(i)
Logistic regression (LR): LR is a standard classification algorithm69 that models the relationship between features and labels using a sigmoid function in such a way that the loss is minimized. For classifying AC and SCC, LR was trained using the top selected features, with L2 regularization (λ) applied to prevent overfitting and improve model generalization. The algorithm outputs probabilities for each subtype, which are converted into discrete labels based on a default threshold.
-
(ii)
Naïve Bayes classifier (NB): NB algorithm is a probabilistic and generative classification technique based on Bayes theorem. It assumes that the features are conditionally independent given the class label (AC and SCC) and computes class-conditional probabilities by estimating the likelihood of each feature. In our study, the possibility is approximated using Gaussian distributions, where each feature’s mean and standard deviation within each class were utilized to estimate the probabilities. NB does not require adjustable hyperparameters, making it a simple yet effective model for classification tasks with an assumption of feature independence70,71.
-
(iii)
Random forest classifier (RF): For binary classification of our subtypes, we applied an RF classifier, an ensemble learning algorithm72. Here, the RF classifier assessed the input features corresponding to the AC and SCC subtypes, constructing decision boundaries that best separate the two classes based on the features. Each tree independently evaluated the features, and their predictions were aggregated to determine the most likely class for each test sample. The model’s final decision reflected the majority vote from the ensemble of decision trees, effectively combining the predictive power of multiple models to improve accuracy and reduce overfitting. In this study, we optimized key hyperparameters of the RF model using Optuna for hyperparameter tuning. These parameters included the number of trees (N_estimators), the maximum depth of each tree (Max_depth), the maximum number of leaf nodes (Max_leaf_nodes), the minimum number of samples required to split a node (Min_samples_split), and the minimum number of samples needed to be at a leaf node (Min_sample_leaf). The hyperparameters were tuned using Stratified K-Fold cross-validation to ensure robust evaluation.
-
(iv)
Extreme gradient boost classifier (XGBoost): XGBoost is an example of ensemble learning based on a gradient boosting framework. However, unlike the RF algorithm, where multiple decision trees are built independently, XGBoost builds trees sequentially. Each new decision tree is trained on a modified dataset, which is the original training dataset but altered in such a way that the samples misclassified by the previous decision tree are given more weight. This strategy allows the model to focus on hard-to-classify instances, improving the accuracy of the ensemble through iterative refinement73. In our study, to perform AC and SCC classification, we optimized key hyperparameters, specifically, the maximum depth of each tree (Max_depth), which controls the complexity of individual trees within the ensemble. During training, the XGB model sequentially adjusted its decision boundaries to minimize the misclassification error, with each subsequent tree refining the decision boundaries of the previous ones. The final classification decision for each test sample was derived from the aggregated predictions of all the trees in the ensemble.
-
(v)
K-nearest neighbor (KNN): This is a non-parametric distance-based ML algorithm74, where a sample is assigned to the class that is most common among its nearest neighbors. During training, the KNN algorithm assigned each test sample to the class of its closest neighbors based on the Euclidean distance, effectively distinguishing between the NSCLC subtypes. The model was trained by tuning key hyperparameters, including the number of neighbors (N_neighbors), the weighting scheme for neighbors (weights), and the distance metric parameter (p). The weights parameter allowed for different voting strategies, either uniform or distance-based, where closer neighbors were given more influence in the classification decision.
-
(vi)
Deep neural network (DNN): DNNs are a neural network with more than one hidden layer. It has wide applications in various fields like computer vision, Natural language processing, etc. However, there is very little research on the application of DNN in biomarker analysis. In our study, we employed DNNs, which consist of multiple hidden layers due to their ability to capture complex, non-linear relationships in the data. These are essential for accurately predicting NSCLC classification. The performance of the DNN model was influenced by its architecture, including the number of hidden layers and the number of neurons within each layer. The hyperparameters were optimized, including the L2 regularization term (α), to prevent overfitting the learning rate (lr), batch size, and dropout probability (pdrop)75. During training, the DNN adjusted its weights through backpropagation to minimize the loss function while incorporating early stopping to avoid overfitting. The model’s final classification decision was based on the outputs of its learned layers, which effectively differentiated between the AC and SCC. The stratified K-fold cross-validation was used to evaluate the model’s performance, ensuring a balanced representation of both subtypes in each fold.
To address the “black box” nature of the DNN model, we employed SHAP (Shapley Additive Explanations) to gain interpretability and transparency in the decision-making process. SHAP provides a robust method for explaining ML models by attributing each prediction to the contribution of individual features. This approach helped us to deconstruct the model’s output and understand which features were most influential in classifying the NSCLC subtypes. Using the KernelExplainer to compute SHAP values, we examined the impact of the top 10 selected microbial features on the model’s predictions. The SHAP summary plot was generated to visualize the distribution of these contributions, thereby addressing the complexity and opacity inherent in DNN. The results, highlighting the relative importance of these features, are provided in the Supplementary Material (Supplementary Fig. S3).
Model evaluation and comparison
The model’s prediction performance in classifying two groups (AC vs. SCC) based on our selected features was computed through evaluation metrics. The evaluation metrics such as recall, precision, F1 score, accuracy, and finally, the area under the receiver operating characteristics (AUROC) are used and explained below.
True Positive: TP represents that while finding the type of NSCLC if the actual value is AC/SCC and the predicted value is also AC/SCC. Then, TP is equal to 1.
False Positive: If the actual value is AC/SCC, but the predicted value contradicts. Then, FP is equal to 0.
True Negative: If the actual is not AC/SCC, but the predicted value is also not AC/SCC. Then, TN is equal to 1.
False Negative: If the actual value is not AC/SCC, but the predicted value is AC/SCC. Then, FN is equal to 0.
The evaluation metrics are calculated using the above values:
Accuracy: It is the most common segmentation and classification metric, defined by the ratio of correct predictions to the total number of predictions, as shown in Eq. (1),
Precision: It is the ratio of correctly categorized positive samples to total positive samples (either correctly or incorrectly). It is shown in Eq. (2),
Sensitivity/Recall: It is the ratio of correctly classified positive samples as positive to the number of positive samples. It measures the ability of the model to detect positive samples. It is called recall, shown in Eq. (3),
F1 score: It is the weighted harmonic mean of precision and recall. The best score is 1, and its value is a single number between 0 and 1, derived as shown in Eq. (4),
Specificity: It is the ratio of correctly classified negative samples as negative to the total number of actual negative samples. It measures the ability of the model to correctly identify non-positive (negative) samples, minimizing false positives. It is shown in Eq. (5),
The AUROC (area under the receiver operating characteristic) curve was used to graphically illustrate the relationship between a model’s ability to correctly identify positive cases (sensitivity) and its ability to correctly identify negative cases (specificity).
Pathway analysis
To investigate the functional composition and potential association of specific taxa with NSCLC subtypes, we used a popular Phylogenetic Investigation of Communities by Reconstruction of Unobserved States2 (PICRUSt2)76 tool. The ASV abundance table was used as input to give the metagenome functionality. Then, the predicted metagenome functions were mapped to the Kyoto Encyclopedia of Genes and Genomes (KEGG) Ortholog (KO)77 to find the pathways. The differentially enriched pathways were analyzed descriptively using ggpicrust2 in R software. This was done to map the predicted functional profiles to KEGG pathways and identify enriched or depleted pathways in samples associated with AC or SCC.
Responses