Climate change alters the Indian Ocean Dipole and weakens its North Atlantic teleconnection
Introduction
The winter North Atlantic Oscillation (NAO) is the dominant mode of variability in the North Atlantic/European (NAE) region1. In recent years, seasonal and decadal forecast systems have shown significant skill in forecasting the surface NAO2,3, with clear societal benefits4,5,6,7. Much of the forecast skill comes from the dynamical response to tropical rainfall anomalies, which drives Rossby waves that impact the extratropics8,9. The El Niño Southern Oscillation (ENSO) is the dominant driver of tropical rainfall variability, and thus teleconnections to the extratropics10, but another important tropical mode of variability is the Indian Ocean Dipole (IOD)11,12. The IOD comprises a pair of anticorrelated sea surface temperature (SST) regions in the western and eastern tropical Indian Ocean, with peak amplitude in September–November (SON)13. The IOD has been identified as a mode of variability internal to the Indian Ocean, but is also partially driven by ENSO14,15,16 with positive and negative IOD (pIOD/nIOD) events associated with El Niño and La Niña, respectively.
While the IOD has important impacts around the Indian Ocean basin (e.g.17,18,19,20), Indian Ocean variability also influences the Northern Annular Mode21 and the NAO22,23,24,25. In SON 2019, a strong pIOD occurred while ENSO was neutral26,27, an unusual event where the IOD teleconnection was active without the confounding presence of an ENSO teleconnection. The event was associated with a positive NAO that was predicted in several seasonal forecast systems, with active tropospheric and stratospheric teleconnection pathways28. This suggests that the IOD is a potential source of predictability in ENSO-neutral years. In early winter, Indian Ocean rainfall modulates the impact of ENSO on the NAO29, with the IOD dominating ENSO in its impact on the North Atlantic region in recent decades30.
The IOD’s substantial impacts motivate analysis of future IOD changes. Climate change projections show weaker warming in the eastern Indian Ocean than the west, a weaker Indian Ocean Walker circulation, and a shallower thermocline in the eastern Indian Ocean31,32,33. These changes are associated with a mean state shift towards the positive IOD34. In Coupled Model Intercomparison Project data (CMIP5 and CMIP6), boreal summer IOD events are more common under climate change35, while the frequency of extreme IOD events is also projected to increase36,37. A different future perspective is that Indian Ocean mean state changes drive the emergence of a new ENSO-like mode, distinct from the IOD38. ENSO rainfall is projected to become more variable under climate change39,40 with a strengthened teleconnection to the NAO41,42,43. Given the links between the IOD and ENSO, it is important to take account of ENSO changes when considering the future remote impacts of the IOD.
Here, we use data from CMIP6 historical and future model simulations44 to examine changes in both the IOD itself and its teleconnection to the NAO. We are able to cleanly isolate the NAE region impact of the IOD from that of ENSO by focusing on years where the IOD is active but ENSO is neutral. Although such years are relatively unusual, there are sufficient ensemble members in the CMIP6 archive to generate robust results.
Results
Indian Ocean Dipole changes
We first examine the IOD-related rainfall in the models, and how it changes under the high radiative forcing SSP585 scenario45. To examine the impacts of climate change, we analyse the differences between two 50-year periods: 1851–1900 (HIST) and 2051–2100 (21C) (see ‘Methods’). In the models, the nodes of the dipole mode index (DMI) coincide with the two local maxima in interannual SON rainfall variability (Fig. 1a), suggesting that it is reasonable to use the DMI nodes (generally used to make an SST index) to define an IOD rainfall series. However, rainfall variability increases in the central tropical Indian Ocean in the 21C period, with the dipole no longer as distinct (Fig. 1b).
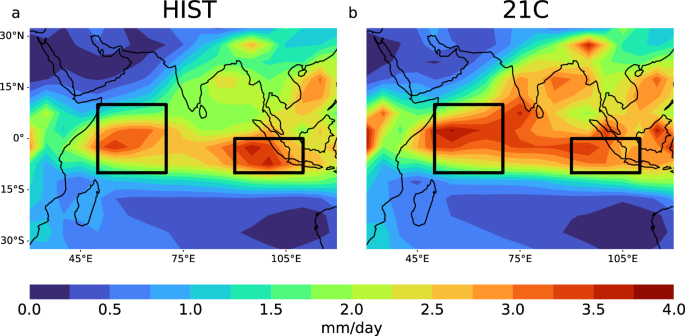
Panels a, b show HIST and 21C rainfall standard deviation fields based on ENSO-neutral years. Black boxes show the nodes of the DMI index.
We now consider the rainfall anticorrelation between the DMI nodes. The distribution of SON temporal correlation values over the ensemble members from all models is clearly different for HIST and 21C (Fig. 2), with 98% of the HIST values significantly negative but only 59% of the 21C values. (Using regression, we removed the ENSO-related rainfall component from both DMI nodes beforehand, but similar results are found without this step; Supplementary Fig. 1). In observations, rainfall in western and eastern DMI nodes is strongly anticorrelated (r = −0.78), close to the 10th percentile of the HIST distribution but outside the range of 21C values.

Blue/red bars show the distribution of correlation between rainfall in the west and east IOD nodes (with the ENSO component removed) for HIST/21C periods. The black line shows the observed value for 1979–2021.
The ensemble mean HIST correlation of −0.59 is significantly (p = 0.01) stronger than the 21C anticorrelation (−0.28), and much closer to the observed value. If we concatenate the ensemble member data from each model to calculate one correlation per model for each of the HIST and 21C periods, the magnitude of the correlation values diminishes in 43 out of 48 models, a highly significant result (p ≪ 0.01). This implies that the change in the ensemble mean is not merely due to a weakening in the few models with large ensembles. Across all ensemble members, the anticorrelation weakening is correlated with model biases in the mean IOD west minus east node rainfall, but only modestly (r = 0.31). Overall, the models project a substantial future change to the IOD.
Measured by the DMI-based rainfall with the ENSO component removed, IOD variability also weakens in future, despite a general increase in tropical Indian Ocean rainfall variability (Fig. 1). Comparing the standard deviation of the IOD rainfall time series for each member, the member-mean value is 18% lower in 21C compared to HIST. This weakening of the IOD variability is consistent with a single model study where IOD intensity (defined using the SST-based DMI) reduced as CO2 quadrupled46. The decreased IOD variability could, in part, be due to the weaker DMI node anticorrelation. However, rainfall variability also declines in the eastern IOD node in 21C, whether active ENSO years are filtered out or not, while variability in the central equatorial Indian Ocean increases in 21C. The spatial pattern of variability in 21C is, therefore, less dipolar than in HIST (Fig. 1).
To investigate these IOD changes, we make rainfall composites based on the difference between upper and lower quintiles of rainfall in the eastern IOD node in ENSO-neutral years (Fig. 3). The eastern node’s influence spreads much further west in 21C compared to HIST, and overlaps the western IOD node, helping to explain the weakened anticorrelation. This spatial pattern strongly resembles that found in an earlier study38 (their Fig. 4 based on August–October) with future mean state changes in the Indian Ocean argued to drive the emergence of a new ENSO-like mode of variability. We also see qualitatively very similar climate change responses in equatorial Indian Ocean SST38 (their Fig. 2), with stronger warming in the west than the east and increased SST variability in an equatorial tongue in the east. The IOD rainfall changes thus appear driven by the SST changes. Motivated by Fig. 3, we examine area mean rainfall for the expanded eastern node (65°E–110°E, 10°S–5°N, shown in red in Fig. 3). The models are mostly drier in this region in 21C compared to HIST (Fig. 4) consistent with greater warming in the western Indian Ocean than the east. For both HIST and 21C, models with lower expanded eastern node mean rainfall tend to have a weaker coupling between the rainfall in the DMI nodes. However, the inter-member correlation between the expanded eastern node mean rainfall and the strength of the DMI-node coupling is significantly stronger (p < 0.01) in 21C (r = −0.58; Fig. 4b) compared to HIST (r = −0.27; Fig. 4a). Consistent with previous work, we therefore find that Indian Ocean mean state changes are linked to IOD changes.

Rainfall difference between composites based on upper and lower quintile DMI rainfall years in the eastern DMI node, with neutral ENSO conditions. Panels a, b show HIST, 21C periods respectively; panel c shows 21C minus HIST difference. Black boxes show the DMI IOD nodes. Red boxes in panel b show new nodes chosen to fit IOD shift in 21C. Stippling shows significant differences at 5% level.

Panels show scatter plots of mean rainfall in the expanded IOD east node vs strength of correlation between IOD west and IOD east nodes for a HIST and b 21C.
From Fig. 3, it is plausible that the weakened anticorrelation of the DMI nodes could be explained by a spatial shift in the centres of action. To test this hypothesis, we define a western node based on the response pattern in Fig. 3b (40°E–60°E, 10°S–10°N; red boxes). With the ENSO component removed, the ensemble mean temporal correlation between the new nodes is −0.45 for 21C, significantly weaker (p = 0.01) than the anticorrelation of the DMI nodes in the HIST period (−0.59), but significantly stronger (p = 0.01) than that of the DMI nodes in 21C (−0.28). The weakened DMI rainfall anticorrelation in future is therefore partly, but not only, explained by the shift in the IOD nodes.
Another important aspect of IOD variability is its link to ENSO. As noted above, the IOD can be activated both by ENSO and by processes within the Indian Ocean. However, the emergent ENSO-like Indian Ocean mode38 is argued to be initiated via atmospheric circulation anomalies in the western Indian Ocean/Arabian Sea. By contrast, we find the anticorrelation between ENSO rainfall and the rainfall in the expanded eastern IOD node strengthens from −0.39 (HIST) to −0.59 (21C). By this measure, therefore, ENSO is projected to drive an increased fraction of Indian Ocean rainfall variability in future, consistent with projections of increased future ENSO rainfall variability39,40.
NAO teleconnection
Motivated by the teleconnection between the IOD and winter NAO seen in 2019/2020, we now examine links between the SON IOD and atmospheric circulation in the North Atlantic/European region. We focus on December—since the IOD amplitude peaks in boreal autumn, we expect the IOD’s influence on the winter NAO to be greatest in early winter. A simple way to assess the IOD teleconnection is to make composite difference fields for years where the IOD index is in its upper or lower quintile. For mean sea level pressure (MSLP) this results in a deepened Aleutian Low with a weak positive NAO in the HIST period (Supplementary Fig. 2).
However, ENSO likely confounds these results because it has teleconnections to both the IOD and the NAO. To avoid conflating the effects of the IOD with those of ENSO, we therefore select the years where ENSO rainfall is in the middle (neutral) quintile. For these ENSO-neutral years, we then compute composite differences between the years where the IOD index is in the top and bottom quintiles. This approach gives different composite fields to those produced with ENSO unrestricted.
In the HIST period, the northern hemisphere MSLP response to the IOD (with ENSO neutral) resembles the positive Arctic Oscillation with a significant band of low pressure at high latitudes (Fig. 5a); there is also a positive NAO in the Atlantic sector. The pIOD/nIOD favours the positive/negative NAO phase. In the meridional wind field (Fig. 5b), a Rossby wave train of alternating positive and negative nodes extends across the North Pacific into the North Atlantic/European sector, representing a tropospheric teleconnection pathway. This CMIP6 IOD-NAO teleconnection pattern strikingly resembles that seen in 2019/202028 (their Fig. 3), suggesting that the 2019/2020 pattern represents the standard response to the IOD and that such events could therefore recur in the present climate.

Panels show December pIOD minus nIOD composite difference fields under neutral ENSO conditions. Panels a, c, e show HIST, 21C, and 21C minus HIST difference fields for MSLP; panels b, d, f show corresponding plots for 250 hPa meridional wind. Stippling shows significance at the 5% level. Note the smaller contour interval for panels e and f.
Consistent with the 2019/2020 study28, we also find a stratospheric teleconnection pathway; the IOD affects the strength of the stratospheric polar vortex (SPV) in HIST, which in turn influences the NAO. For pIOD minus nIOD in ENSO-neutral years, the SPV and NAO significantly increase (p = 0.01) for both December (3.9 m/s; 2.1 hPa) and DJF (2.4 m/s; 1.8hPa). The IOD, therefore, appears to partly drive the NAO via the polar vortex, similar to the stratospheric teleconnection pathway driven by ENSO47. The DJF shifts for SPV and NAO are roughly double what would occur if the teleconnection were active in December alone, suggesting that the stratospheric pathway prolongs the teleconnection beyond early winter as the IOD decays.
We now analyse the relative importance of the stratospheric and tropospheric pathways. By linearly regressing the NAO on the SPV in all HIST years, we estimate the strength of the NAO response to a given shift in the SPV strength. We then estimate the size of the NAO response to the IOD via the stratospheric pathway by multiplying this NAO/SPV regression coefficient by the difference in the stratospheric polar vortex strength due to the IOD (i.e. pIOD-mean minus nIOD-mean SPV values). This estimate suggests the stratosphere-related NAO shift is around half of the total NAO shift (42%/40% for December/DJF). Since the stratospheric pathway explains around half of the total shift, the stratospheric and tropospheric pathways identified in the 2019/2020 study28 appear roughly equally important.
In the future 21C period the IOD-NAO teleconnection weakens, with the North Atlantic (and NAO) response no longer significant (Fig. 5c) while the weakening (the 21C minus HIST difference) is significant, projecting onto the negative NAO (Fig. 5e). The tropospheric pathway weakens, with reduced significance in the NAE region in 21C (Fig. 5b, d). The stratospheric pathway is also weaker. The SPV strength and NAO are similarly correlated in HIST (0.19/0.31 for December/DJF) and 21C (0.21/0.34 for December/DJF) if we consider all winters in the simulations. This final link of the stratospheric pathway, therefore, appears of similar strength in future. For the first link however, the SPV response to the IOD roughly halves in 21C (for neutral ENSO, the pIOD minus nIOD differences are 2.3 m/s (p = 0.01) for December and 1.0 m/s (p = 0.1) for DJF). The stratospheric pathway, therefore, weakens in future due to the reduced influence of the IOD on the stratospheric polar vortex.
The weakening teleconnection is robust to the choice of IOD nodes; a composite based on the shifted 21C IOD nodes also has a significantly weaker teleconnection for 21C (Supplementary Fig. 3). Similarly, if we restrict the definition of ENSO-neutral years to only the central 10% (rather than 20%) of ENSO rainfall values, we find the teleconnection still weakens, suggesting ENSO is not responsible. It has been suggested that increased static stability may weaken future tropical teleconnections to the extratropics48. However, Fig. 5b, d shows IOD-related wavetrains of similar strength in HIST/21C over Asia and the Pacific, suggesting this effect is not decisive here. Establishing the cause of the weakening teleconnection likely requires dedicated model experiments, but we identify two potential drivers.
First, the propagation of Rossby waves is limited to particular regions by the mid-latitude upper-tropospheric zonal wind field. The mid-latitude jet response to climate change remains uncertain, particularly in the northern hemisphere49. Jet changes may be driven by several mechanisms, including sea ice loss50, warming in the tropics51 and at the poles52, cloud properties53 and tropopause height changes54. Following previous work9, we calculate allowed regions of propagation (where l2 > 0 for the meridional wavenumber l) for stationary barotropic Rossby waves. In 21C, mid-latitude jet changes significantly reduce l2 over western North America, shifting the l2 = 0 boundary south here (Supplementary Fig. 4 shows results for zonal wavenumber k = 3; k = 4 is similar). Although modest, this shift is consistent with the southward-shifted IOD-forced wavetrain in the Atlantic sector in 21C.
Second, the tropospheric teleconnection wavetrain arcs across India, Japan and the North Pacific (Fig. 5b, d, f) with nodes shifted westward in 21C compared to HIST, consistent with the westward-shifted IOD nodes. The differences become more pronounced further along the wavetrain, which extends into the North Atlantic/European region in HIST but not 21C, consistent with a weaker tropospheric pathway.
To isolate this westward shift, we make a westward-shifted IOD rainfall index (WDMI) based on the red boxes in Fig. 3b). For the HIST period only, we use the WDMI to define subsets of the previously identified IOD events where the rainfall dipole is located to the west (IOD-West; larger absolute WDMI values) or east (IOD-East; smaller absolute WDMI values). Figure 6 shows the December pIOD minus nIOD responses corresponding to Fig. 5, but comparing IOD-East and IOD-West events rather than HIST and 21C. We find clear similarities between Figs. 5 and 6: IOD-East events (Fig. 6a, b) show a stronger NAO teleconnection and a significant Atlantic-sector wavetrain (as in Fig. 5a, b) while IOD-West events (Fig. 6c, d) have a weaker NAO teleconnection and a westward-shifted wavetrain that is further south over the Atlantic sector (as in Fig. 5c, d). These similarities suggest the westward-shifted IOD in 21C weakens the future IOD–NAO teleconnection.

Panels a, b show pIOD minus nIOD composite differences for MSLP and 250 hPa meridional wind based on eastward-shifted IOD events; panels c, d show corresponding differences for westward-shifted IOD events. Stippling shows significance at the 5% level.
Discussion
We have analysed the projected impact of climate change on the IOD and its teleconnection to the NAO. Our CMIP model study reproduces the IOD-NAO teleconnection found in a 2019/2020 case study based on seasonal and decadal forecast systems28, despite the latter models being initialised and generally having higher resolution. We find similar teleconnection pathways to the case study in the troposphere (via a Rossby wave train from the Indian to the North Atlantic basin via the North Pacific) and stratosphere (via changes in the winter polar vortex strength). This suggests that the 2019/2020 pattern is typical of the IOD–NAO teleconnection, and hence that a similar strong IOD event with neutral ENSO would see a similar response in the current climate. The similarity of the CMIP models’ IOD response to the 2019/20 winter reinforces the robust projection of a significant future weakening of the IOD–NAO teleconnection, with both tropospheric and stratospheric pathways weakening. Although we cannot be certain of the causes of the weakening teleconnection, it may be driven by projected changes to the IOD itself. In particular, the projected westward shift in the IOD nodes appears to shift the teleconnection’s Rossby wavetrain further west, impeding its progression into the Atlantic sector. Mid-latitude wind changes may also contribute by modifying the possible Rossby wave pathways.
We find the anticorrelation between DMI east- and west-node rainfall weakens in future. A large majority of the CMIP6 models show this effect, which is partly explained by the westward IOD node shift. Some authors interpret future changes in the IOD as an increase in extreme IODs36,37 whereas others argue that, despite a superficial resemblance to an extreme IOD, future variability actually represents a newly emergent ENSO-like mode38. Given the weaker DMI-node anticorrelation and the substantial changes in the size and location of the nodes, our results appear to support the latter interpretation. Unlike empirical orthogonal functions (EOFs) the DMI index has the advantage of being directly comparable across different models and periods, whereas IOD-related EOF patterns can differ widely37.
Our analysis uses climate models with tropical Indian Ocean biases55,56, and we only consider the most extreme radiative forcing scenario. While this means we cannot be confident about the size of the future changes in the IOD and its teleconnection, the models largely agree about the form of the future IOD changes. Although the NAO difference between pIOD and nIOD is quite small (1.8 hPa in DJF compared to an ensemble-mean NAO standard deviation of 7.5 hPa based on all years of the HIST period), the magnitude is likely reduced by the signal-to-noise problem57, which affects the Indian Ocean/NAO teleconnection in seasonal forecasts58.
By utilising the large CMIP6 dataset we examine years with active IOD but neutral ENSO, focusing on the IOD-NAO teleconnection without confounding ENSO effects. In contrast to the IOD, the effect of ENSO on the NAE region is projected to strengthen in future43. Furthermore, we find that ENSO’s influence on the Indian Ocean may increase in future. Nevertheless, our analysis shows that in the shorter term, large IOD events can occur independently of ENSO, with their own specific extratropical response. Given the IOD’s impact on the winter NAO in 2019/2020 and the potential for further large IOD events, it appears likely to remain a potential driver of the NAO in the near term. The contrasting projections of future IOD and ENSO teleconnections show that not all tropical teleconnections are likely to strengthen in future—rather, their evolution is likely to be diverse and interdependent.
Methods
Model data are taken from historical and SSP585 scenario simulations of 48 CMIP6 models (Supplementary Table 1). The simulations cover the period 1850–2100, with each SSP585 ensemble member (covering 2015–2100) continuing from the corresponding historical member (covering 1850–2014). Observed rainfall comes from the Global Precipitation Climatology Project (GPCP)59. We use rainfall rather than SST to analyse the IOD (following previous work36,39), since rainfall more directly relates to the Rossby wave forcing that drives teleconnections. We use the DMI index regions11—a western node (50°E–70°E, 10°S–10°N) and an eastern node (90°E–110°E, 10°S–0°N), with the IOD index defined as the September to November seasonal mean value. The NAO is defined as the difference in MSLP between the Azores (31.5°W–24.5°W, 36.5°N–40°N) and Iceland (25°W–13°W, 63°N–67°N). The SPV strength is defined as the zonal mean zonal wind at 60°N, 10 hPa. As noted above, we analyse differences due to climate change using the HIST (1851–1900) and 21C (2051–2100) 50-year periods. Using 50-year time slices is a trade-off: shorter periods give greater contrast in radiative forcing between 21C and HIST, but also introduce more noise. The IOD-related rainfall changes substantially from around the 2050s in some models (Supplementary Fig. 5) motivating this approach. All time series (except for IOD mean state rainfall) are detrended using a lowess filter60 since our focus is on interannual variability in the HIST and 21C periods. To produce composite fields, all fields are regridded to a common 5-degree by 5-degree grid before being combined (with conservative regridding used for rainfall and bilinear regridding for other fields). The significance of composite difference fields is tested using a Monte Carlo approach—composites are produced using randomly chosen fields, and the anomaly sizes at each gridpoint are compared with the value being tested.
All ensemble members are treated equally, with no weighting based on model performance. Previous authors31 have chosen to use only one member per model in CMIP analyses in order to avoid bias towards large model ensembles, while others discriminate based on model performance37,38,61. However, this means neglecting much of the available data—we analyse 305 ensemble members here, many more than would be available using the above approaches. Relationships over 50 years are uncertain, and internal variability can obscure teleconnections62. Using large ensembles can help address these issues63,64. Furthermore, the larger dataset enables greater discrimination between the IOD and ENSO, allowing us to more fully populate the joint distributions of each index.
To focus on the IOD independently of ENSO we use two complementary methods. Firstly, the large dataset allows us to find sufficient years with neutral (middle quintile) ENSO and active (outer quintile) IOD to produce statistically robust results. Alternatively, we remove the ENSO-related component in the IOD and NAO series (using quadratic regression) and analyse the residual series. This does not guarantee that ENSO effects are completely removed, but has the advantage of providing more data than the first method, allowing statistical analysis of each ensemble member.
We calculate meridional wavenumber fields for a stationary barotropic Rossby wavetrain, following previous work9. For such a wavetrain the meridional wavenumber is:
where β is the meridional gradient of the Coriolis parameter, (overline{u}) is the zonal mean zonal wind, and k is the zonal wavenumber. The zonal wind field (overline{u}) is represented by a running 60° zonal mean.
Responses