Climate change-driven ice variability and isotopic polarization in Antarctic coastal food webs

Introduction
Global warming of the oceans strongly impacts the stability of the polar coastal ecosystem by changing the timing, thickness and extent of seasonal land and sea ice formation1. Concurrent changes in the physical and biological environments, in conjunction with polar ice dynamics, impact the life history responses of associated marine organisms2, including predator-prey interactions3,4. Alterations in food availability, resulting from changes in the timing, biomass, and species composition of blooms as part of primary production5,6 under polar ice dynamics, affect coastal food webs and the resilience of their constituent species7. Through various processes, changes in ice cover are anticipated to modify the entire energy fluxes within polar ecosystems. Antarctic sea ice displays intricate regional dynamics influenced by both atmospheric and oceanic climate factors, in contrast to the pronounced decline observed sea ice extent in Arctic8. Over the course of the 2010s, there were notable changes in Antarctic sea ice extent, from its maximum in 2014 to minimum levels in 20178. The minimum records were subsequently surpassed in 2023 (https://zacklabe.com/antarctic-sea-ice-extent-concentration/). Among the six Antarctic regions (West: Bellingshausen, Amundsen, and Ross Sea; East: Western Pacific Ocean, Indian Ocean, and Eastern Weddell Sea), rapid warming has driven large-scale loss of the sea ice shelf and glacier retreat in West Antarctica9. The accelerated sea ice loss and glacier retreat have been observed on the West Antarctic Peninsula (WAP) in the Bellingshausen Sea, coinciding with the most rapid warming on Earth over the past few millennia10,11. In contrast, sea ice coverage has increased in East Antarctica, potentially influenced by shifts in atmospheric circulation patterns12. These divergent trends in sea ice extent between the West and East Antarctic coastal regions may have implications for ecosystem structure and functionality, including aspects such as food web dynamics, stability, and efficiency, adding a regional complexity1.
Previous studies have documented alterations in the structure and function of coastal ecosystems due to the intrusion of sediment-laden meltwater resulting from glacier and sea ice retreat in the WAP in response to climate change13,14. The implications of substantial changes to primary production on coastal ecosystem function have been reported under increasing sea ice cover in East Antarctica15. Despite the predominance of benthic species in the Antarctic, existing literature has predominantly focused on pelagic organisms, with limited information available on specific feeding groups of benthic species14,16,17. The impact of glacier retreat and climate warming on the structure and function of the coastal food web in the WAP is a growing concern; however, our understanding in the response of coastal food web dynamics in this region remains limited. It is imperative to elucidate the ecological consequences of long-term regional sea ice retreat and advances on both West and East Antarctic food webs to inform rational management and conservation strategies. Addressing the considerable uncertainty associated with predicting the effects of climate change on the Antarctic ecosystem necessitates a deeper understanding of how it will influence the nature of energy interactions among organisms18.
Here, we examined the dynamics of the food web over a few decades using carbon and nitrogen stable isotope analyses in an Antarctic coastal ecosystem exposed to the complex glacier and sea ice dynamics. We initially investigated the influence of substantial glacier retreat on food web dynamics in Marian Cove (MC) in the WAP, West Antarctica. In MC, our analysis encompassed: 1) the spatial distribution of stable isotope values among producers and consumers in the context of meltwater intrusion and glacier retreat; and 2) alterations in the spatial distribution and trophic role of a representative intertidal consumer, the Antarctic limpet, Nacella concinna, over a decade of glacier retreat. Subsequently, we scaled up the scope of our investigation to encompass the entirety of Antarctica and evaluated: 3) food web dynamics over multiple decades across both West and East Antarctica, which have been subjected to corresponding sea ice retreats and advances. This broader analysis aimed to provide comprehensive insights into how changes in sea ice extent are impacting the functioning of the entire coastal ecosystem of Antarctica based on the existing literature review.
Results and Discussion
Environment in Marian Cove, King George Island
Spatial variations in environmental conditions were examined between the inner and outer sites of MC. Salinity exhibited a notable disparity, with inner site B1 displaying significantly lower values (25.7±11.3) and a larger standard deviation compared to the outer sites (31.7±1.4) (t = 8.7, p <0.01) (Fig. 1). Dissolved oxygen (DO) and pH levels were notably elevated at the inner site (DO: 17.4±2.8 mg L−1; pH: 8.3±0.3) in contrast to the outer sites (DO: 13.6±1.2 mg L−1; pH: 8.0±0.1) (DO: t = −7.3, p<0.01; pH: t = −7.8, p<0.01) (Fig. 1). Moreover, subtidal phytoplankton biomass (Chl-a) was significantly higher in the inner site (0.004±0.005 μg−1) than the outer sites (0.002±0.001 μg−1) (F = 27.8, p<0.001) (Supplementary Fig. 1). The lower salinity (with a large standard deviation) and higher DO and pH in B1 indicated meltwater intrusion along with unique dynamics of fjord and glacier interactions near the glacier edge in MC19. The elevated phytoplankton production observed in B1 may be attributed to iron (Fe) input from glaciers, as suggested by previous studies20,21,22. Phytoplankton and ice algae have been identified as primary food sources for consumers along the Antarctic coast20,23. However, phytoplanktonic production in MC generally appeared lower compared to other Antarctic coastal areas24. Therefore, benthic microalgae and macroalgae likely serve as essential food sources for benthic organisms in MC25,26.

A Map of the study area showing the six intertidal sites (inner, B1; outer, W1 and B2–B5) and five subtidal sites (MC1–MC5), including three sites reported in a previous study described with white square27 with past glacier retreat records since 1956 in Marian Cove, King George Island, Antarctic Peninsula. Top-down images of five sites illustrate the approximate glacier influences as a function of distance (km) from the glacier. The distances are indicated on the images using bold italicized black text with a yellow background for clarity. B Variables (salinity, DO and pH) reflect contrasting environmental conditions between the inner and outer intertidal sites during the present study period (2018–2019). The black and blue lines and shading in the graph represent the mean and standard deviation values observed at the inner and outer sites, respectively. The base map was obtained from Google Earth (https://earth.google.com/web).
Food web structure in Marian Cove, King George Island
Four diets (particulate organic matters, POM; microphytobenthos, MPB; red-, and brown macroalgae) and eight consumers were collected in MC (Fig. 2A and Supplementary Table 1). ANOVA with the post hoc Tukey test revealed significant differences in the carbon and nitrogen stable isotope values among food sources (POM, MPB, and macroalgae) (δ13C: F = 22.0, p<0.001; δ15N: F = 25.4, p<0.001). Macroalgae exhibited significantly enriched δ13C values (−14.6±3.5‰) compared to MPB (−21.2±3.5‰) and POM (−21.8±3.1‰). In contrast, for δ15N, macroalgae displayed the distinctly lowest value (2.6±1.4‰) compared to MPB (6.6±1.2‰) and POM (6.0±2.4‰).
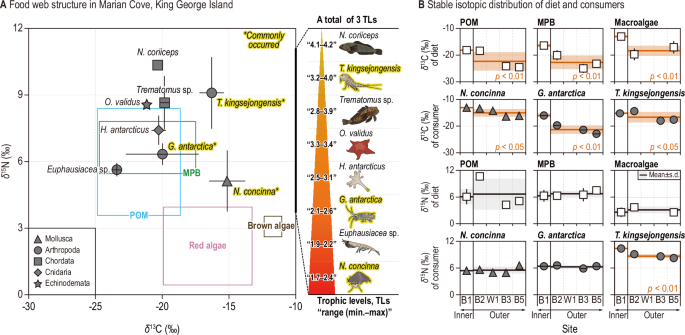
A Stable isotopic ranges of potential food sources (particulate organic matter, POM; microphytobenthos, MPB; red and brown macroalgae) are represented by empty blue, green, pink, and brown boxes. Consumers, presented as gray symbols indicate five taxonomic groups (triangle, Mollusca; circle, Arthropoda; square, Chordata; diamond, Cnidaria; star shape, Echinodermata) with total means and standard deviations. Consumers marked with an asterisk and highlighted in bold yellow present species collected from both the inner and outer sites in the MC. The trophic level ranges (min.–max.) for eight consumers (a total of 3 TLs: from 1.7 for N. concinna to 4.2 for N. coriiceps) are presented using red pyramid shape next to the biplot. B Spatial mean stable isotope values of three diets and consumers. Diets and consumers showing significant mean differences in stable isotope values between inner and outer sites are indicated with red means (line) and standard deviations (shade), along with the significant p-value.
The δ13C variability observed in marine primary producers was largely attributed to varying rates of CO2 uptake from the surrounding environment27,28. Consequently, the uptake of atmospheric CO2 likely contributed to the depleted δ13C values observed in phytoplankton and intertidal microalgae29,30. In contrast, the enriched δ13C values of macroalgae reflected 13C-enriched CO2 utilization in the seawater, and their active photosynthesis31. The variability in δ15N among primary producers suggested that they were influenced by different sources of inorganic nitrogen in their habitats9,32.
The Kruskal-Wallis test followed by Dunn’s post hoc comparisons identified significant variation in carbon and nitrogen stable isotope values across the eight consumer species examined (δ13C: H = 51.2, p<0.001; δ15N: H = 53.6, p<0.001) (Fig. 2A and Supplementary Table 1). The Antarctic limpet N. concinna, exhibiting the most enriched δ13C values (−14.6±1.5‰), was found to differ significantly from four other taxa. In contrast, Antarctic krill, with the most depleted δ13C values (−23.4±0.3‰), showed significant differences compared to two δ13C-enriched organisms, N. concinna and Tigriopus kingsejongensis. For δ15N, both N. concinna and Antarctic krill, with lower δ15N values (5.5±0.7‰ and 5.6±0.3‰, respectively), differed significantly from two fish species and the copepod T. kingsejongensis.
In addition, the highest and lowest δ15N values were recorded for the Antarctic cod Notothenia coriiceps (10.4±0.1‰), and the limpet (5.6±0.8‰), respectively. The progressive increase in δ15N among consumers, from grazer limpets to carnivorous fish, suggested the presence of approximately three trophic levels (TL) within the MC food web (Fig. 2A).
Antarctic krill take up various diets such as ice algae, phytoplankton (diatoms, flagellates), zooplankton (copepods), detritus, etc33. Previous study reported enriched δ13C values of krill fed on ice algae34. However, in the present study, krill (Euphausiacea sp.) the most depleted δ13C values, indicating that krill utilized more POM and phytoplankton in the MC14 (Fig. 2A and Supplementary Table 1). The two herbivores (limpets and krill) had contrasting δ13C values, indicating they utilize different baseline sources in benthic and pelagic systems. The depleted δ¹⁵N values and low TL observed in the omnivore Gondogeneia antarctica and the carnivore Haliclystus antarcticus suggest a reliance on primary producers or prey at a lower TL, indicating a shift in their dietary sources. This shift reflects their trophic plasticity, such as adjusting feeding behavior or trophic position, to adapt to the changing availability of food resources caused by glacier retreat7,15. The enriched mean δ¹⁵N value with a wider distribution in T. kingsejongensis reflects the detritivorous feeding strategy of the harpacticoids, genus Tigriopus35,36. However, for a better understanding, we suggest examining the feeding strategy of T. kingsejongensis in a future study.
Spatial stable isotopic distribution of producers and consumers in Marian Cove, King George Island
All diets exhibited significant 13C enrichment in B1 (POM: t = 7.1, p<0.001; microalgae: t = 9.1, p<0.001; macroalgae: t = 5.2, p<0.01) (Fig. 2B and Supplementary Table 1). This change in δ13C of diets (POM, microalgae, and macroalgae) at the inner site (B1) resulted in significant δ13C enrichment in three commonly occurring consumers (N. concinna: t = 2.7, p<0.05; G. antarctica: t = 11.3, p<0.001; T. kingsejongensis: t = 2.4, p<0.05) (Fig. 2B and Supplementary Table 1)37. The observed δ13C enrichment of producers and consumers at the inner site aligns with findings from the previous studies9,14.
The δ13C enrichment of producers might be attributed to increased utilization of HCO3- and the generation of organic materials within the confined environment beneath glaciers9. It was anticipated that this enriched δ13C values would propagate from producers to consumers along the TL in B138. Size-related adaptability to changes in the source and trophic fractionation of consumers might also influence spatial differences in stable carbon isotopes in MC (Fig. 3 and Supplementary Fig. 2). No spatial differences were detected in δ15N across all food sources. However, the copepod T. kingsejongensis exhibited significant spatial variations in δ15N (t = 8.9, p<0.01), suggesting its diverse functional roles within MC.
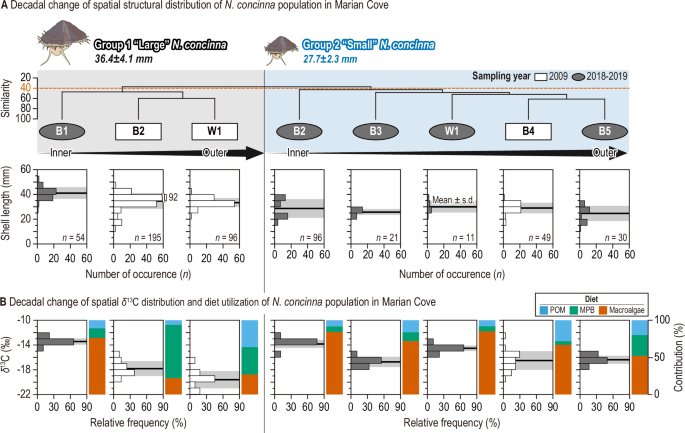
A Small and large limpet groups (Groups 1 and 2) identified by cluster analysis based on shell length (mm) at a (dis)similarity level of 40. White rectangles and gray ellipses indicate limpet samples collected in 200927 and 2018–2019, respectively. Limpet samples in each group are arranged by distance from the glacier, as indicated by black arrows (inner to outer sites). The black line with a gray shade represents the mean and standard deviation of the shell length distribution for each limpet sample. B The spatial distribution of the stable carbon isotope signature (δ¹³C, Y-axis on the left) of eight limpet samples, along with the contributions (%; Y-axis on the right) of three food sources, as indicated by colors (blue: particulate organic matter [POM]; green: microalgae; red: macroalgae).
Decadal changes in the structure and function of the Antarctic limpet in Marian Cove, King George Island
Cluster analysis was conducted to estimate decadal alterations in the spatial distribution of the limpet population in the MC. This analysis identified two primary groups (Group 1 and Group 2) among N. concinna samples based on shell length at a (dis)similarity level of 40 (Fig. 3A). Group 1 comprised large limpets (mean, 36.4±4.1 mm) predominantly found in B2 and W1 during 2009, and in B1 during 2018–2019. In contrast, Group 2 consisted of small limpets (mean, 27.7±2.3 mm) primarily collected from outer sites across both time periods (Fig. 3A). Larger limpets exhibited greater migration activity to recently established ice-free habitats compared to smaller limpets, indicating size-dependent adaptability and intraspecific competition for niche expansion in source-limited intertidal rocky shores39,40,41. Both groups of limpets exhibited significant δ13C enrichment over a narrower range in 2018–2019 compared to that estimated in 2009 (Group 1, t = −21.1, p<0.01; Group 2, t = 6.3, p<0.01) (Fig. 3B and Supplementary Table 2). Thus, limpets in 2018–2019 consumed a more 13C-enriched diet (including macroalgae) intensively compared to those collected in 2009. The decadal increase in the macroalgal contribution to limpets supports this finding (Fig. 3B).
Previous studies have documented the reliance of numerous benthic organisms inhabiting the coastal regions of King George Island on benthic microalgae and macroalgae in environments characterized by low phytoplankton biomass24,42. Our assessment indicates a substantial benthic contribution to limpets, particularly in settings with minimal subtidal pelagic production, corroborating earlier findings in the previous studies in the MC (Fig. 3B and Supplementary Fig. 1). The dietary changes over decades were more pronounced in the larger limpet group residing near the glacier edge compared to the smaller group inhabiting outer sites (Fig. 3B and Supplementary Table 2). The gradual increase in macroalgae dependence among large limpets at B1, approaching levels similar to those of small limpets in outer sites, reflects the simplified trophic functions in the coastal ecosystem of the MC. This diet shift of Antarctic limpets is attributed to a substantial rise in macroalgal biomass in the MC, driven by increased retreating glaciers and nutrient input to their habitats26,43,44. Given the pivotal role of macroalgae, with over 73% contribution to limpets in the late 2010s in MC (Fig. 3B), their potential decline in the future due to extreme temperatures exceeding their survival threshold could have direct or indirect implications for the function and stability of the MC food web structure45,46. In the context of a future climatic crisis, the potential loss of macroalgae due to extreme temperatures exceeding their critical survial thresholds could trigger a cascade of secondary extinctions through the MC food web, which is heavily reliant on macroalgae as its simplified basal resource. Rocky shore species have been identified as cost-effective sentinels responding to global climatic change in long-term previous studies47,48. In particular, space-occupying key organisms such as gastropod grazers are well known as useful study taxa for predictive modeling of ecological processes that generate spatial and temporal changes in abundance47. In this study, we propose that the carbon and nitrogen stable isotope values of limpets can serve as effective indicators of climatic changes in nearshore ecosystems.
Influence of multi-decadal changes to sea ice extent on spatial variations of stable isotopes among producers and consumers in Antarctica
Significantly negative and positive correlations between year and summer sea ice extent were obtained for West (Bellingshausen and Amundsen Sea: r = −0.42, p<0.05) and East (Western Pacific Ocean: r = 0.44, p<0.05) Antarctica, respectively (Fig. 4A). Variations in sea ice extent in Antarctica are driven by a combination of multiple atmospheric and oceanic factors8,49,50. In Antarctic coastal ecosystems, the dynamics of food web are inherently linked to the sea ice conditions, which affect the availability of primary food sources for consumers51. Therefore, we hypothesized that the divergent changes in sea ice extent between West and East Antarctica may influence food web dynamics in both regions through distinct processes.
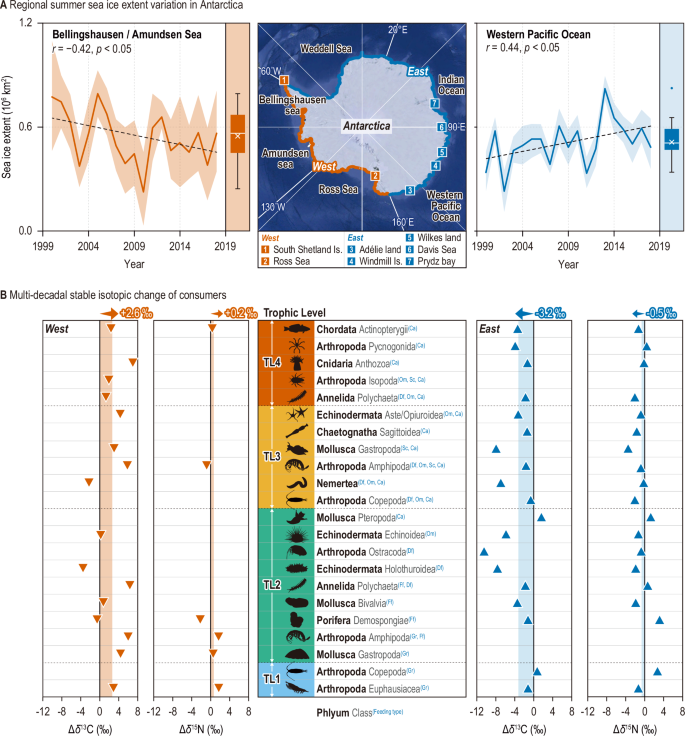
A Regional summer sea ice extent variation (2000–2018)8 in the Bellingshausen and Amundsen Seas (left) and the Western Pacific Ocean (right), along with locations where reference stable isotope data were collected sampling sites include the following regions in Antarctica: West – (1) South Shetland Islands and (2) Ross Sea; East – (3) Adélie Land, (4) Windmill Island, (5) Wilkes Land, (6) Davis Sea, and (7) Prydz Bay. B Multi-decadal changes in carbon and nitrogen stable isotopes (Δδ¹³C and Δδ¹⁵N) of classified taxonomic groups with five feeding strategies: Gr (grazer), Ff (filter feeder), Df (deposit feeder), Om (omnivore), Sc (scavenger), and Ca (carnivore). These changes are compared between the West (left, downward red triangle) and East (right, upward blue triangle), reflecting contrasting sea ice retreat and advance. Mean multi-decadal stable isotopic changes of consumers are represented with orange and blue backgrounds, with arrows indicating trends on the graph. Specific data from previous studies are provided in Supplementary Table 3, and all species included in the functional taxonomic groups in the graph are listed in Supplementary Table 4. The base map in Fig. 4A was obtained from the NASA Earth Observatory (https://earthobservatory.nasa.gov/world-of-change/sea-ice-antarctic/show-all).
Significant changes in δ13C were observed for marine organisms during the 2010s, a period marked by rapid changes in Antarctic ice extent (Fig. 4B and Supplementary Table 3). In West Antarctica, marine organisms displayed significant mean δ13C enrichment, reaching 2.6‰ in the 2010s (F = 6.7, p<0.05). In contrast, in East Antarctica, marine organisms exhibited a significant mean decrease in δ13C signatures, approximately 3.2‰ following conversion (F = 4.3, p<0.05). These divergent horizontal variations in δ13C of consumers suggested distinct dietary shifts in consumers exposed to different multi-decadal changes to sea ice extent in West and East Antarctica.
The shift in the mean contribution of producers (pelagic phytoplankton, sympagic ice algae, benthic micro- and macroalgae) to organisms in West and East Antarctica corresponded to the contrasting changes observed in consumer δ13C values (Fig. 5). In West Antarctica, where sea ice is retreating, the mean contribution of both sympagic and benthic producers to consumers increased by over 50% during the 2010s (Fig. 5A). However, the mean utilization of pelagic sources by consumers in West Antarctica decreased by 40%. Notably, all consumer groups exhibited greater reliance on benthic sources in the late 2010s. The heightened utilization of benthic sources by consumers closely reflected the substantial increase in benthic production, driven by increased light availability following the reduction in sea ice in West Antarctica52. A previous study reported an increase in phytoplankton contribution to coastal consumers in the marginal ice zone, attributed to heightened phytoplankton biomass in coastal areas experiencing sea ice loss1. However, our findings revealed a decrease in pelagic phytoplankton contribution to consumers along the West Antarctic coast, coinciding with marked declines in ice extent. This result indicated a comparatively modest rise in pelagic production relative to benthic production in West Antarctica, influencing reduced phytoplankton utilization by consumers during the 2010s. This trend may also be linked to the predominant sampling locations, primarily concentrated in the Bellingshausen-Amundsen Sea region, characterized by lower concentrations of phytoplanktonic biomass53.
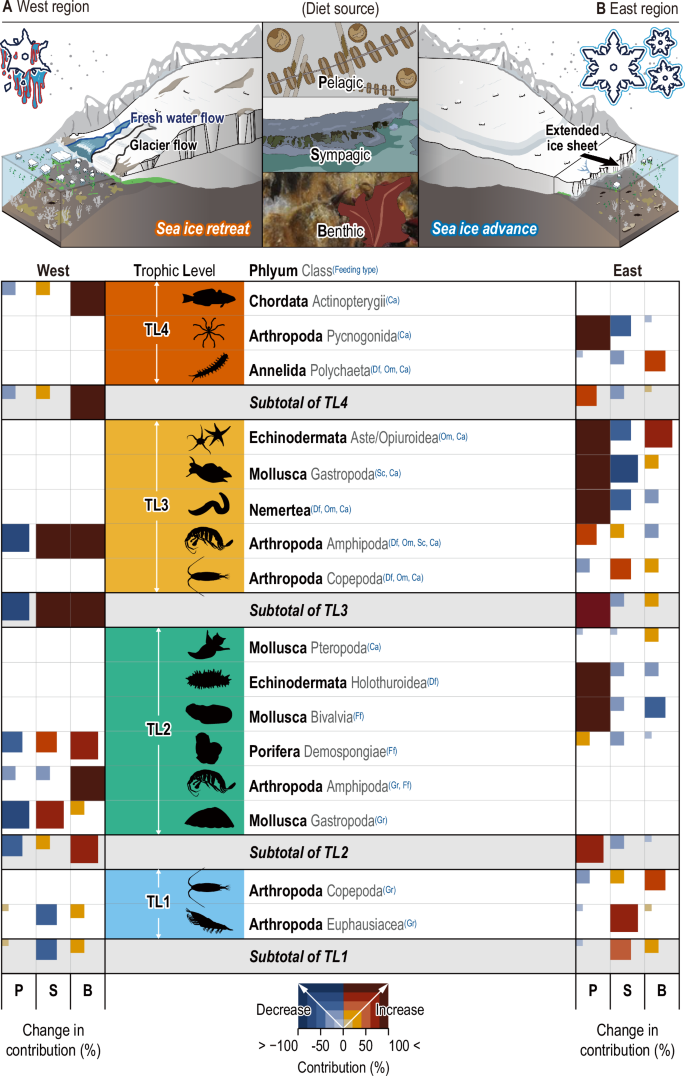
Multi-decadal changes in contribution (%) of three types of diets (P, pelagic; S, sympagic; B, benthic) to the consumers in (A) West Antarctica with substantial sea ice retreat (left) and (B) in East Antarctica with substantial sea ice advance (right). The feeding strategies of consumers are described with abbreviations (grazer, Gr; filter feeder, Ff; deposit feeder, Df; omnivore, Om; scavenger, Sc; carnivore, Ca) in blue superscript. Trophic levels are described with colors (TL1, blue; TL2, green; TL3, yellow-orange; TL4, deep orange). Squares with red and blue gradations indicate an increase and decrease in diet contribution (%) of three producers to consumers, from 0 to 100%, respectively.
During the 2010s, organisms in East Antarctica displayed a heightened reliance on pelagic phytoplankton, indicative of the relatively elevated production of phytoplankton under advancing sea ice conditions in the region (Fig. 5B)28. This outcome can be attributed to the scarcity of micro- and macrophytes on the seafloor, constrained by the limited light penetration beneath the sea ice throughout much of the year54. Long-term fluctuations in δ13C levels in coastal organisms may also be influenced by the divergent intrusion of atmospheric 13C-depleted signatures along the West and East Antarctic coasts, originating from fossil fuel combustion55. A previous study noted a decline in δ13C levels in globally distributed fish due to the incorporation of fossil fuel-derived isotopically light carbon into the marine ecosystem55. Therefore, we propose that the δ13C depletion observed in East Antarctic organisms could be additionally influenced by atmospheric depletion of δ13C due to reduced meltwater intrusion. However, this effect appeared to be negligible in West Antarctic marine organisms inhabiting environments subject to complex environmental influences from various factors (e.g., meltwater interference), substantially increasing primary production of benthic organisms (MPB and macroalgae) which have enriched 13C values. Further investigations are warranted to precisely elucidate the underlying mechanisms driving this phenomenon. Among the 22 taxonomic and functional groups examined, multi-functional consumers exhibited the greatest overall changes in Δδ13C along both the West and East Antarctic coasts (Fig. 4B).
The carnivorous gastropoda exhibited the highest total Δδ13C variation on both the West and East coasts, followed by the deposit-feeding ostracoda, which is exposed to various diets (e.g., dead and living microalgae, macroalgae, and organic detritus from various origins) in the benthic environment (Supplementary Table 3). The δ13C range of consumers reflected their capacity to adjust to variations in producer availability. Consequently, the substantial fluctuations in δ13C observed in multi-functional consumers suggest a high degree of trophic plasticity, an adaptive characteristic encountered in Antarctic environments undergoing considerable changes15. However, the relatively minor Δ δ13C observed in consumers primarily exhibiting a single feeding strategy reflects specific dietary preferences, potentially jeopardizing their persistence in the rapidly evolving Antarctic environment. Notably, there was no discernible change in the δ15N values of marine organisms in both regions (Fig. 4B), suggesting that alterations in sea ice extent have predominantly influenced the trophic niche rather than the trophic position of Antarctic coastal organisms.
Conclusions
In conclusion, the present study identified multi-decadal food web dynamics along the Antarctic coast experiencing complex regional glacier and sea ice dynamics using stable isotope analysis. We highlighted that the impact of altered baseline production and nutrient input under long-term changes in sea ice extent on δ13C dynamics of both producers and consumers along the Antarctic coast. The elevated δ13C signatures of producers and consumers reflected the influence of meltwater intrusion in response to glacier retreat in the WAP. Decadal shifts in the spatial distribution of Antarctic limpets reflected changes in their habitat extent, while their substantial increase in macroalgal consumption over decades reflected baseline alterations in WAP under glacier retreat. Thus, the present study first identified the Antarctic limpet as an effective sentinel of change in the Antarctic coastal ecosystem under the climate crisis. The contrasting multi-decadal changes in δ13C and the relative contributions of benthic, pelagic, and sympagic diets to consumers between West and East Antarctica correspond to regionally divergent changes in sea ice extent. Overall, these long-term changes to the food web, encompassing both structural and functional components, demonstrate that the trophic baseline in Antarctica has been substantially altered under the global climate crisis. Ultimately, these changes are expected to cause ecosystem stability to decline through the propagation of the (in)direct effect of trophic cascades in the Antarctic ecosystem.
Materials and Methods
Sample and data collection
From 2018 to 2019, sampling was conducted at five intertidal sites during the austral summer to estimate how glacier retreat affects the functional trophic dynamics of the MC, King George Island, WAP (Fig. 1). Three replicate measurements of phytoplankton biomass (Chl-a) were taken every 1 m from the surface to a depth of 30 m using a Sea-Point Chlorophyll Fluorometer (SCF) within an SBE19 Plus-V2 CTD at five subtidal sites (Supplementary Fig. 1). Intertidal seawater properties (temperature, salinity, DO, pH) were measured in situ during high tide using a multi-parameter water quality probe (YSI-Professional Plus, USA) (Supplementary Table 5). Samples of eight consumer species and their food sources (POM, MPB, macroalgae) were collected to analyze carbon and nitrogen stable isotope values. POM was collected during high tide at all sites. To remove zooplankton and large particles, approximately 50 L of seawater was pre-filtered through a 200 µm mesh net and then re-filtered using a pre-combusted (450 °C, 4 h) Whatman GF/F glass fiber filter with a 0.7 µm pore size. Epilithic microalgae were sampled from the rock surface using a toothbrush and then filtered using a Whatman GF/F glass fiber filter. Both POM and microalgal samples were collected in a Petri dish and then freeze-dried. Thalli of macroalgae (red, Iridaea cordata; brown, Adenocystis utricularis) reported as food sources for the Antarctic limpet N. concinna in MC were collected in tide pools27.
Copepods were manually sampled using a 200 µm net. Among them, the common occurring T. kingsejongensis was sorted using forceps under a binocular microscope. The amphipod G. antarctica, limpet N. concinna, and jellyfish H. antarcticus were collected randomly by hand during the ebb tide. Two fish species (N. coriiceps, Trematomus sp.) were sampled using a fish trap near B3. Other species, such as krill (Euphausia sp.) and starfish (Odontaster validus) were collected near the King Sejong base camp. Among the consumers, only three species—N. concinna, G. antarctica, and T. kingsejongensis—were commonly found at all sites and were used for spatial comparison in MC. In small organisms such as T. kingsejongensis and G. antarctica, we collected more than 200 and 30 individuals, respectively, to ensure sufficient biomass for stable isotope analysis (Supplementary Table 1).
To evacuate any undigested materials from inside the limpets’ gut, they were kept alive for 24 hours in filtered seawater without food in the laboratory. Gut depuration was not performed for fish, as only muscle tissues were used for stable isotope analysis. The shell length of limpets was measured using Vernier Calipers, with an accuracy of 0.01 mm. Limpets were dissected, freeze-dried, and homogenized with mortar and pestle. To assess decadal structural and functional changes in the MC food web, we compared the present data obtained (shell length distribution, δ13C value, and diet utilization) for the dominant consumer, the Antarctic limpet in MC, with previously collected data27. To reveal the food web structure in MC, muscle tissues from N. coriiceps and Trematomus sp., arm tissues from O. validus, and whole bodies from G. antarctica, T. kingsejongensis, and H. antarcticus were dissected for stable isotope analysis.
All sampling was conducted with approval from the Ministry of Foreign Affairs of Korea for the capture, collection, and export of native Antarctic animals for ecological research purposes (International Regulations and Laws-3146). Additionally, all procedures were carried out in accordance with best practices to minimize any potential impact on the organisms and their environment, following IACUC guidelines.
To understand trends in sea ice dynamics in Antarctica, we initially gathered annual data on summer sea ice extent from 2000 to 2018, utilizing previously documented information obtained through satellite-based multi-channel passive microwave technology (Fig. 4A and Supplementary Fig. 3)8. In addition, summer sea ice concentration (%) and the three-decadal median were obtained from the NASA earth observatory (Supplementary Fig. 3B).
To elucidate functional trophic dynamics under changing sea ice extent in Antarctica over multiple decades, we compiled the most comprehensive stable isotope data available for producers and consumers (representing 9 phyla, 18 class, 133 species) from 30 studies published in two distinct periods; the 1990s–2010s and the 2010s, corresponding to before and after the notable changes in Antarctic sea ice extent, respectively (Supplementary Table 3). Coastal organisms were restricted to habitats at approximately 200 m depth, corresponding to the depth of the continental shelf, to minimize potential environmental disturbances affecting stable isotope values. The corresponding feeding types of each consumer are presented in Supplementary Table 4.
Stable isotope analysis
We decalcified the fine powder of POM, microalgae and macroalgae for the examination of δ13C values. To extract lipids from consumer tissues, a solvent mixture of 10 ml dichloromethane/methanol (2:1, v/v) was employed. In addition, some consumer tissues underwent decalcification with 1 N HCl (Sigma Aldrich) to remove inorganic carbon, which can interfere with the δ13C signature56. Subsequently, decalcified and lipid-free samples were fully lyophilized. Such pre-treatment was not applied to samples for δ15N analysis. All samples were weighed and enclosed in tin containers. Isotope ratio mass spectrometry connected to an elemental analyzer (EA-IRMS) was utilized to determine the δ13C and δ15N of the samples. The resultant CO2 and N2 gases were introduced into the IRMS. Stable isotopic abundance was expressed in delta (δ) notation relative to the conventional standard (C, Vienna Peedee Belemnite; N, atmospheric N2), with the following formula:
Where X represents either 13C or 15N and R denotes the ratios, 13C/12C or 15N/14N. IAEA-CH-3 (cellulose) and IAEA-N-2 (ammonium sulfate) were utilized for the internal calibration of 13C and 15N. The measurement precision of replicated analyses for each sample was approximately 0.04‰ for δ13C and 0.2‰ for δ15N.
Trophic level
A trophic enrichment factor, TEF of δ15N, 2.3‰ was used to estimate the TL of Antarctic marine organisms57. The average δ15N of primary consumers (filter feeder and grazer) was considered as the baseline δ15N of the food web since their tissues assimilate primary producers and organic matter58. The TL of consumers was estimated utilizing a formula developed by Vander Zanden and Rasmussen (1999)59:
Where, TLi is the TL of each species considered, δ15Ni is the δ15N of species i, and δ15Nbase and TLbase are the mean δ15N and TL of primary consumers, respectively (TL = 2).
Statistical analysis
SPSS 26.0 was utilized to conduct a range of statistical analyses, including One-sample t-test, Independent two-sample t-test, One-way analysis of variance (ANOVA), Kruskal-Wallis test, and Correlation and Regression analyses (Supplementary Table 6). Cluster analysis was carried out using PRIMER 6. Shapiro-Wilk or Kolmogorov-Smirnov tests and Levene’s test were performed to check the normality and homogeneity of variance of the data, respectively, prior to performing all parametric and non-parametric tests. For examining the diet utilization of marine organisms in Antarctica, we employed the Bayesian stable isotope mixing model in the R (SIMMR) package60. Markov Chain Monte Carlo was set to 10,000 iterations. In order to compare the present trophic function of limpets, we adjusted the stable isotope ratios in SIMMR using TEF (δ13C, 0.8±1.0‰; δ15N, 2.2±1.0‰), derived from a previous study61, as referenced in Choy et al. (2011). As specific TEF values were not available, we applied commonly used δ13C (0.4±1.2‰) and δ15N (2.3±1.6‰) values from prior research on stable isotope signatures of Antarctic organisms57. To reveal baseline changes in Antarctica under varying sea ice extents, we estimated the contributions of pelagic, sympagic, and benthic sources to Antarctic consumers during two time periods (1990s–2000s vs. 2010s). A priori aggregation of benthic primary producers (microalgae and macroalgae) was performed to interpret the mixing model results logically.


Responses