CMAB: A Multi-Attribute Building Dataset of China

Background & Summary
Over the past two decades of urbanization, cities worldwide have experienced rapid expansion, with buildings serving as spatial cellular units and cities exhibiting increasingly complex changes in 3D morphology and social functions1,2,3,4. A thorough understanding of the fine-grained 3D physical and social structures of cities from building datasets has become crucial for urbanization processes, urban energy, urban ecosystems, and government decisions related to carbon emissions and reduction5,6,7. Building attributes can be broadly categorized into two types: geometric attributes, including building footprints, heights, structures, and orientations; and indicative attributes, covering functions, styles, ages, quality, and vacancy8,9,10,11. Geometric attributes are essential for analyzing urban physical structures and planning city spaces, while indicative attributes are key to understanding the performance and longevity of structures12,13.
Recent advancements in satellite sensing14,15,16, computer vision and multimodal technologies17,18, and computational power19 have made it increasingly practical to obtain detailed geometric and indicative attributes for building instances (Table 1). This includes demand for multi-attributes such as rooftops20,21,22,23,24, height25,26,27,28,29, function30,31, structure32, and age33. Despite the progress in multi-layered 3D city models at varying Levels of Detail (LoD) according to the CityGML international standard, large-scale 3D building datasets with geometric attributes remain scarce34,35,36,37. Furthermore, the absence of standardized definitions and methods for extracting building indicative attributes has resulted in an overemphasis on geometric properties in existing datasets, hindering a thorough understanding of urban structures. Historically, building attributes such as rooftops and heights were extracted at the grid scale, categorizing all buildings within a grid into a single class, which proved insufficient for detailed urban analysis7,38. Therefore, developing universal methods for the rapid extraction of building multi-attributes is vital for effective urban planning, research, and achieving Sustainable Development Goals (SDGs) 7, 9, 11, and 13.
Despite substantial efforts, extracting 3D building data continues to face challenges due to insufficient spatial and temporal resolution, limited training samples, and high costs. Currently, large-scale building footprints from sources like Google and Microsoft20,23 are advancing towards building-instance-level detail. Zhang et al.24 and Sun et al.28 produced rooftop data at a similar level, but Zhang’s work covers only 90 cities in China, and Sun’s dataset, while nationwide, uses non-open-source data, limiting update ability. Cao et al.25 utilized open-source Google Earth imagery but did not provide imaging times for each region, and Liu et al.27 used super-resolution algorithms on Sentinel-2 data, complicating vectorization and direct application. High manual labeling costs restrict the number of high-resolution labels, limiting the coverage of diverse urban buildings39 and failing to reflect construction variations across different climatic zones33. Current methods for extracting building heights include LiDAR, SAR, and high-resolution optical remote sensing. LiDAR, which employs satellite, aerial, or vehicle-mounted lasers for high-resolution surveying, incurs substantial equipment costs40. SAR emits microwave signals and receives reflections, often suffering from mixed scattering effects and high data processing costs41. High-resolution optical remote sensing directly estimates building heights but lacks comprehensive 3D information due to the limitation of satellite angles and dates, making deep learning interpretations less interpretable42. Combining building footprints with multi-source data, such as street view images (SVIs), shows promise but faces challenges of occlusion and incomplete coverage43,44,45. These methods highlight the need for continuing exploration of novel approaches to comprehensively capture the multi-dimensional attributes of urban structures. Recent studies have demonstrated that fusing multimodal data—incorporating not only optical and SAR but also economic and social factors—can significantly improve the accuracy of large-scale building height estimation, while integrating geographic knowledge into deep learning frameworks has yielded more precise spatiotemporal urban climate zone mappings, offering insights into urban thermal environments46,47. This is particularly crucial in developing countries where traditional aerial surveys are economically prohibitive, time-consuming, and involve high analytical costs. By contrast, open-source data offers greater potential for the rapid extraction of 3D building information24,26.
Meanwhile, our current understanding of urban structures remains primarily at the physical level, as represented by existing building rooftops and height data, due to the absence of comprehensive indicative attributes of buildings, such as function, style, age, quality and vacancy. To our knowledge, there are currently no large-scale datasets that provide these attributes at the building-instance level. Existing studies have primarily relied on SVI data to estimate building function, age and quality. However, due to the incomplete spatial distribution of SVI data and the spatial mismatch between SVI data and building data in previous studies48, the methods are different to scale up for national-scale data production. For building functions, it is limited to interpreting building functions only from remote sensing images. In previous studies, POI data, building morphology data and even Location Based Service (LBS) data have been used, but due to limited coverage and lack of large data sets, there are no national-scale data at present. Building age has greater application value in urban renewal studies. While the temporal resolution of remote sensing imagery represents the spatial distribution patterns of buildings within a specific time frame, building age requires precise information on the main construction year of each building. Regarding the building structure and style, it is often related to the fields of urban planning and civil engineering, and there is little research on the interpretation of remote sensing data. As for building quality, conventional remote sensing imagery cannot capture the characteristics of building quality. Chen et al.49 collected millions of SVIs from 2015 across China to measure street-level spatial disorder in over 700,000 streets across 264 cities. While this dataset includes some building quality features, it lacks specific building-level details and does not cover all street-facing or visible buildings due to sparse sampling points.
Accurate and comprehensive building data is crucial for supporting digital and intelligent urban studies and planning. The spatial distribution, 3D information, function, quality, and construction age of buildings reveal fine-grained spatial and dynamic 3D evolution patterns of cities at both the physical and social-functional levels50. This understanding is critical for urban development, redevelopment, and the interaction between humans and the built environment51. By integrating geographic analysis tools, deep learning, and ensemble machine learning models, this paper proposes the rapid extraction of multi-attribute building information with artificial intelligence. Utilizing multi-source data, this study produces the first comprehensive multi-attribute building dataset (CMAB) containing 32 million buildings and covering 3,667 spatial cities in China. The main contributions of this paper can be summarized as follows: (1) Enhanced accuracy of three-dimensional building products using multi-source data and ensemble machine learning; (2) The first nationwide dataset using open-source data for rapid acquisition of comprehensive building attributes and providing multi-attribute buildings at the instance level; (3) Manually creation of extensive labelled data on building rooftops, heights, structures, functions, styles, ages, and quality, providing a foundation for further research and application.
Methods
Our method consists of four key steps: (1) preparation before prediction: we define the boundaries of spatial cities to define the extraction range of data products (see section Study area and sampling strategy). We select building samples based on climate zones and administrative city levels in China. All buildings are categorized into five classes according to their respective administrative levels. (2) extracting geometric attributes: rooftop samples, enhanced by manual labelling, are used to train the OCRNet model. A spatial aggregation method is employed to extract building rooftops across all spatial cities. Based on this, we calculate the morphological, density, and locational characteristics of buildings at different scales1,26. Suitable models are trained for each administrative level class to obtain building heights, completing the extraction of 3D buildings (see section Geometric attributes extraction). (3) extracting indicative attributes: multi-source data is utilized to further extract functional characteristics at different scales, predicting building functions based on height. By integrating impervious surface data from GAIA and 60 million SVIs, we assign building age and quality to each building instance through spatial matching and object detection (see section Indicative attributes extraction). In addition, the building structure and style attributes are obtained by fine-tuning the multimodal model. (4) validate multiple attributes: we conducted the model evaluation of the building rooftop, height, and function with the validation dataset and also validated the building’s height, function, quality, and age through manual SVIs labelling (see section Technical validation). The production process of this dataset is shown in Fig. 1, and details of each procedure will be explained below.

The overall workflow of this study.
Study area and sampling strategy
Training and inference across the entire land cover of China are constrained by computational power and data limitations. Including large areas of non-human activity, which contain redundant information, can reduce model accuracy and increase computational burden. Zhang et al.24 improved computational efficiency by utilizing built-up areas from the FROM-GLC30 data, while Liu et al.21 assumed that people primarily reside near basic administrative units and employed heuristic sampling using county-level administrative units in China. The administrative city boundaries used by Chinese government departments encompass extensive rural and non-built-up areas, making them unsuitable for spatial sampling strategies. To tackle these challenges, recent research has introduced the concepts of spatial city boundaries, functional urban areas, and Degree of Urbanization boundaries3,52,53. From a building identification standpoint, spatial city boundaries, derived from night light imagery, land use and land cover data, and related urban GIS datasets, offer greater accuracy and efficiency for urban studies. This paper follows the methodology of Ma and Long, employing the concept of spatial cities to define these boundaries across China52. Therefore, we utilized the boundaries of 3,667 spatial cities across mainland China, each with an area exceeding 2 km², to define building areas, covering a total area of 95,670 km² (with an average of 26.1 km² and a maximum of 5,121 km², 1% of China’s total land area 9,634,057 km²) (Fig. 2).
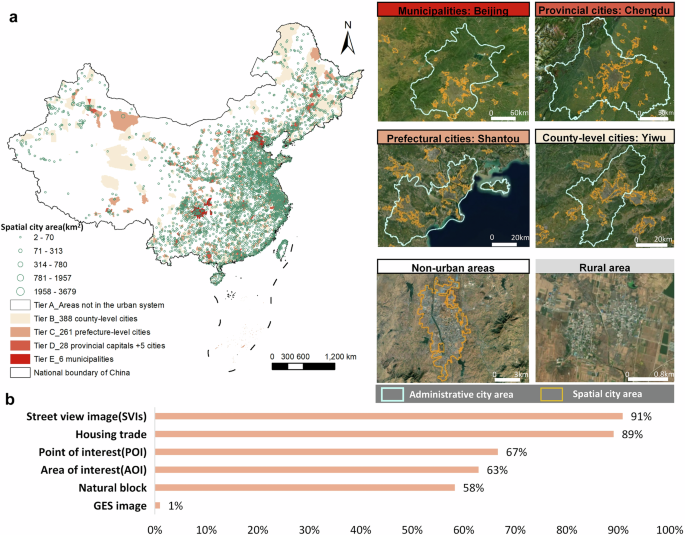
Sampling with spatial cities in China and the completeness of multi-source data. (a) Spatial city and administrative city distribution. (b) The ratio of multi-source data within physical cities to the total multi-source data across China. The diagram shows that most of the data in different datasets are concentrated in spatial cities that only occupy 1% area of China.
The completeness and bias of various data sources vary by region (Fig. 2). According to previous studies54,55,56, multi-source data such as AOI (Area of Interest), POI (Point of Interest), and SVI data are generally more complete in urban areas but more deficient in rural regions. Our analysis (Fig. 2) indicates that the range of the multi-source data used aligns well with the spatial extent of the identified spatial cities. This congruence suggests that using spatial sampling based on urban entities helps mitigate the bias of open-source data across different regions, ensuring the comparability of building attribute predictions. To improve recognition efficiency and accuracy, while accounting for varying levels of investment and construction intensity across cities, this study adopts the city classification system proposed by Zhang et al.24. We classify the administrative locations of all identified building roof centroids into five categories based on China’s urban administrative hierarchy: (1) 6 municipalities directly under the central government and special administrative regions, (2) 28 provincial capitals and five planned cities, (3) 261 prefecture-level cities, (4) 388 county-level cities, and (5) Non-urban areas (buildings outside any administrative city). Height and function models are trained according to these administrative divisions.
Data source
Google earth satellite image
We collected high-resolution remote sensing images from Google Earth Satellite (GES) image at a resolution of 0.3 m per pixel, with original resolutions under 1 m in remote areas. The images were downloaded in March 2024 using scripts (https://github.com/24kchengYe/RS-image-api) in the open map service application program interface (Google Earth API) provided by Google (https://www.google.com/earth). Since GES imagery comes from various global remote sensing satellites (WorldView and QuickBird, https://www.maxar.com and SPOT, https://www.intelligence-airbusds.com), there are regional differences. Given the high temporal and spatial costs of acquiring long-term GES image, for each spatial city, we selected the most recent and cloud-free images from the past five years through manual visual comparison and repetitive reasoning. Using the timestamps of the centroid points of each spatial city, we obtained the temporal distribution of all city images, with 70% of the images taken between 2022 and 2024 (Figure S1).
Other source datasets
Existing research indicates that building attributes can be derived from various data sources such as remote sensing imagery, SVIs, housing statistics, and urban geographic data1,3,45,57,58,59,60. This study employs and extends widely used indicator systems from previous research, drawing on data from different sources and volumes (Table 2). Considering data availability, we have summarized and visualized the primary data sources and validation data sources used in this study (Fig. 3). The multi-source data utilized in this study were not uniformly aligned to a single year due to the constraints on the availability of nationwide open datasets at consistent time points. To ensure robust building attribute extraction, we carefully considered the temporal relevance of each data source. In future work, as more consistent datasets become available, we aim to refine our approach by using temporally harmonized data to further improve the precision of our results.
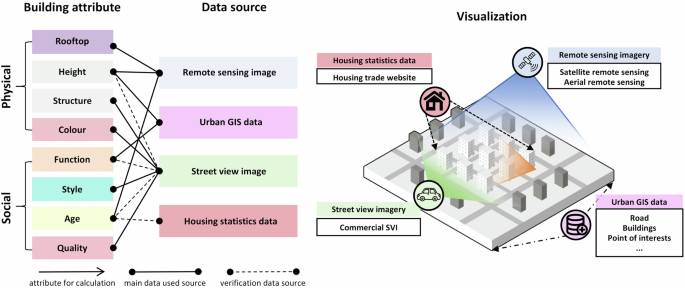
Building attributes and visualized source. “building attribute” records the attributes calculated, and the “data source” is the type of data source visualized for calculation.
Geometric attributes extraction
Building rooftop
Regarding the building rooftop, existing building instance segmentation labels often rely on segmentation models for assistance, resulting in lower accuracy in some regions39, and the remote sensing imagery used is difficult to obtain and lacks complete coverage61. Additionally, high-resolution image labels are rarely open-sourced24. In this study, we used the BITC dataset as the manually labelled data for building rooftop segmentation. This dataset contains 7,260 slices (500 pixels * 500 pixels) with 63,886 buildings, labelled from 0.3 m resolution Google high-resolution remote sensing image, covering Beijing, Shanghai, Shenzhen, and Wuhan.
We supplemented the BITC rooftop labels with additional manual labelling based on China’s climatic zones, as BITC only focuses on four cities and does not represent the entire architectural styles of China. It also pays less attention to densely built urban areas such as urban villages and other high-density urban areas. China’s architectural types are shaped by diverse natural environments and climates, resulting in varied cultural styles and complex layouts (Figure S2). Additionally, current satellite images exhibit blurred visual features62. Using BITC data, we used Baidu building datasets extraction annotation areas and selected appropriate dense urban areas for labelling according to China’s building climate zoning standards, ensuring an equal number of slices per zone to maintain sample balance (Figure S2). The final annotated dataset contains 8,760 slices, including 6,973 training and 1,787 validation slices, totalling 114,783 buildings across seven cities (Beijing, Urumqi, Hefei, Shenyang, Hohhot, Lhasa, and Xiamen) and three BITC cities (Shanghai, Shenzhen, and Wuhan). The final data augmentation operations included random cropping, image rotation, color jittering, image blurring, and noise addition. The dataset consists of annotation files in MS COCO 2017 format and corresponding binary building mask images, providing foundational data for high-resolution remote sensing image research on building detection and extraction.
We used OCRNet63 to extract building rooftops from standardized, pre-processed GES imagery. Unlike the Deeplabv3p method used by Zhang24 (2022a), which focuses on the relationships between context pixels without explicitly utilizing features of the target area, the OCRNet method addresses the problem of object region classification rather than pixel classification. That is, the OCRNet method emphasizes explicitly enhancing object information. Therefore, OCRNet is superior in terms of performance and complexity (see Supplementary note 1).
During the inference stage, each city’s remote sensing image is divided into grid slices. These slices are then sequentially input into the model for segmentation, yielding segmentation results for each grid. The Douglas-Peucker algorithm is applied to vectorize the raster data. Finally, the segmentation results of all grids are spatially merged. Because the same building may be divided because it is located in different slices, we use a post-processing method to eliminate these cracks. The specific method is to detect the similarity of polygon edges of buildings in the corresponding buffer zone of the boundary and repair them with fishing nets. A 1.5-meter buffer zone is generated around each building to create new structures. In instances where these newly formed structures intersect, they are merged accordingly. Subsequently, a negative buffer of -1.5 meters is applied to re-establish the original boundaries of the buildings. The attributes of the buildings are then matched through spatial relationships.
Building height
Related studies have verified that Baidu data meets the accuracy requirements for building height modelling in China28,29,38. According to Liu et al.38 the overall mean height deviation of Baidu building data is 1.02 meters, with an accuracy rate of 86.78%. In this study, we obtained building data for 96 major cities in China from the Baidu Map service (www.map.baidu.com/), which includes 12,772,156 individual building instances with floor information. After data cleaning, 9,820,495 buildings remained. Of these, 10% (982,049 buildings) were set aside as a test set, while the remaining 8,838,446 buildings were used for training and validation purposes (Figure S3). This division allowed for robust testing while ensuring a substantial amount of data for model training and tuning.
Existing research indicates that building height is correlated with the morphological patterns of building rooftops, the state of neighboring buildings, adjacent streets, and the morphology of the associated blocks21,26,64. For example, the morphological pattern of building footprints affects the complexity of building heights, with taller buildings typically having larger base areas, while shorter buildings tend to have more neighbors65. Buildings adjacent to streets and main roads may be taller due to skyline control and commercial development64. High-density streets often imply more high-rise buildings to accommodate larger populations, and buildings within the same block tend to have similar heights45. Additionally, we posit that building height is also related to the location of the area and the intensity of investment and construction65,66. Therefore, we have included the relationship between buildings and streets, their location within different administrative scales, and their relationship to urban functional centers (see Supplementary note 2 and Figure S4).
Quantifying model uncertainty is essential for interpreting results, with primary sources being the training data and model parameters. Li et al.41 employed an ensemble of multiple trees in a random forest to mitigate bias and overfitting inherent in single models. They recorded the standard deviation and mean of 100 predictions per sample, thus deriving the coefficient of variation as a measure of prediction uncertainty. In contrast, XGBoost does not offer independent prediction results from multiple trees. Therefore, we randomly selected 10% of the test data to assess error and uncertainty (see Figure S5).
Indicative attributes extraction
Building function
This study constructs a training set of building function data based on the identification of building heights. According to existing research31,67, predicting building functions typically involves combining building morphology with other data sources. Previous studies have often relied on datasets derived from manual function labels or building information provided by OSM maps. However, OSM data in China suffers from limited coverage and accuracy, and manually labelled data is challenging to scale nationwide. Fortunately, multi-source open big data, such as Area of Interest (AOI) data, provide plot-level functional characteristics. In China, buildings of different functions are often clustered by plots. Thus, this study determines building functions using Baidu’s 2023 AOI data, which offers functional features for 30 categories of plots (see Supplementary Table 1). The functions are reclassified, assuming that all buildings within a plot share the same function as the plot itself (see Supplementary Table 2).
Studies have demonstrated that building functions can also be inferred from morphological features in multi-source data such as POI, social media and SVIs. Buildings with different functions exhibit distinct morphological characteristics. For instance, public and commercial complex buildings typically have larger volumes, while office buildings tend to have high floors. Additionally, similar buildings often cluster together in China, allowing the characteristics of the block on which a building is located to help infer its function. The locational attributes of buildings and the distribution characteristics of surrounding POIs can also partially predict building functions. Notably, previous studies have utilized SVI data and social media data to infer building functions. However, the former only covers buildings along streets, and the latter is challenging to apply comprehensively to entire urban areas, limiting their generalizability. Therefore, this study ultimately constructed a predictive variable system from four dimensions: building morphological characteristics, block characteristics, urban locations, and the distribution features of 19 types of POIs such as life services and transportation services. The final set of features comprises 91 variables, some of which overlap with those used to predict building height (Fig. 4).
Construction of building features for height and function estimation. The features marked in bold are categorical and are encoded using label encoding and the category type. The features marked in red indicate new characteristics in the function index system compared to the height index system. See Supplementary Table 2 for more details.
Building quality
Our study builds on the existing work by extending Chen’s methodology49 with the enhancements introduced by Li68. We applied the updated Yolov8 deep learning model to analyze six specific indicators related to building quality: “Buildings with unkempt facades,” “Buildings with damaged facades,” “Illegal/temporary buildings,” “Graffiti/illegal advertisement,” “Stores with poor facades,” and “Stores with poor signboards.” Chen originally collected 4,876,952 SVIs from 264 cities in China, covering 1,219,238 sampling points across 70 million streets, demonstrating the potential for large-scale, human-eye scale assessments of street spatial quality49. Li further refined this approach by adding self-collected SVI data and improving recognition accuracy through the updated Yolo-v8 model68. To comprehensively represent the street-facing buildings in Chinese cities, we obtained all Baidu SVIs from 2014 to 2023, totalling 11,286,209 sampling points and 60 million images (14TB), covering 3,224 spatial cities. The quality of each building instance over the past decade was assessed using Yolo-V8 while parameter ({rm{conf}}) is 0.25. Due to inconsistent spatial coverage of SVIs across different years, we used the most recent year with SVIs available within each building’s buffer zone as the final quality assessment result (accelerated computation using Python library Vaex 4.17). The building quality level for each building ({rm{i}}) is represented by the total score of the average values of the relevant disorder categories for all street viewpoints ({rm{m}}) within a 100 m buffer of the building ({rm{i}}) centroid for each year ({rm{y}}). The building quality ({{rm{Q}}}_{{rm{iy}}}) is the total building disorder score of the building ({rm{i}}) in year ({rm{y}}) (Fig. 5).
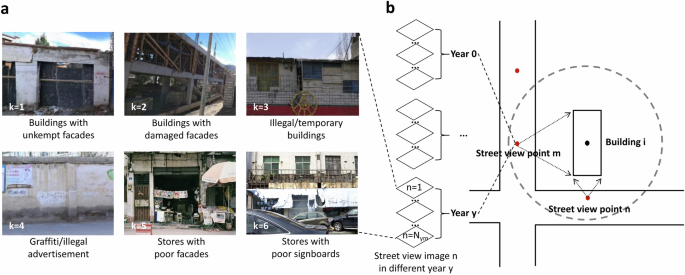
Evaluating the quality of buildings along the street through SVIs. (a) Building disorder types k for building quality. (b) Temporal and spatial distribution of SVI in the building buffer zone.
({rm{M}}) means the total number of street viewpoints in the buffer zone of each building centroid; ({{rm{N}}}_{{rm{ym}}}) means the total number of SVIs in the street viewpoint ({rm{m}}) in year ({rm{y}}); ({rm{k}}) means the type of building disorder; ({{rm{S}}}_{{rm{yknm}}}) means the score (0 or 1, exist or not exist) of the building disorder type ({rm{k}}) of the SVI ({rm{n}}) in the street viewpoint ({rm{m}}) in year ({rm{y}}); ({{rm{T}}}_{{rm{yk}}}) means the total disorder score of building disorder type ({rm{k}}) within all street view point ({rm{m}}) in the buffer zone of the building ({rm{i}}) in year ({rm{y}});
Building age
Existing studies have identified the age of street-facing buildings using SVIs32,33. However, considering that such methods are challenging to scale up to a national level (as they require the age of all buildings rather than just street-facing ones), we employed long-term impervious surface data to determine the age of each building instance. Impervious surfaces consist of human-made structures that impede the natural infiltration of water into the soil, including rooftops, pavements, roads, etc. By reviewing existing research on impervious surface data and built-up area data41,69, we selected the GAIA data (1985–2018) with the relatively high spatiotemporal resolution to determine the construction age of each building instance. We assumed that the expansion of impervious surfaces is synchronous with the construction age of buildings. Thus, by identifying the first appearance of a building instance’s centroid in the spatial location of the impervious surface, we can assign 35 age categories to that building instance (Fig. 6).
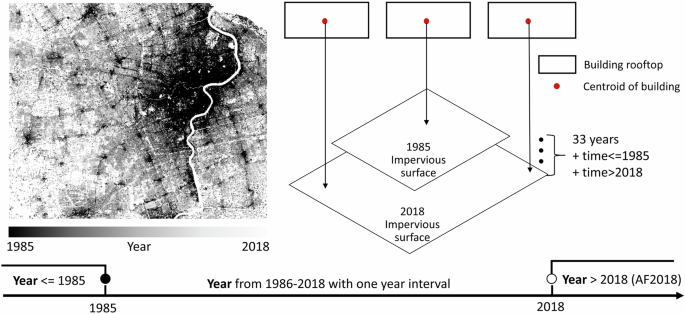
Method for adding building age to buildings with GAIA data.
Building partition model and combination model
This study utilized building data from 85 cities in Baidu’s 2023 dataset as ground truth for constructing a machine learning model to predict building heights based on multi-scale building features. This model generated three-dimensional building data for the entire country, and the accuracy of this data was subsequently evaluated. Upon generating the three-dimensional building data for Chinese cities, additional features related to building functions and three-dimensional morphological attributes were extracted from the height data. Using these comprehensive building features and treating the 2023 Baidu AOI data’s functional categories as ground truth, a secondary machine learning model was developed to predict building functions (see Supplementary Table 1, 2). This model produced functional attribute data for three-dimensional buildings nationwide, and the accuracy of this data was assessed.
As outlined, we predicted two attributes for each building roof: building height (meters) and building function. Employing parallel processing, distributed computing, and hardware optimization (such as GPU acceleration), the XGBoost algorithm70 demonstrated superior training efficiency over traditional tree models (e.g., random forests) when handling large-scale and high-dimensional data. Consequently, the GPU-accelerated XGBoost algorithm (Python library XGBoost 2.0.3) using NVIDIA GeForce RTX 3070 (Python library cupy 13.1) was employed for model training and prediction on this extensive building dataset, comprising tens of millions of training samples and hundreds of dimensional features.
Ensemble learning enhances model accuracy and stability by amalgamating the predictions of multiple models71,72. It encompasses three primary methods: Bagging, Boosting, and Stacking. The approach we utilized can be described as ‘Bootstrap Aggregated XGBoost’ which combines aspects of Bagging and Boosting. Multiple training subsets were generated through bootstrap sampling, with each subset used to train an independent XGBoost model. The predictions from these models were then averaged (or voted upon) to enhance overall performance. To mitigate the issue of uneven height and feature sample distributions, bootstrap sampling with replacement was employed73. This technique facilitated the creation of 100 models based on various data partitioning methods and XGBoost parameters for each height partition model and combined model, categorized according to city administrative levels. This methodology aimed to enhance the accuracy of overall model estimates and elucidate the uncertainty in model predictions.
Data Records
The dataset is deposited on Figshare (https://doi.org/10.6084/m9.figshare.27992417.v2)74. The product is organized by provinces and natural cities, and saved in the format of standard GIS format. Each building rooftop is preserved as a polygon drawn by a limited number of points in a geographic coordinate system WGS1984, including the building rooftop, height, function, age, and quality as building attributes shown in Fig. 7. See Supplementary Table 3 for the description of the attributes’ fields in the data.
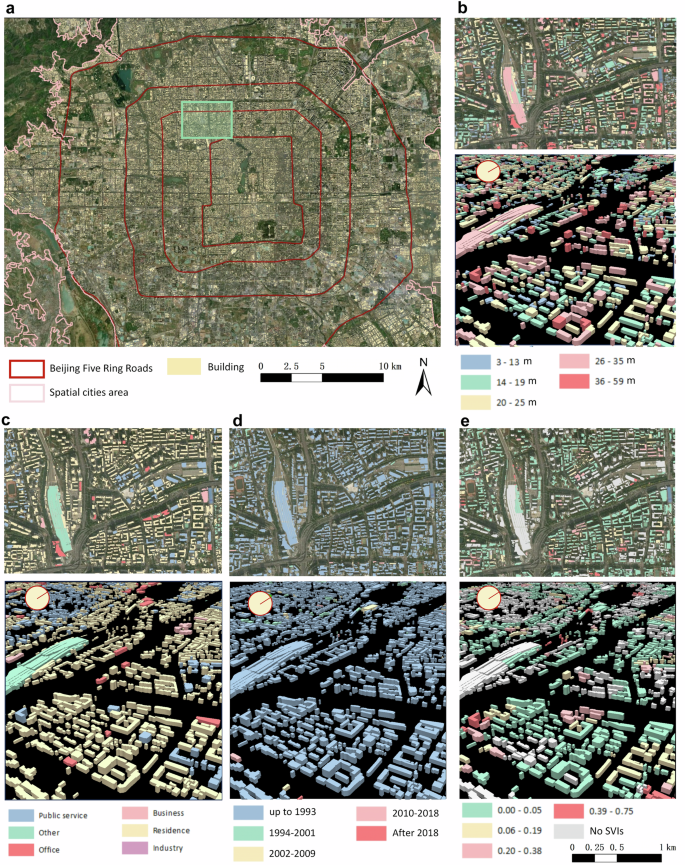
Visualization of multi-attribute building dataset in Beijing sample. (a) sample regional distribution. (b) Building height visualization. (c) Building function visualization. (d) Building age visualization. (e) Building quality visualization.
Technical Validation
The technical validation of the CMAB dataset consists of three parts: (1) the performance of the OCRNet model and the XGBoost model on the test set (including rooftop, height, and function); (2) comparison of our data with related published datasets (including rooftop, height, and functions); (3) validation by comparing predicted values with observed values from SVIs (including height, function, and age). For details, see the sections “Model evaluation and comparison for geometric attributes,” and “Model evaluation and comparison for Indicative attributes,”.
For evaluation metrics of building rooftop, mIoU (mean Intersection over Union) represents the average segmentation accuracy across all classes. Accuracy denotes the overall pixel classification accuracy. The F1-score combines precision and recall, making it especially useful for imbalanced datasets. Precision and Recall indicate segmentation performance for each class, identifying where the model performs better or worse. We use mIoU, Recall, Precision, F1-score, and Accuracy to evaluate the rooftop segmentation model:
TP is the True Positives for class i (building and background), FP is the False Positives for class i, and FN is the False Negatives for class i. mIoU is the mean IoU of the building and background classes, with k = 2 being the number of classes.
For evaluation metrics of building height, model accuracy metrics (RMSE/MAE/R2) were evaluated on the building height. RMSE emphasizes large errors and their impact. MAE reflects overall accuracy by averaging absolute errors. R² shows how well predictions fit the actual data. The formulas are as follows:
To assess the uncertainty in building height estimation, we randomly selected 10% of the test data for error and uncertainty analysis. For the remaining 90% of the data, 20% was randomly selected as the validation set and 80% as the training set in each iteration. This process was repeated 100 times, with XGBoost hyperparameters optimized through grid search during each iteration. The mean of 100 prediction results per building served as the final height prediction. Model accuracy metrics (RMSE/MSE/MAE/R2) were evaluated on the test set. Uncertainty was quantified as the range of relative error ({{rm{RE}}}_{{rm{i}}}) of the building ({rm{i}}), each trained on different data splits and optimized hyperparameters. A wide range indicates high uncertainty, while a narrow range suggests consistent predictions.
Specifically, for each building sample ({rm{i}}), ({{rm{RE}}}_{{rm{i}}}) is defined as the ratio of the difference between the true building height ({{rm{T}}}_{{rm{i}}}) and the predicted value ({{rm{P}}}_{{rm{i}},{rm{j}}}). Additionally, we provide the absolute error ({{rm{AE}}}_{{rm{i}}}) and the range of absolute errors across 100 model estimates. Here, ({rm{j}}) denotes the ({rm{j}}) th predicted value of the 100 model estimation:
To verify the model reasoning and calculation results of each attribute, the study used SVIs to validate building height, function, and age along streets. Five administrative cities were initially selected, and buildings along streets were sampled for validation. These cities represent different urban hierarchies, provinces, and climate zones. The sampling aimed to cover a wide range of building heights, functions, and ages. Subsequently, the nearest point on the building’s outline to the closest SVI point was designated as the observation point. The direction of the street view sampling was defined as vector 1, and the direction from the street view point to the observation point was defined as vector 2. The angle difference ({rm{theta }}) between these two vectors was calculated: if it fell between 45 and 135 degrees, the right-side image in the forward direction of the street viewpoint was extracted; if it fell between −45 and −135 degrees, the left-side image was extracted. A manual auditing platform was then established, involving an auditor with an urban planning background (Figure S6). This process led to the manual annotation of 2,500 data points on building height, function, structure, style, quality and age.
Model evaluation and comparison for geometric attributes
Building rooftop
To evaluate the accuracy of our product, we utilized higher-resolution remote sensing imagery and supplemented the annotated dataset with dense urban areas. We based our evaluation on a validation set comprising 23,415 manually labelled building roofs from seven cities located in different climatic zones. The results demonstrate that our building roof segmentation model outperforms existing studies in terms of mIoU, Recall, and Precision on related datasets. After supplementing the annotated data to include 114,783 building instances, our rooftop segmentation model achieved an Accuracy of 91.59%, a mIoU of 81.95%, an F1 score of 89.93%, and a Kappa coefficient of 79.86% (Table 3), proving the model’s capability to accurately identify buildings across various regions in China.
From the recognition results (Fig. 8), our data product demonstrates superior accuracy and completeness compared to existing building footprint datasets. Given the increased focus on spatial cities, we conducted a comparative analysis of building areas identified by different data products. Our findings indicate that our approach identifies a greater number of buildings in spatial cities. This outcome is expected, as our methodology involved the manual interpretation and comparison of remote sensing images across all spatial cities. The Douglas-Peucker algorithm with an empirical threshold used for vectorizing the contours distinguishes well between buildings and non-building objects such as cars, compared to GABLE and East_Asia buildings datasets. Additionally, our method aligns better with visual interpretation than the further black-box post-processed East_Asia dataset (using GAN), which tends to over-regularize, although some untreated roofs might appear less aesthetically pleasing due to retaining more segmented shapes. Regarding the recognition of buildings in remote areas, our climate zone annotations significantly enhanced the accuracy for some special buildings, such as large religious structures, compared to GABLE, East Asia, and 90_cities_BRA datasets. The total recognized building area in existing studies is similar, but the building count varies greatly for two main reasons: first, whether multiple roofs of a single building are identified separately, and second, whether small structures are mistakenly identified as buildings. It is worth mentioning that recent methods, such as the SKTrans framework75, have made significant strides in automatic building footprint extraction using deep learning, particularly in handling diverse building styles and tonal differences across regions. While our method shows strong accuracy, integrating newer approaches like SKTrans could improve both efficiency and precision in future updates. As methods evolve, incorporating self-supervised learning models could greatly enhance building footprint extraction, especially for large-scale and multi-temporal datasets.
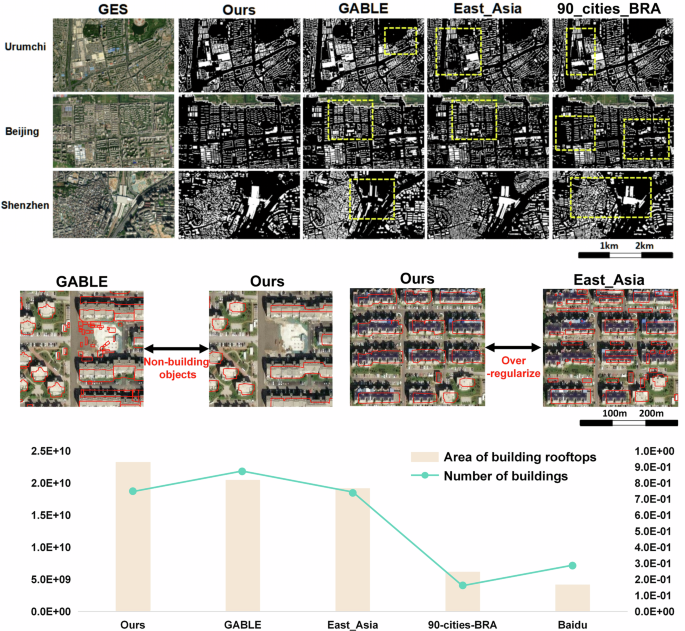
Visualization and Comparison of building rooftops with different building rooftops data in the boundary of natural cities we used. The limitation of CBRA using low-resolution data for super-resolution segmentation is that the building can’t achieve vector output, so this paper omits the comparison with CBRA.
Building height
Firstly, the comparison of the height partition models (A, B, C, D, E, representing models trained according to administrative levels) and the combination model, integrated through 100 training iterations using the Bootstrap Aggregated XGBoost method, is presented (See Table 4 for details). It can be observed that, except for the partition model trained on building data of level E, the accuracy metrics of the other partition models surpass those of the combination model. Notably, the R² values for the first two partition models exceed 0.8, with building height prediction errors less than 6 meters. This discrepancy can be explained by the substantial variation in construction investment intensity across different administrative levels. Buildings in higher-level cities are more influenced by socioeconomic factors, making their heights relatively harder to predict, as reflected in the higher R² values for building predictions in lower-level cities. Using SVIs, we audited 2500 building heights through manual observation of floor counts and further estimated their heights. Regression analysis against the dataset resulted in an R2 of 0.72, indicating accurate identification of building heights in most cases.
Secondly, we compared different products through visualization and height segmentation, focusing on Baidu, GABLE and 3D-GloBFP datasets (Fig. 9). Baidu data is used as the ground truth for Chinese building heights in most studies, including ours, which indicates the accuracy of our data product through the similarity in distributions. Furthermore, GABLE, the only product that identifies the height of all buildings from optical images across China, provides RMSE values for height intervals of 0–10, 10–30, 30–50, 50–100, and 100–500 meters. By categorizing our data according to these intervals, we found that our product exhibits lower RMSE values in the intervals below 50 meters. Based on statistics of Baidu data we used, 98% of building heights are below 50 meters. Additionally, according to the 2020 Chinese Census, residential buildings with more than 10 stories (roughly equivalent to building height higher than 30 m) account for only 1%. Furthermore, compared to the 3D-GloBFP dataset, which also utilizes Baidu data as the ground truth for building heights and employs machine learning models to estimate building heights, it does not report RMSE within height segmentation intervals for the entire China and only provides visualization maps. In these visualizations, the RMSE in China generally exceeds 10 meters, with specific RMSE ranges reported for Jiangsu Province as follows: 0–10 at 7 meters, 10–30 at 10 meters, 30–50 at 18 meters, and greater than 50 at 23 meters. In contrast, as illustrated in Fig. 9, our height segmentation intervals demonstrate higher accuracy, which is primarily attributed to our more detailed approach and the alignment of height feature creation with urban planning systems, such as incorporating munlcipal function centers of cities and along-street characteristics.
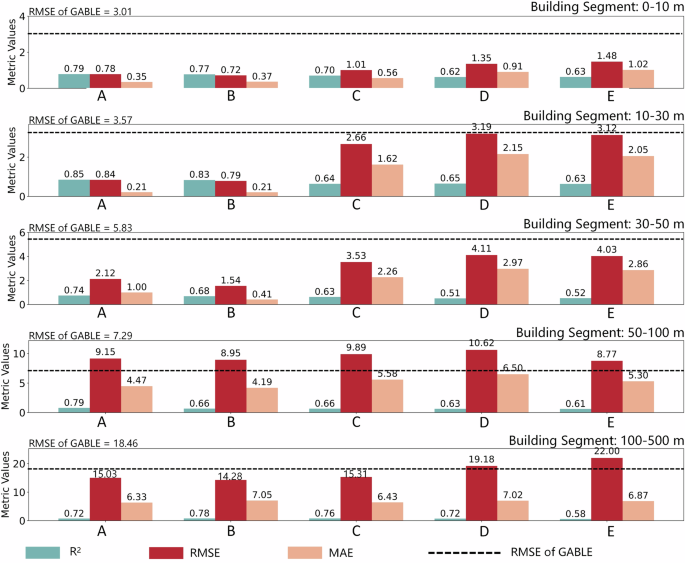
Visualization and Comparison building height model with GABLE. (A–E) stand for the height model that is trained according to administrative levels (see Table 4).
Therefore, these results indicate that our product achieves better height prediction results for the vast majority of buildings. Although our model, driven by optical and multi-source data, performs well, radar data is increasingly used in building height estimation. Studies using radar show improved accuracy for high-rise buildings25. Incorporating such data in future work could further enhance the precision of our height predictions, especially for high-rise structures.
The Relative Error range/Absolute Error range for the combination model, partition model C, partition model D, and partition model E is lower than partition models A and B (see Figure S5). This indicates that the overall accuracy decreases with higher city administrative levels, but the uncertainty in estimates due to different data partitioning methods and model parameters is lower, resulting in more stable estimates. The relative error curves of the four stable estimation models start to rise sharply around 20 meters (see Figure S5, similar to 3D-GloBFP), indicating that the deviation in building height estimates increases with the true height value, while the relative error for buildings below 20 meters is relatively low. The uncertainty is reduced in the partition models compared to the combination model (especially in the comparison between models C/D/E and the combination model).
Model evaluation and comparison for indicative attributes
Building function
The results clearly indicate that the partition models outperform the combined model, with Model A showing superior accuracy across multiple functional categories in Fig. 10. Notably, the precision for residential function identification is higher, with an F1-score approaching 0.90. Other functions, such as office buildings, have slightly lower identification precision, with F1-scores nearing 0.80. In contrast, the performance of the commercial and public service models is suboptimal, with F1-scores around 0.5. This discrepancy may be attributed to the varying sample sizes of different building types. Using SVI data, we verified the functions of 2500 buildings through manual auditing, observing details such as building names and architectural styles to determine their functions. Comparing these observations with the dataset, we found that 88% of buildings were accurately classified in terms of their functions. This indicates that the functional purposes of the majority of buildings were correctly identified through our methodology.
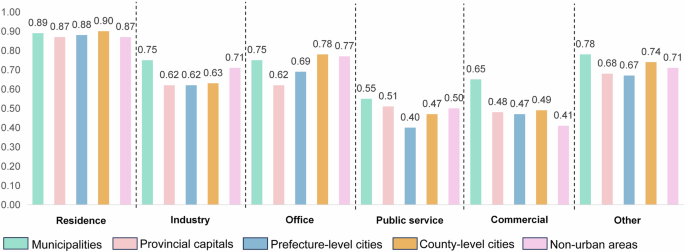
Accuracy of building function model.
Furthermore, we compared our study with recent research that identified the primary functions of buildings by calculating the geometric features of building coverage, distances to adjacent objects, and the kernel density of points of interest (POI)21. Firstly, unlike the aforementioned study, which focused on three urban agglomerations in China (Beijing-Tianjin-Hebei, Yangtze River Delta, and Pearl River Delta), our research encompasses buildings on a national scale. Secondly, in terms of model accuracy, our functional prediction model’s accuracy is slightly lower than that of the recent study (average accuracy of 0.93), likely due to the latter’s more limited scope. Nonetheless, the performance of our models across different functions aligns with the findings of that study, exhibiting strong performance in residential functions (average accuracy of 0.97) while demonstrating weaker performance in commercial (average accuracy of 0.63) and public service functions (average accuracy of 0.67).
Building quality and age
Judging from the model evaluation, the accuracy of building quality depends on the accuracy of the Yolo-v8 model. According to Li68 and related research, the identification accuracy of various building quality categories is as follows (See Table 5 for details): “Buildings with damaged facades” (82.7%), “illegal/temporary buildings” (71.6%), “Graffiti/illegal advertisement”(81.5%), “Stores with poor facades”(89.2%), “Buildings with unkempt facades”(79.2%), and “Stores with poor signboards”(86.3%). The accuracy of building age depends on the accuracy of GAIA data. According to Gong, the mean overall accuracy over years of GAIA is higher than 90%69.
We acknowledge that using impervious surfaces to date buildings may lead to estimates that are slightly earlier than the actual construction year, as impervious surfaces are often developed prior to building construction. To validate our method, we utilized extensive housing trade data from Anjuke.com, one of China’s largest real estate platforms, including 3,771,892 house rent and 608,984 community records, covering 2,490 cities with construction years and coordinates (Figure S7, Figure S8). We found a significant positive correlation (P < 0.05) between the building ages from housing trade data and our estimates at the provincial level. However, as housing trade data is typically aggregated at the community level, full validation of building-level age remains a challenge. Additionally, our comparison with GAIA building age data demonstrated an average difference of 8.7 years, with GAIA dating buildings earlier than the housing trade records. In future data product updates, we aim to incorporate accurate building ages observable through street view images to enhance accuracy.
Therefore, we finally used SVI to manually mark and validate the quality and age of 2500 buildings using SVIs through manual auditing, assigning quality problems severity scores from 0 to 6, where higher scores indicate more severe issues of building. The correlation analysis with existing results yielded an R2 value of 0.78, indicating accurate identification of quality issues in the majority of buildings. Regarding the building age, we divided the building age in manual labelling into five categories (time division points are 1985, 1990, 2000, 2010, and 2018), and counted whether the identified building age conforms to the observed true value of the category, and found that 82% of the buildings are consistent. This shows that most building ages are accurately classified. The reason we can’t make statistics directly according to the year of building completion is that, firstly, we can’t determine the year of completion just by visual inspection; and secondly, the experiment assumes that the expansion of impervious surfaces is synchronous with building construction age, whereas in reality, some buildings are demolished, and others appear before the impervious surfaces are established.
Building structure and style acquired by large multimodal models
Currently, large multimodal models (LMMs) like GPT-4o have significantly changed the paradigm of machine learning application modelling. We found that LMMs perform well in inferring building structure and style (Figure S9). We tested models like CLIP76 and GPT-4o77. While GPT-4o’s accuracy, enhanced by semantic understanding, is about 8% higher, the high cost of inferring 60 million street view images led us to use the open-source CLIP model. We fine-tuned CLIP using 2,500 annotated SVIs (height, function, age, quality, structure, style), improving its top-1 accuracy to 25%, surpassing GPT-4o.
However, we observed that CLIP’s top-1 accuracy for attributes like building height, quality, and age remains much lower compared to machine learning models built with well-defined building features we used. This is understandable since SVIs cannot capture full building height, multimodal models lack fine-grained recognition of quality, and SVIs cannot provide year-by-year temporal granularity for building age. For functions, while LMMs achieve similar accuracy to our metric-based modelling, SVIs don’t cover internal buildings within blocks77.
Usage Notes
Statistical analysis results of all building attributes (according to national and provincial scales) See Supplemental Note 3 and Figure S10-S13). These results will help policy makers and researchers to update their understanding of the physical structure and social state of China’s building stock.


Responses