Co-targeting of metabolism using dietary and pharmacologic approaches reduces breast cancer metastatic burden
Introduction
Breast cancer is the most common hormone-dependent malignancy among women worldwide, with luminal estrogen receptor-positive (ER+) breast cancer constituting >70% of cases1. At diagnosis, ~63% of breast cancers are detected at the local stage, 28% at the regional stage, and 6% at the metastatic stage2. Overall, 50% of the patients have recurrence independent of the initial stage at diagnosis. Five-year survival rates reflect stark realities, with rates of just 27% and 22% for women and men with metastatic breast cancer, respectively3. The median survival for metastatic breast cancer patients is 2–3 years4. Ultimately, metastatic tumors contribute to >90% of cancer-related deaths5.
ERα is a transcription factor activated by estrogen to orchestrate gene expression through interactions with estrogen response elements within gene promoter regions6 to primarily influence cell proliferation and survival7. Five years of adjuvant endocrine therapy targeting either the estrogen receptor alpha (ERα) or the synthesis of its ligand (aromatase) demonstrates reduced recurrence among early-stage ER+ breast cancer patients over a span of two decades, contingent upon tumor size, nodal status, and tumor grade8. This extends to metastatic breast cancer, which most frequently involves the bone (67%), lungs (36.9%), and liver (40.8%)9,10. The therapeutic framework for metastatic ER+ breast cancer is based on anti-estrogen interventions, encompassing tamoxifen, an estrogen effect mitigator; Fulv or Elacestrant, selective ER degraders; and aromatase inhibitors countering estrogen production. The current standard of care for metastatic patients involves combining these therapies with either CDK4/6 or PI3-kinase inhibitors that target downstream or upstream of ERα signaling, respectively11.
However, in about 40% of metastatic breast cancer cases, ER signaling is altered via genomic alterations, including mutations in ESR1, the gene encoding ER, or loss of ER expression, paving the path toward an endocrine-insensitive phenotype12,13. This resistance is a therapeutic challenge, as a significant portion of tumors fail to respond to endocrine therapy and progress along a trajectory of evolving resistance14. Several studies reported the avidity of the breast cancer cells with mutant ERα to metastasize to the liver15,16,17. Managing liver metastasis is clinically very challenging as we currently lack effective treatments. In our previous study, standard-of-care treatments, including Fulv, Palbociclib, or Fulv+Palbociclib, were ineffective in reducing the liver metastatic burden of ER+ breast cancer xenograft model18, reflecting clinical observations for patients with liver metastatic breast tumors19. Thus, a comprehensive understanding of the intricate mechanisms governing breast cancer liver metastasis and novel therapeutic approaches are immediately needed.
Dietary interventions have transformative potential to improve the efficacy of anti-cancer therapies as following these diets does not require a clinical setting20. For example, a ketogenic diet composed of high fat, moderate proteins, and minimal carbohydrates effectively induces ketogenesis21. In this intricate metabolic phenomenon, lipolysis-driven fatty acids undergo metabolism, resulting in the formation of acetoacetate, which subsequently is metabolized into β-hydroxybutyrate (β-OHB) and acetone22,23. β-OHB is an important ketone body, produced by the hepatic β-oxidation pathway, effectively replacing glucose as the predominant energy source for the rest of the body22. This holds particular significance considering the role of carbohydrates in driving endocrine resistance in liver metastatic breast tumors. Animal studies further support these findings that the ketogenic diet not only inhibits primary tumor progression but also systemic metastases24,25.
Endocrine-resistant ER+ breast cancer has increased glucose uptake and utilization, rendering glycolysis suppression effective in ER+ tumors26,27,28. We recently used spatial and bulk transcriptomic analyses coupled with metabolic investigations of metastatic breast cancer cells and in vivo xenograft tumors to show that the ketogenic diet recalibrated the tumor microenvironment by reducing glucose levels and glycogen deposition while concurrently alleviating the liver’s metastatic burden, particularly in response to Fulv treatment29. Based on our results, we further examined the molecular mechanisms activated by this therapeutic combination. We used a mouse model of ER+ breast cancer xenograft tumors and administered a ketogenic diet, complemented by Fulv treatment. We found that while the ketogenic diet increased β-OHB production, Fulv inhibited the metabolism of the β-OHB by suppressing the expression of OXCT1. Our findings underline the profound implications of identifying and intricately targeting multiple metabolic mechanisms governing glucose, lipid, and ketone body metabolism. This strategic combination of dietary and pharmacological approaches reveals novel avenues with the potential to revolutionize the clinical trajectory of metastatic breast tumor intervention.
Methods
Chemicals and reagents
Glucose (No. 103577-100, Agilent Technologies) was purchased as a 1.0 M solution. Palmitic acid (No. 10006627) was purchased from Cayman Chemicals as a powder, and the stock solution was prepared in EtOH at a concentration of 0.1 M. β-hydroxybutyrate (No. 54965, Sigma-Aldrich) was also purchased as a powder. The stock solution was prepared in Phosphate Buffered Saline (PBS) at a concentration of 0.1 M. [U-13C] Glucose (No. CLM-1396-1, Cambridge Isotope Laboratories) was dissolved in ddH2O. Fulv (No. S1191, Selleck Chemicals LLC) stock solution (20 mg/ml) for in vivo studies was prepared in a 10% DMSO and 90% corn oil. Each animal was administered 100 mg/kg Fulv. For in vitro cell culture studies, Fulvestrant was dissolved in DMSO at a concentration of 1 mM. Cells were treated with 10−6M Fulv. siOXCT1 kit (No. sc-91720, RRID: SCR_007929) was purchased from Santa Cruz Biotechnology.
Cell culture
MCF7-ESR1Y537S and MCF7-ESR1D538G cell lines (RRID:CVCL_0031) were generated as described in ref. 30 and cultured in Dulbecco’s Modified Eagle Medium (DMEM) with non-essential amino acid salts, 10% fetal bovine serum, 100 µg/mL penicillin/streptomycin, and 50 mg/mL gentamicin.
Cell viability assays
For β-OHB dose-response assay using cell viability assays on hydrogels, we cultured MCF7 cells with mutant ERα as previously described29,31. Briefly, 96 well plates were coated with Native Coat ECMs for liver, lung, or bone (Xylyx Bio). Then, these plates were incubated at 37 °C in a humidified environment with 5% CO2 for at least 1 h. MCF7-ESR1Y537S or MCF7-ESR1D537G cells were seeded on coated plates after removing native coat mixtures at a density of 1 × 10³ cells/well in 96-well plates and grown overnight in DMEM without phenol red on day 0. On day 1, β-OHB treatment was started using the following concentrations: 0, 2, 4, 8, 16, and 32 mmol/L. β-OHB treatment was repeated on day 4; and on day 7, the effect of β-OHB on cell viability was assayed using WST1 (manufactured by Roche, sold by Sigma-Aldrich, St. Louis, MO, USA) assays, quantified on a Cytation5 plate reader by measuring absorbance at 450 nm (BioTek, Winooski, VT, USA).
For testing dietary mimicry conditions on liver hydrogels, MCF7-ESR1Y537S or MCF7-ESR1D537G cells were seeded at a density of 1 × 10³ cells/well in 96-well plates coated with liver ECM and were grown overnight in DMEM without glucose and with 10% FBS on day 0. On day 1, cells were incubated with glucose-free media combined with different dietary mimicry conditions. Treatments were refreshed on day 4, and on day 7, the effect of dietary mimicry conditions on cell viability was assessed using WST1 assays. There were three different conditions to mimic the circulating level of key metabolites: (1) Control normal dietary medium (6 mM glucose, 1 mM palmitic acid, 0.5 mM β-OHB); (2) KD (4 mM glucose, 4 mM palmitic acid, 4 mM β-OHB); and (3) KD with low palmitic acid (4 mM glucose, 0.4 mM palmitic acid, 4 mM β-OHB).
For testing dietary mimicry conditions on Fulv response, MCF7-ESR1Y537S cells were seeded at a density of 1 × 10³ cells/well in 96-well plates and were grown overnight in DMEM without glucose and with 10% FBS on day 0. On day 1, cells were incubated with glucose-free media containing vehicle control or 10−6 M Fulv, combined with dietary mimicry conditions. Treatments were refreshed on day 4. On day 7, the effect of 10-6 M Fulv and dietary mimicry conditions on cell viability was assayed using WST1 assays. Two conditions were used to mimic circulating level of key metabolites: (1) KD (4 mM glucose, 4 mM palmitic acid, 4 mM β-OHB) and (2) KD with low palmitic acid (4 mM glucose, 0.4 mM palmitic acid, 4 mM β-OHB).
For testing individual components of the dietary mimicry conditions, MCF7-ESR1Y537S cells were seeded at a density of 1 × 10³ cells/well in 96-well plates and were grown overnight in DMEM without glucose and with 10% FBS on day 0. On day 1, cells were incubated with glucose-free media supplemented with a normal dietary condition or single metabolites. Treatments were refreshed on day 4. On day 7, cell viability was assessed using WST1 assays to evaluate the effects of dietary mimicry conditions or individual metabolites. There were six different conditions: (1) Control normal dietary medium (6 mM glucose, 1 mM palmitic acid, 0.5 mM β-OHB); individual metabolite conditions: (2) 4 mM glucose; (3) 6 mM glucose; (4) 0.4 mM palmitic acid; (5) 4 mM palmitic acid; (6) 0.5 mM β-OHB; (7) 4 mM β-OHB.
siRNA knockdown experiment
MCF7-ESR1Y537S or MCF7-ESR1D537G cells were seeded at 2 × 10³ cells/well in 96-well plates and grown in DMEM without phenol red and antibiotics overnight. The next day, cells were transfected with 25 nM ctrl siRNA or siRNA pool targeting OXCT1 (Santa Cruz Biotechnology, Dallas, TX, USA). Cells were incubated with media containing siRNAs for 6 h. After incubation, the normal growth medium was added. Cell viability was measured and analyzed as above after 24 h. 2 × 10⁵ MCF7-ESR1Y537S cells were seeded in 6-well plates following the same procedure and timeline to determine OXCT1 silencing via qPCR. The primers for OXCT1 were as follows: Forward (5′- > 3′): GTTGGTGGTTTTGGGCTATGT; Reverse (5′- > 3′): AGACCATGCGTTTTATCTGCTT. All experimental conditions had 6–12 technical repeats, and experiments were repeated at least three times.
In vivo xenograft studies
All experiments involving animals were conducted following National Institutes of Health standards for the use and care of animals, with protocols approved by the University of Illinois at Urbana-Champaign IACUC (protocol #20158). To test the impact of a ketogenic diet on metastatic burden 6-week-old NSG immunodeficient female mice from the Jackson Laboratory (Bar Harbor, ME, USA) were used in this study. Mice were housed under a 12-h light-dark cycle with ad libitum access to food. After one week of acclimatization, they were randomized to control (N = 3) or the ketogenic diet (N = 4) groups. 5 days later, we delivered 1 × 10⁶ MCF7-ESR1Y537S cells resuspended in 10% PBS via tail vein injection using a 27 G needle. The control diet (CD, 3.93 kcal/gm, 62.6 kcal% carbohydrate, 20.9 kcal% protein and 16.3 kcal% fat; F4031, Bioserv, Flemington, NJ, USA) and the ketogenic diet (KD, 7.24 kcal/gm, 1.8 kcal% carbohydrate, 4.7 kcal% protein and 93 kcal% fat; F3666, Bioserv) were used for 56 days in this study (Fig. 1). Long term treatment with KD or KD+Fulv treatments resulted in complete regression of metastatic tumors. To identify molecular mechanisms activated in response to these conditions, we reduced the time of Fulv treatment from 4 weeks to 2 weeks, which enabled us to obtain metastatic tumors (here in named Fulv short-term (2 weeks) treatment in vivo xenograft study). The experiment was performed as follows. NSG mice under the same conditions as mentioned above were used in this study. After one week of acclimatization, we injected 1 × 10⁶ MCF7-ESR1Y537S cells, resuspended in 10% PBS, via tail vein injection using a 27 G needle. We then allowed four weeks for liver metastasis to develop. On day 29, we randomized the mice into either vehicle or Fulv groups, with or without the ketogenic diet, and began Fulv treatment on the same day (N = 8–10/group). Fulv was dissolved in a solution of 10% DMSO and 90% corn oil (20 mg/ml) and 100 μl was administered via intramuscular injection (final dose of 100 mg/kg, into the hind thigh of the mouse) twice a week (Monday and Friday) for two weeks. Metastatic tumor burden was monitored weekly using the In Vivo Bioluminescence Imaging (IVIS) system (PerkinElmer). To follow the flux of carbon atoms coming from glucose, after two weeks of Fulv treatment, an isotope tracer in vivo xenograft study was conducted. [U-13C] Glucose (Cambridge Isotope Laboratories, Tewksbury, MA, USA) was dissolved in ddH2O (Millipore Milli-Q, Bedford, MA, USA) based on average mouse cohort body weight. Food and water were removed from the cages for 2 h. Fasted mice were then administered 2 g [U-13C] glucose/kg body weight (CLM-1396-1, Cambridge Isotopes, Tewksbury, MA, USA) in 250 μl of water via oral gavage. Food and water were returned immediately after the oral gavage. Blood and liver were harvested 30 min later (Fig. 2). To examine long term molecular effects of Fulv-treatment on metastatic tumors, we previously conducted a 4-week Fulv treatment in vivo xenograft study29. Plasma and metastatic tumor samples from that study were analyzed in this study. RNASeq data from this study was used (GSE184156) to examine expression of metabolic genes29.
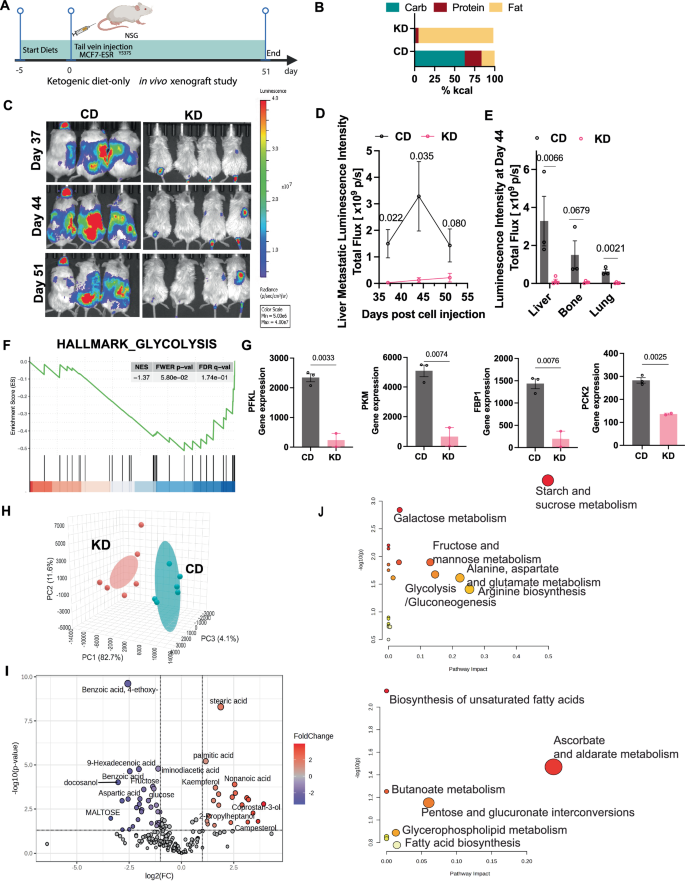
A Experimental timeline for the ketogenic diet intervention study. B Macronutrient composition (% kcal) of control diet (CD) and ketogenic diet (KD) used in this study. C Representative IVIS bioluminescence images of metastasis monitored weekly during the final three weeks of the study. D Quantification of liver metastatic burden over the final three weeks of ketogenic diet intervention. Data presented as mean ± SEM (N = 3–4 mice per group; p-values are indicated, unpaired two-tailed t-test). E IVIS bioluminescence quantification of metastatic burden in liver, bone, and lung tissues. Data presented as mean ± SEM (N = 3–4 mice per group; p values are indicated, unpaired two-tailed t-test). F GSEA demonstrating downregulation of glycolysis pathway genes in response to ketogenic diet. G Validation of differentially expressed genes by qRT-PCR. Data presented as mean ± SEM (N = 2–3 biological replicates, n = 2 technical replicates; p values indicated, unpaired two-tailed t-test). H Principal Component Analysis (PCA) plot of plasma metabolomic profiles from metastasis-bearing mice in CD or KD group (from 4-week Fulv treatment xenograft study). I Volcano plot showing differentially abundant metabolites in CD vs. KD groups (fold change ≥1.25, p < 0.05). Blue indicates downregulated metabolites in CD; red indicates upregulated metabolites in CD. J Bubble plot analysis of significantly upregulated metabolic pathways in CD group (upper panel) or KD group (lower panel). Bubble size represents number of metabolites; color intensity represents statistical significance (FDR < 0.05).
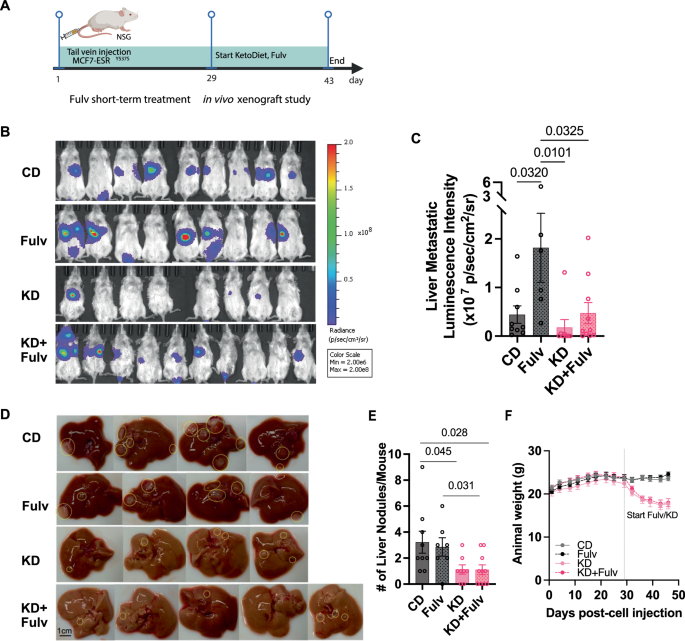
A Schematic timeline of the short-term ketogenic diet and Fulv treatment study design with harvest schedule. B Representative IVIS bioluminescence images showing metastatic burden in control diet (Fulv, ketogenic diet (KD), and KD+Fulv treatment groups at study endpoint (N = 8–10). C Quantification of liver metastatic burden based on bioluminescence signals. Data analyzed using one-way ANOVA with Tukey’s multiple comparison test (N = 8–10 mice per group). D Representative images of livers from mice in different treatment groups showing metastatic nodules. E Quantification of liver metastatic nodules counted during necropsy. Statistical analysis performed using one-way ANOVA with Tukey’s multiple comparison test. F Body weight changes over time.
Tumor monitoring, food intake, body composition, and sample collection
Food intake and body weight were measured weekly. Tumor growth was monitored weekly using an IVIS system (PerkinElmer, Waltham, MA, USA). Anesthesia was administered using isoflurane gas: mice were initially induced with 5% isoflurane at a flow rate of 1 L/min and then maintained at 1–3% isoflurane throughout imaging. A 200 µl dose of 15 mg/ml D-Luciferin was administered to each mouse via intraperitoneal injection, and imaging was performed after a 5-minute wait. Metastatic tumor burden was assessed using bioluminescence imaging, with radiance measured in photons per second per square centimeter per steradian (p/sec/cm²/sr).
At the end of each study, mice were euthanized using isoflurane gas anesthesia followed by cervical dislocation, after which tissue was collected immediately. 0.5–1 ml of cardiac blood was collected in tubes containing 0.5 M EDTA (Thermo Fisher Scientific). Blood samples were kept on ice until plasma was separated via centrifugation at 2000 × g for 10 min at 4 °C and then stored in a −80 °C freezer for further metabolomics analysis. Tumors and livers were harvested, and tumor burden was assessed and measured (final metastatic tumor nodules) during necropsy. All samples were stored in RNAlater (Thermo Fisher Scientific, Waltham, MA, USA) for RNA isolation, in 10% neutral buffered formalin (Millipore Sigma, Burlington, MA, USA) for staining, or flash-frozen in liquid nitrogen/dry ice for further analysis.
Metabolomics analysis
Metabolites of blood and tumors were extracted using acetonitrile/isopropanol/water and stored at –80 °C until submission to the Metabolomics Center in the Roy J. Carver Biotechnology Center at University of Illinois at Urbana-Champaign. Whole metabolite profiling was performed to detect and quantify metabolites using gas chromatography-mass spectrometry analysis. Metabolite profiles were acquired using an Agilent system (Agilent 7890 gas chromatograph, Agilent 5975 MSD, and HP 7683B autosampler; Agilent Technologies, Santa Clara, CA, USA). The spectra of all chromatogram peaks were evaluated using AMDIS 2.71 and a custom-built database with 460 unique metabolites. All known artificial peaks were identified and removed before data mining. To compare samples, all data were normalized to the internal standard in each chromatogram. This analysis identifies about 156 metabolites and reports a relative abundance of metabolites in tumors, enabling us to compare the same metabolites across the sample batch. Metabolomics data with sample class annotations (CD, Fulv, KD, KD+Fulv) were uploaded to the statistical analysis tool of MetaboAnalyst software (version 4.0)32. Features with >50% missing values were removed. Data were log-transformed and scaled using the auto-scaling feature. A heatmap of class averages of significant metabolites was generated using the heatmap feature with default options for clustering and restricting data to the top significant metabolites ranked by t-test. Partial least-squares discriminant analysis was performed to sharpen the separation between groups to show distinct metabolic profiling. VIP scores for the top significant metabolites discriminating between treatment groups were calculated and displayed using the partial least-squares discriminant analysis tool. Fold-change analysis was performed to compare absolute values of metabolite changes between two group means. Enrichment analysis and pathway analysis were used to identify metabolic pathways associated with enriched metabolites (fold change >2 or <0.05) using the default parameters.
Gene expression analysis
Data from GSE184156 was used29. Briefly, Metastatic tumors from the livers were microdissected and homogenized in 1 mL of TRIzol reagent (Life Technologies, Carlsbad, CA, USA), and total RNA was isolated according to the manufacturer’s protocol and purified using an RNAeasy kit (Qiagen, Hilden, Germany). RNA quality was assessed using BioTek Cytation 5 (Agilent Technologies). Concentrated RNA was submitted to the DNA Sequencing Group at the Roy J. Carver Biotechnology Center at University of Illinois at Urbana-Champaign. Complementary DNA (cDNA) libraries were prepared with the mRNA TruSeq Kit (Illumina, San Diego, CA, USA). Double-stranded cDNA was generated from fragmented RNA, and adapters were ligated to the ends. Casava 1.8.2 was used to base call and demultiplex samples. For preprocessing and quality control, FASTQ files were trimmed using FASTQ Trimmer (version 1.0.0). TopHat (version 0.5) was used to map single-end RNA-seq reads to the Mus musculus reference genome to exclude these from analysis. Gene expression values were quantified from BAM files and calculated using the StrandNGS (version 2.1) quantification tool. Partial reads were considered, with the option of detecting novel genes and exons. Default parameters for finding novel exons and genes were specified. Quality control and normalization were conducted in R using edgeR (version 3.24.3). Statistical analysis was conducted in R using limma (version 3.38.3). We used the DESeq normalization algorithm with default values. Differentially expressed genes were determined by fold-change and p-value with Benjamini and Hochberg multiple test correction for each gene for each treatment relative to vehicle control. We considered genes with fold-change >2 and FDR (or q) <0.05 as being significantly differentially expressed. Gene set enrichment analysis (GSEA) was used to identify gene ontology terms associated with different treatments.
Validation of the expression level of OXCT1 gene in the TCGA cohort
The Kaplan–Meier plot of OXCT1 was analyzed using online KM plotter software (http://kmplot.com/analysis/). We extracted the expression level of OXCT1 gene in the TCGA breast cancer patient cohort to explore distant metastasis-free survival patterns. The p-values are two-sided, and p < 0.05 was considered statistically significant.
Statistical analysis
Data are presented as mean ± SEM for bar and line graphs. Graphs and statistical analyses were generated using GraphPad Prism (version 10). For multiple-group comparisons, one-way or two-way ANOVA was applied, with post hoc adjustments as follows: Sidak’s method for selected pair comparisons, Tukey’s method for all-pair comparisons, and Dunnett’s method for comparisons to a control mean. Survival analyses were conducted using Kaplan–Meier curves, with p values calculated by the log-rank (Mantel-Cox) test and adjusted for multiple comparisons using the Benjamini-Hochberg method. Pearson correlation coefficients measured correlations. Heatmaps and principal component analyses were created using MetaboAnalyst 5.0 (https://www.metaboanalyst.ca/). All tests were two-tailed, with p < 0.05 considered statistically significant.
Results
A ketogenic diet reduces metastatic burden and alters metabolic pathways
To investigate the impact of a ketogenic diet on breast cancer liver metastasis and metabolism in mice, we delivered MCF7-ESR1Y537S via tail vein injection in female NSG mice (N = 3–4), which were then randomized to receive either a control diet (CD, 62.6 kcal% carbohydrate, 20.9 kcal% protein and 16.3 kcal% fat) and the ketogenic diet (KD, 1.8 kcal% carbohydrate, 4.7 kcal% protein and 93 kcal% fat) (Fig. 1A, B). IVIS bioluminescence quantification showed that the KD group had significantly reduced liver metastatic burden compared to the CD group throughout the treatment period (Fig. 1C, D, p = 0.022, p = 0.035, and p = 0.080 at days 37, 44, and 51, respectively). Additionally, we observed reduced metastasis in bone (p = 0.0679) and lung (p = 0.0021) tissues (Fig. 1E). During the first week of the study, mice on the ketogenic diet experienced a 5–15% reduction in total body weight compared to the control diet group, despite any sign of illness. Their body weights subsequently stabilized and gradually increased until the study’s conclusion (Supplementary Fig. 1). While food consumption remained comparable between the two groups for most of the study period; control mice began to eat less and experienced body weight loss during the last two weeks of the study as metastatic burden increased (Supplementary Fig. 1).
GSEA of RNA-Seq data from tumors from CD and KD groups29 revealed a substantial downregulation of the glycolysis pathway in the KD group. Specifically, we observed reduced expression of key glycolytic enzymes (PFKL, p = 0.0033; PKM, p = 0.0074) and gluconeogenic enzymes (FBP1, p = 0.0076; PCK2, p = 0.0025) in response to ketogenic diet (Fig. 1F, G). Plasma metabolomic profiling showed distinct metabolic signatures between the control and ketogenic diet groups (Fig. 1H). The CD group showed significant enrichment of carbohydrate-related metabolites, including glucose, fructose, and maltose. Conversely, the KD group exhibited elevated levels of fatty acids, including stearic acid, palmitic acid, and butanoic acid (Fig. 1I). Pathway analysis further confirmed these findings, revealing upregulation of fatty acid biosynthesis and butanoate biogenesis/metabolism pathways in the KD group (Fig. 1J).
Ketogenic diet restores fulvestrant efficacy in reducing metastatic burden
To investigate mechanisms underlying Fulv resistance in ER+ breast cancer metastasis, we utilized our previously established preclinical xenograft model29. Following tail vein injection of MCF7-ESR1Y537S cells (1 × 10⁶ cells/mouse) into female NSG mice (N = 8–10 per group), liver metastases developed within four weeks. We then initiated a 2-week treatment period with either CD, Fulv monotherapy, KD), or KD+Fulv combination (Fig. 2A). While our previous study demonstrated that 4-week combined ketogenic diet and Fulv combination treatment very effectively eliminated metastases, we shortened the treatment duration to 2 weeks in the current study to enable collection of viable tumor samples from KD and KD+Fulv groups for analysis (Fig. 2A). IVIS imaging revealed that both KD (p = 0.0101) and KD+Fulv (p = 0.0325) combination therapy significantly reduced liver and total metastatic burden within the 2-week treatment period (Fig. 2B, C). All mice in the KD and KD+Fulv groups survived through the final imaging timepoint, whereas one mouse in the Fulv monotherapy group died due to progressive metastatic disease (Fig. 2B). KD+Fulv group exhibited significantly reduced the number of metastatic liver nodules compared to the CD (p = 0.028) and Fulv monotherapy group (p = 0.031) (Fig. 2D, E). Consistent with our previous findings, mice receiving ketogenic diet (both KD and KD+Fulv groups) experienced a 10–15% reduction in total body weight compared to CD and Fulv monotherapy groups during the first week, though they exhibited no signs of illness (Fig. 2F). While total caloric intake initially decreased during the first three days of dietary transition, it normalized within one week (Supplementary Fig. 2). Although this cohort of mice required an adaptation period to the ketogenic diet, their overall caloric intake remained comparable between groups.
The ketogenic diet only inhibits glucose metabolism, yet continues to support Alanine metabolism and Aspartate-Malate shuttle in liver metastatic tumors
In our initial study29, we showed that while KD+Fulv combination was very effective in reducing metastatic burden while KD only was not enough to achieve this goal. Detailed molecular analysis revealed that KD+Fulv treatment was the most effective in reducing glucose metabolism and glycogen deposition while KD only treatment was not sufficient29. However, our short-term study (Fig. 2) suggested KD only treatment was as effective as KD+Fulv combination in reducing metastatic burden. To investigate if there might be other metabolic pathways that might feed TCA cycle, we first examined the gene expression changes associated with alanine metabolism, aspartate-malate shuttle and citrate shuttle pathways, as they all contributed metabolites to the TCA cycle (Fig. 3A). RNA-seq analysis from29 revealed that Fulv monotherapy significantly increased multiple metabolic genes associated with these pathways: citrate shuttle genes (PDHA1 [p < 0.0001], PDHB [p = 0.0121], MDH1 [p = 0.0055], CS [p = 0.2410], ACLY [p = 0.5415], ME1 [p = 0.0058]), aspartate-malate shuttle genes (GOT1 [p = 0.0550], GOT2 [p = 0.0028]), and alanine metabolism genes (GPT [p = 0.0002], GPT2 [p = 0.0346]) (Fig. 3B–D).
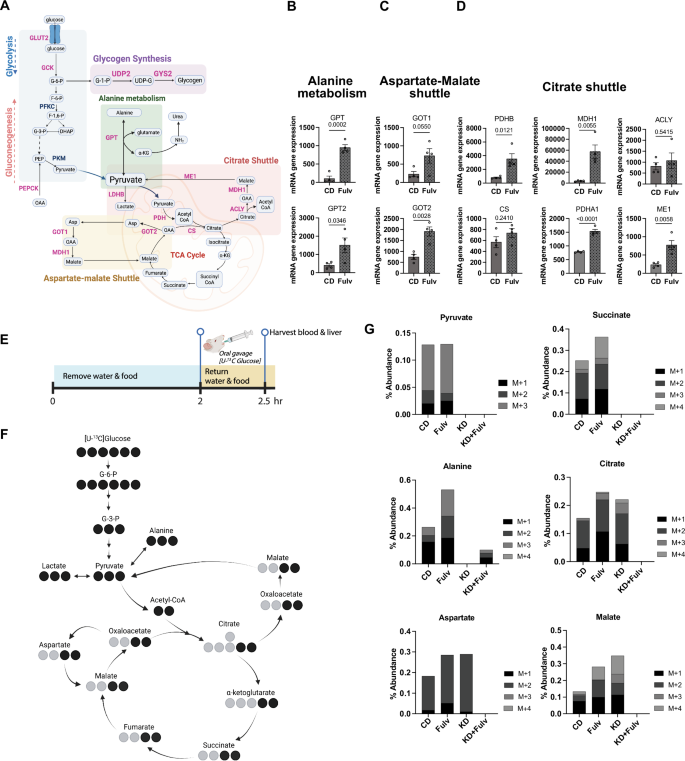
A Glucose metabolism pathways of interest. Created in BioRender.com. B Expression of alanine metabolism genes (GPT, GPT2) in CD versus Fulv-treated liver metastases. Data shown as mean ± SEM (N = 4), t-test. C Expression of aspartate-malate shuttle genes (GOT1, GOT2) in CD versus Fulv-treated liver metastases. Data shown as mean ± SEM (N = 4), t-test. D Expression of citrate shuttle genes (PDHA1, PDHB, CS, ACLY, MDH1, ME1) in CD versus Fulv-treated liver metastases. Data shown as mean ± SEM (N = 4), t-test. E Experimental timeline for [U-13C]-glucose tracer study, showing 2-h fast followed by oral gavage and 30-min metabolite incorporation period. F Schematic representation of glucose carbon flux through central carbon metabolism pathways highlighting measured metabolites. G Quantification of 13C-labeled metabolite abundance of molecules of interest with mass shifts detected (M + 1 through M + 4) in liver metastases across treatment groups (CD, Fulv, KD, KD+Fulv).
To track glucose metabolism in vivo, we performed stable isotope flux analysis using [U-13C]-glucose administered via oral gavage in our short-term (2-week) Fulv treatment experiment from Fig. 2A (Fig. 3E). Following a 2-h fast, mice received [U-13C]-glucose and were sacrificed 30 min later for collection of blood and tumor tissues. Analysis of labeled metabolites revealed that KD+Fulv treatment completely shut down glucose carbon incorporation into key metabolites of the tricarboxylic acid cycle (citrate, succinate, malate), alanine metabolism (alanine, pyruvate), and aspartate-malate shuttle (aspartate) compared to CD and Fulv monotherapy groups (Fig. 3F, G). However, KD-only group still exhibited aspartate, malate, and citrate labeling, suggesting KD-only is not sufficient to completely shut down key metabolic pathways in metastatic tumors.
Accumulated β-OHB in tumors reduces metastatic burden
To further examine metabolic differences that might explain why KD+Fulv is very effective in reducing metastatic burden, we further performed a detailed metabolomics analysis of plasma samples from our long-term study from Fig. 1A. Metabolomic analysis of plasma samples from our 4-week treatment study revealed distinct metabolite profiles among treatment groups29 (Fig. 4A). Statistical analysis identified glucose, β-OHB, and palmitic acid as key differentially abundant metabolites (Fig. 4B). The ketogenic diet significantly reduced plasma glucose levels (p = 0.0054 vs CD, p = 0.0004 vs Fulv) while increasing β-OHB concentrations (p = 0.0171 vs CD, p = 0.019 vs Fulv) (Fig. 4C, D). There was no statistically significant difference between the plasma level of these metabolites in KD vs. KD+Fulv groups. Notably, palmitic acid levels were significantly elevated in the KD group (p = 0.0009 vs CD, p = 0.0006 vs Fulv) but not Fulv monotherapy nor in the KD+Fulv group (Fig. 4D).
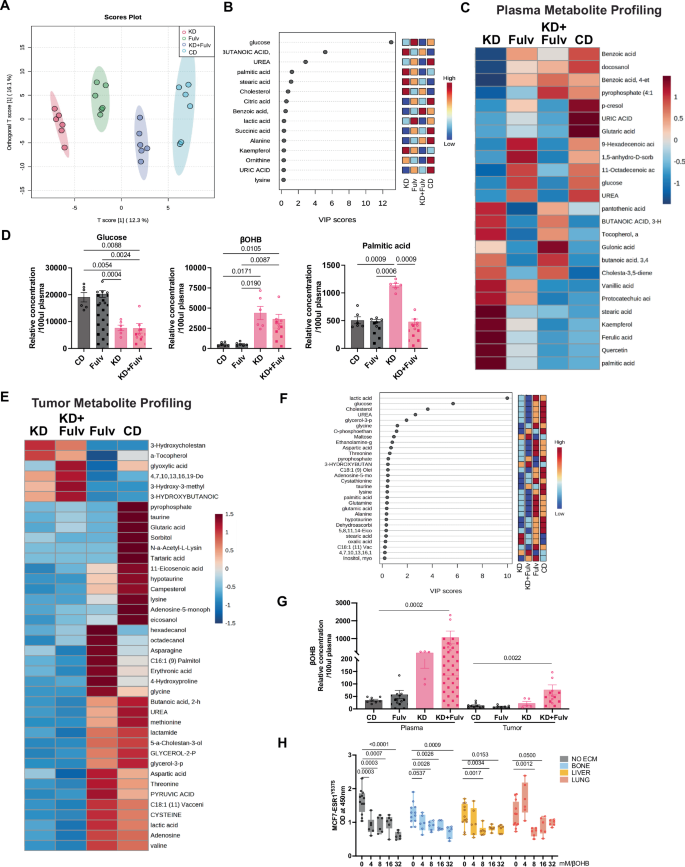
A OPLS-DA score plot showing metabolite profile clustering across treatment groups from 4-week study. B VIP scores identifying key discriminant metabolites from PLS-DA analysis. C Heatmap of plasma metabolite profiles from 4-week treatment study. D Relative plasma glucose, β-OHB and palmitic acid levels (relative concentration/100 μL plasma, N = 8–10). E Heatmap of tumor metabolite profiles from 2-week treatment study. F Top 30 metabolites of plasma ranked by VIP scores from short-term study. G Comparative analysis of β-OHB levels in plasma and tumor tissue (relative concentration/100 μL plasma for plasma; relative concentration for tumor). H MCF7-ESR1Y537S cell viability in organ-specific matrices treated with increasing β-OHB concentrations (0–32 mM). Statistical significance (P values) is indicated.
Since we were able to obtain tumors from KD and KD+Fulv groups in our short-term (2-week) study from Fig. 2A, we performed metabolomic profiling of both plasma and tumor tissue. This analysis demonstrated that KD and KD+Fulv treatment produced distinct metabolite signatures (Fig. 4E, F). While CD and Fulv groups showed elevated glucose metabolism-related metabolites, KD and KD+Fulv groups exhibited increased fatty acid and ketone body-associated metabolites. Importantly, KD+Fulv treatment led to a significantly higher accumulation of β-OHB in both plasma and tumor tissue compared to other treatment groups (Fig. 4G).
Given β-OHB’s known anti-inflammatory33 and epigenetic modifying properties through inhibition of histone deacetylases15,34,35 we investigated its direct effects on metastatic breast cancer cells. Using decellularized organ-specific matrices29,31 we evaluated MCF7-ESR1Y537S cell viability across physiologically relevant β-OHB concentrations. Notably, cell viability was significantly reduced at β-OHB concentrations above 4 mM in control cells as well as cells grown in decellularized matrices, suggesting a microenvironment-independent effect of β-OHB, correlating with our in vivo observations of reduced total metastatic burden (Fig. 4H).
Fulvestrant activates lipid metabolism in metastatic tumors
GSEA of liver metastases from our 4-week Fulv treatment study revealed significant upregulation of mitochondrial biogenesis and fatty acid oxidation pathways (Fig. 5A, B). Detailed transcriptional analysis demonstrated that Fulv treatment significantly increased the expression of genes involved in multiple metabolic pathways (Fig. 5C, D) including mitochondrial biogenesis (PPARGC1A (p = 0.0081), PPARA (p = 0.0139), ESRRA (p = 0.0094), ETFB (p = 0.0010)), fatty acid transport (CD36 (p = 0.0137), FABP1 (p = 0.0474), FABP2 (p = 0.1084), FABP7 (p = 0.1093)); fatty acid β-oxidation (CPT2 (p < 0.0001), ACADS (p = 0.0047), ECHS1 (p = 0.0011), HADH (p = 0.0059), HSD17B10 (p = 0.0064), EHHADH (p = 0.0115), HSD17B4 (p = 0.0104), HADHB (p = 0.0007)); and ketogenesis (ACAT1 (p = 0.0003), HMGCS2 (p = 0.0004), HMGCL (p = 0.0003)). However, OXCT1, a key enzyme in the ketolytic pathway was significantly downregulated (p = 0.0154), suggesting a potential role for this pathway in mediating ketone body accumulation and ensuing cell death in the tumor when ketogenic conditions are present.
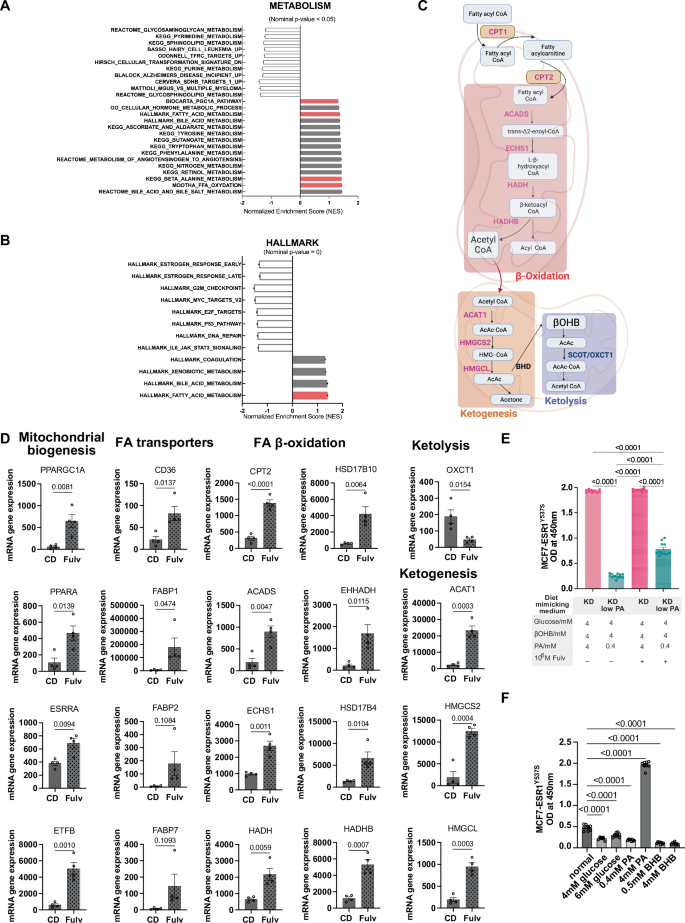
A GSEA enrichment plots showing upregulation of mitochondrial biogenesis pathways in Fulv-treated tumors. B GSEA enrichment plots demonstrating enhanced fatty acid oxidation pathways following Fulv treatment. C Pathway schematic illustrating Fulv-induced metabolic alterations. Red indicates upregulated genes; blue indicates downregulated genes. Created in BioRender.com. D Gene expression analysis (RNA-seq) comparing CD versus Fulv treatment for metabolic pathway genes. Data shown as mean ± SEM, unpaired t-test. E The effect of modulating glucose, palmitic acid (PA) and β-OHB levels to mimic plasma levels with different diets on cell viability was assayed using WST1. Statistical analysis was performed using one-way ANOVA followed by Tukey’s multiple comparison test (N = 12). F The effect of dietary mimicry conditions and single metabolites (Glucose, β-OHB, Palmitic acid) on cell viability was assayed using WST1. Statistical analysis was performed using one-way ANOVA followed by Tukey’s multiple comparison test (N = 8).
Based on physiological concentrations reported in literature for glucose (4–7 mM36), palmitic acid (0.3–4.1 mM37), and β-OHB (0–5 mM15,38), we developed an in vitro system modeling plasma concentrations of these molecules with different dietary conditions (Fig. 5E). Consistent with the reduced palmitic acid levels observed in KD+Fulv-treated mice (Fig. 4D), cell viability under conditions mimicking this metabolic state: low glucose (4 mM), high β-OHB (4 mM), and low palmitic acid (0.4 mM) was lower compared to the KD group (p < 0.0001) (Fig. 5E). This combination also significantly reduced viability of MCF7-ESR1Y537S (p = 0.0002) and MCF7-ESR1D538G (p = 0.0002) cells grown on liver ECM (Supplementary Fig. 3). While KD+Fulv group had cell viability comparable to that of KD group, reducing PA levels to 0.4 mM (KD with low PA+Fulv) resulted in lower cell viability compared to KD (p < 0.0001) and KD+Fulv (p < 0.0001) groups (Fig. 5E). When tested separately, single metabolites did not support cell growth as effectively as the normal dietary condition. However, increasing the PA concentration to 4 mM was sufficient to enhance cell viability (Fig. 5F).
Elevated OXCT1 expression associates with poor ER+ breast cancer metastasis progression
To validate our findings that the ketogenic diet mitigates breast cancer metastasis by downregulating OXCT1 expression in ketogenic conditions, we performed qPCR analysis on metastatic tumors treated with short-term KD and Fulv. The analysis revealed significant downregulation of the glucose transporter (SLC2A1) and key glycolytic enzymes (HK1, HK2). Conversely, the fatty acid transporter (CD36) and genes involved in ketogenesis (ACAT1) and ketolysis (OXCT1) were upregulated in the KD group. Fulv cotreatment (KD+Fulv group) prevented OXCT1 upregulation, further supporting our hypothesis that an increase in intratumor ketone body levels due to a ketogenic diet and downregulation of ketolysis by preventing upregulation of OXCT1 expression might drive reduced metastatic burden and cell viability in MBC (Fig. 6A).
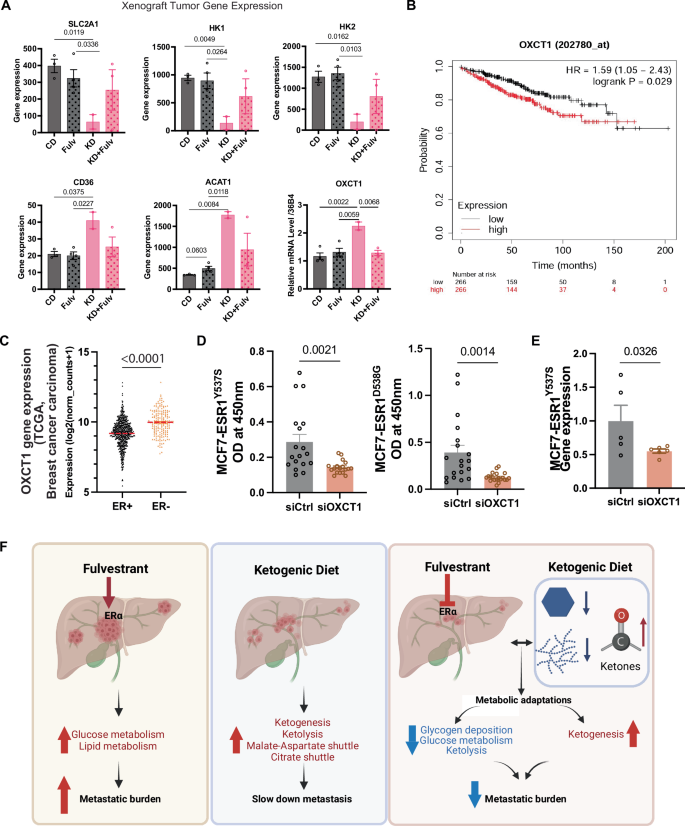
A Gene expression analysis by qPCR in liver metastatic tumors from the short-term ketogenic diet and Fulv treatment study. Statistical analysis was performed using one-way ANOVA with Tukey’s multiple comparison test. B Kaplan–Meier analysis demonstrating the correlation between elevated OXCT1 expression and decreased distant metastasis-free survival. C TCGA breast cancer carcinoma data analysis showing differential OXCT1 expression between ER+ and ER- breast cancers. D Cell viability assessment following OXCT1 knockdown in MCF7-ESR1Y537S and MCF7-ESR1D538G cells. Statistical significance was determined by t-test (mean ± SEM, N = 18). E Validation of OXCT1 knockdown using RT-QPCR in MCF7-ESR1Y537S cells. F -6 (N Schematic illustration showing how the ketogenic diet reduces glucose metabolism and glycogen deposition while enhancing lipid catabolism and ketogenesis, ultimately reducing metastatic burden. Created in BioRender.com.
When examining the role of OXCT1 in ER+ breast cancer metastasis, we found that increased OXCT1 expression correlated with reduced distant metastasis-free survival (Fig. 6B). Analysis of breast carcinoma data from The Cancer Genome Atlas (TCGA) showed that ER+ breast cancers exhibit lower OXCT1 expression compared to ER– breast cancers, suggesting that low OXCT1 expression could serve as a biomarker for increased tumor vulnerability to β-OHB or ketogenic diet interventions for this subtype (Fig. 6C). Notably, OXCT1 knockdown significantly reduced the viability of MCF7-ESR1Y537S and MCF7-ESR1D538G cells compared to siRNA controls (Fig. 6D), where OXCT1 levels were reduced about 50% (Fig. 6E)
In conclusion, our findings demonstrate the potential clinical benefit of combining the ketogenic diet with Fulv to reduce glucose metabolism while promoting ketogenesis. This metabolic reprogramming enhanced Fulv efficacy and reduced breast cancer liver metastasis (Fig. 6F).
Discussion
In our previous work, we identified metastatic-niche-specific metabolic vulnerabilities and demonstrated that the ketogenic diet enhances Fulv response in ER+ breast cancer liver metastasis29. Here, we further characterize the molecular mechanisms underlying the therapeutic efficacy of the KD+Fulv combination, establishing its potential as an adjuvant therapy for metastatic breast cancer. By combining this dietary intervention with standard endocrine therapy, we exploited the metabolic dependencies of metastatic cancer cells to achieve sustained therapeutic responses in mouse models.
Our previous work showed that breast cancer liver metastatic cells have more activity in pathways associated with glucose metabolism and glycogen deposition than normal hepatocytes29. We found that the ketogenic diet not only slowed cancer progression but also revealed diet-associated molecular mechanisms underlying Fulv resistance, particularly the interplay between glucose, palmitic acid, and β-OHB. These findings suggest that combining ER-targeted therapy with ketogenic diet intervention can remodel metabolic pathways within the metastatic niche, leading to the accumulation of ketone bodies, ultimately promoting cell death and enhancing the effectiveness of endocrine therapy.
Cancer cells exhibit metabolic plasticity, allowing them to sustain their energy and building block requirements for continuous proliferation and adapt to new environments during metastasis. To meet these demands, cancer cells display elevated metabolic activity, resulting in reprogrammed glucose, amino acid, and lipid metabolism. A hallmark of cancer cell metabolism is the Warburg effect, characterized by increased glucose uptake and glycolysis, even under aerobic conditions39. This aberrant metabolism results in lactate accumulation, which promotes cancer cell growth and survival. Our previous results demonstrated that Fulv treatment enhanced glucose metabolism in liver metastatic tumors by increasing glycolysis and glycogenesis pathway activity. Stable isotope labeling experiments confirmed these changes, and further showed that Fulv stimulated citrate production, aspartate-malate shuttles, and alanine metabolism pathways. Notably, while the ketogenic diet alone did not block these pathways, the KD+Fulv combination effectively inhibited glucose flux through these pathways in vivo.
Fulv also stimulated lipid metabolism in liver metastatic tumors by upregulating genes involved in mitochondrial biogenesis, fatty acid oxidation, and ketogenesis pathways. During lipolysis, fatty acids, including palmitic acid, are produced and metabolized into acetoacetate, which is subsequently converted into β-OHB and acetone. β-OHB, the predominant ketone body generated from hepatic β-oxidation, can replace glucose as the primary energy source22. Fulv downregulates OXCT1 expression, potentially leading to β-OHB accumulation due to increased fatty acid catabolism. The ketogenic diet further elevated β-OHB levels in both plasma and tumors compared to control and Fulv-only groups, contributing to reduced breast cancer cell viability. Notably, a recent study demonstrated that β-OHB interaction with the surface receptor Hcar2 induces the transcriptional regulator Hopx, triggering gene expression changes that inhibit intestinal tumor growth40.
An important open question is how ketogenic diet-mediated metabolic reprogramming may impact special subtypes of breast cancer, most notably invasive lobular carcinoma (ILC). Comprising 10–15% of breast cancers, ILC is relatively metabolically quiescent compared to those of no special type (NST)41. ILC shows differential gene expression relative to NST consistent with reduced glycolysis, but increased reliance on oxidative phosphorylation, TCA cycle metabolites, lipids, and amino acid metabolism42,43,44,45. The molecular mechanisms by which the ketogenic diet enhances lipid metabolism and ketogenesis may or may not differ within a cellular context of decreased reliance on glucose metabolism. Future studies to address this will be important.
In conclusion, our findings establish that combining dietary interventions with endocrine therapies represents a promising therapeutic strategy for metastatic breast cancer patients, paving the way for future preclinical and clinical studies. This significant advancement in cancer research opens new avenues for developing innovative treatment approaches, particularly for ER+ breast cancer liver metastasis.

Responses