Coevolution of network and attitudes under competing propaganda machines

Introduction
Social identity divisions are fundamental to human psychology and society1. Even membership in an artificial group with minimal distinguishing characteristics leads to a wide gamut of socially relevant biases that favor that group2. Contemporary political divisions between liberalism and conservatism are a particularly important societal embodiment of this deep-seated psychological phenomenon.
An a priori non-political topic can be easily politicized, i.e., subsumed by the existing political identities and divisions3. Upon such politicization, opinion change no longer results from thoughtful discussion and factual information exchange – instead, it arises from political mechanisms of social influence such as moral emotional language4,5,6 and microtargeting7. Since any political discussion is heavily influenced by the existing social identity divisions, such discourse can lead to polarization of opinion in line with these divisions8,9. An instance of this phenomenon that looms large in recent history is the polarization of the American society over the country’s involvement in the Vietnam war10. Polarization along political lines is evident in the positions of the U.S. senators11 and the statements of news media sources12. However, the extent and the mechanisms of the media’s polarizing influence on the general public remain unclear13.
An important recent example is the politicization of the debate about the validity of the COVID-19 (or, simply, COVID) vaccine. The political machinery of the United States has been particularly efficient and opportunistic at subsuming this discussion, so that decision-making and opinion formation with regard to this topic entangle with political agendas and ideologies14. Science and medicine are generally susceptible to politicization, as their authority weakens due to fiscal steering, political control and the accompanying adaptation to utilitarian performance indicators15,16,17. The unique feature of the COVID vaccination debate is that this particular topic went from relatively un-politicized to very politicized virtually overnight18.
In this paper, we introduce a theoretical model of group opinion formation that is specifically motivated by the observed dynamics of opinion formation among 100 million Facebook users that discussed the safety and efficacy of the COVID vaccine between December 2019 and August 2020. We then present a theoretical exploration of this model’s behavior that contributes to a general understanding of online discussions on quickly politicized topics. The article’s focus is to present opinion distribution outcomes such as polarization as a function of the model’s parameters. Additionally, in our simulations we identify the political media entities that emerge as authorities and may subsequently be able to convince people to engage in certain actions.
The rest of this article has the following structure. We first present our model’s empirical context and list the model components that this context necessitates. We then provide a mathematical description of the model. Subsequently, we detail our investigation of the model’s behavior as a function of its parameters. In the course of this investigation, we focus on opinion distribution outcomes such as polarization and the political media entities that emerge as network authorities. Finally, we summarize and discuss the implications of our findings.
Results
Empirical context
The model’s foundation is a pre-pandemic 2019 Facebook network that was initially developed around vaccine distrust19. This network comprised 1356 interlinked Facebook pages (or, simply, pages) that were categorized as pro-vaccine, anti-vaccine, or neutral towards vaccines. Here, our empirical methodology closely follows an earlier study19, with further details provided in the Section S1 of the Supplementary Materials (SM). Each Facebook page in the network has a unique ID and serves as a space for users to gather around shared interests, which can promote trust within the community and potential distrust of external issues. These pages are manually and independently classified by trained researchers as pro-vaccine, anti-vaccine, or neutral. In cases of disagreement, the researchers discussed until reaching consensus. This classification process resulted in a network of 1356 interlinked Facebook pages across various countries and languages, with 86.7 million individuals in the largest network component. The classification breakdown was as follows: 211 pro-vaccine pages with 13.0 million individuals; 501 anti-vaccine pages with 7.5 million individuals; and 644 neutral pages with 66.2 million individuals. The neutral pages encompass communities primarily focused on non-vaccine topics, such as parenting, pets, alternative health, and lifestyle interests20. Qualitatively speaking, each pro-vaccine page exhibited an extremely pro-vaccine stance that did not alter with time and each anti-vaccine page exhibited a similarly staunchly anti-vaccine stance. Each neutral page exhibited a stance toward the vaccine that was initially somewhere between the two extremes and sometimes shifted with time. Almost none of the pages were removed during the period under analysis, and no pages were added. Whenever page A “liked” or “followed” page B, this relationship between the two pages was unlikely to change and we interpreted this relationship as a potential conduit of information. In the following, we refer to this relationship as simply “A follows B”.
We focus on a subset of the above-mentioned Facebook pages that discussed the COVID-19 vaccine between December 2019 and August 2020. Details regarding this subset can be found in an earlier publication20. Figure 1 shows certain key characteristics of this data: hundreds of Facebook pages in each of the three vaccination stance categories, an evolving network activity structure with prominent anti-vaccination and pro-vaccination clusters, rapid increases in both the pro-vaccine and the anti-vaccine contents around the March of 2020, significant variabilities in the number of followers and network authority, and the particularly high network authority among anti-vaccination pages. Figure 1a presents the numbers of pro-vaccination, anti-vaccination and neutral pages that posted content, as a function of time. Figure 1b shows the total number of posts from each page type versus time.

Red, blue and gold colors correspond to anti-vaccination, pro-vaccination and neutral pages and posts. a The number of pages of each type contributing to the discourse (or engagement diversity), versus time. b The volume of posts (or exposure level) for each page type, versus time. c The relationship between the Kleinberg authority score and the number of followers (or fans). d Network information flow. Each node corresponds to a Facebook page. An edge between two nodes corresponds to an active information conduit; although each edge is directed, we do not show the arrows for simplicity. Large figure on the left: active information conduits between December 2019 and August 2020. Four smaller figures on the right: active conduits during 10-day interval snapshots in 2020. The interval’s dates are above each snapshot, in the format XX/YY, which indicates day YY of month XX.
In Fig. 1c, for each page, we present two social influence measures that are based on the page’s position in the overall network pattern. The horizontal axis shows the number of pages that like or follow the focal page, the vertical axis shows the focal page’s Kleinberg authority score, computed from the above-mentioned network of “follow” relationships21,22. This score, developed specifically for the analysis of directed networks like reputation systems and the hyperlink structure of the internet, aims to identify pages that are authorities on a topic. Kleinberg’s algorithm assigns an authority score and a hub score to each page. In this framework, a high-authority page has many inbound links from pages with high hub scores and a page with a high hub score has many outbound links to high-authority pages. These measures can be viewed as dynamically emerging from the processes of offering and receiving endorsements. Although well-known metrics like eigenvector centrality also capture aspects of influence, we have chosen to use Kleinberg’s scores because our research focuses explicitly on directed hyperlink networks, where distinguishing between hubs and authorities is essential.
Figure 1d shows the patterns of COVID-related information flow between the Facebook pages. Here, a page shows up in a panel marked with a particular time period if that page posted COVID-related content during that time period. Furthermore, if pages A and B both posted such content and A followed B, our interpretation is that there was COVID-related information flow from B to A during this time, i.e., that the information conduit due to the “follow” relationship was active. We indicate such an active conduit by a link between A and B in Fig. 1d. The large image in the left portion of Fig. 1d shows the pages and the information conduits that were active at some point during the entire period between December 2019 and August 2020. The smaller images in the right portion of Fig. 1d show the pages and the information conduits that were active during shorter periods of time between these two dates. Consequently, this figure shows temporal changes in information flow.
Theoretical investigation of the processes that give rise to Fig. 1 requires that the corresponding model of the Facebook network includes several specific features. Some of these features are apparent upon the examination of Fig. 1, some – upon the consideration of the real-world processes that this figure represents. Another set of the necessary model features follows from the characteristics of the data that Fig. 1 does not display. In the following paragraphs, we motivate these necessary features, one at a time.
Although, in general, opinions are multi-dimensional and complex, their relevant dimensionality can decrease substantially in the case of politicized discussion. In particular, theoretical studies of political discourse predict a trend toward unidimensional opinions23. Political ideology, in turn, affects attitudes toward vaccines24,25. Correspondingly, studies of vaccine hesitancy have shown that correlations among answers in surveys regarding vaccine hesitancy reduce the survey results to a scale with only two dimensions26,27, or even to a single belief construct that is highly predictive of the hesitancy28. Additionally, existing models of opinion change in groups frequently assume one-dimensional opinions29,30,31 from the start, particularly in the context of political discussion32. In accordance with these empirical findings and theoretical developments, we adopt unidimensional opinions for our model. Throughout the text, we utilize the terms attitude and opinion interchangeably. Mathematically, in particular, “attitude” is analogous to “opinion” in opinion dynamics models33,34,35. We will model the dynamics of the attitude towards the COVID-19 vaccination, by which we mean an overall evaluation that a person holds toward the COVID-19 vaccine. This evaluation is shaped by personal beliefs, values, emotions, and past experiences, as well as by trust in scientific authorities, government agencies, or the healthcare system.
The Facebook pages that we classify as pro-vaccination or anti-vaccination show no changes in their stances over time. Accordingly, our model ought to represent such pages as a set of inflexible agents with extreme views. Several existing models explore the general effect of such inflexible agents on opinion dynamics36,37,38.
There is a considerable amount of circumstantial evidence for attitude polarization among the neutral pages, i.e., the movement of many neutral page attitudes toward the anti-vaccination extreme and of many other neutral page attitudes – toward the pro-vaccination extreme. Such evidence includes the rapid rise of the anti-vaccine content and the more gradual but substantial rise of the pro-vaccine content in Fig. 1a and b. We expect each type of extreme content to be pulling the attitudes of the neutral pages in its own direction, especially since the volume of each extreme content type exceeds the volume of neutral content. Another piece of evidence in favor of polarization – or, at least, of attitude movement toward the anti-vaccination extreme – is the fact that network authority scores tend to be larger for anti-vaccination pages than for other pages in Fig. 1c. In Fig. 1d we also observe that the anti-vaccination pages are bound into a tight informational cluster of their own, which, we expect, reinforces the extreme attitudes of these pages. The same can be said about the pro-vaccination pages, whereas the informational connections among the neutral pages are considerably less dense. Taken together, the above-mentioned circumstantial evidence indicates that our model ought to yield attitudinal polarization for a wide range of parameters.
Since the Facebook network we study does not exist in a social vacuum, its model should take into account factors that are external to the network, such as personal off-line experiences, news events and so on. A natural way to take these factors into account is via the introduction of random attitude change, which is rarely included in the existing models of group opinion formation. Nevertheless, at least one thorough study of this factor’s effect exists39.
The model’s network should evolve over time. This feature is necessary, since informational conduits activate and deactivate with time, according to the four-image temporal sequence on the right side of Fig. 1d. Furthermore, Fig. 1a shows that the number of active pages changes with time, which implies that the total number of active informational conduits is likely to alter with time as well. Thus, our model should include the possibility of changes in this number. There are many existing models with evolving network structure37,40,41,42,43, although in many of these the total number of informational connections is fixed.
Many of the active informational conduits in our data form within existing clusters of pages. Nevertheless, pages also frequently link to seemingly random sources outside their immediate networks. Such outside links include informational connections to news sites, neutral pages following other neutral pages with different interests, anti-vaccination pages following pro-vaccination pages, and so on. Accordingly, our model should include mechanisms for connecting both within and outside a page’s existing network.
Limits on tolerance toward dissimilar attitudes regarding vaccines are well-documented44,45,46, in contexts that include social media exchange47. General observations of tolerance limits48,49,50 have lead many existing models of one-dimensional opinion change to implement step-like tolerance thresholds31 – limits on the difference in attitude between a focal agent and its influencer agent beyond which the influencer does not alter the focal agent’s opinion. In accordance with these empirical observations and theoretical developments, our model should include this effect.
Figure 1c makes it apparent that some of the Facebook pages are more influential than others according to both the Kleinberg authority score and the number of followers. Influence of pages in the Facebook data also varies according to several other metrics, such as the number likes/followers at posting, volume of content and so on. Accordingly, our model should include a difference among the agents in the power to influence others.
Incorporating all the above-mentioned features requires a relatively high number of model parameters; however, this complexity is essential for a thorough analysis of the processes that likely shaped the online COVID vaccine debate. To maintain a manageable scope, the model should exclude any unnecessary features. While there are numerous agent-based models of attitude polarization, a review of recent representative studies35,51,52,53,54,55,56,57,58,59,60 reveals that none of the existing models possesses the exact combination of features needed to fully analyze our dataset. For instance, a general model of opinion dynamics61, despite its breadth, lacks the capability to account for varying levels of influence among agents. Similarly, an important study on zealots36 does not incorporate dynamic networks, and a widely cited model with one-dimensional opinions29 does not include network structure at all. Many other such limitations exist among current models, underscoring the need for a customized approach in this analysis.
Theoretical model
We construct an agent-based model of the processes indicated by Fig. 1. In this model, each agent represents a Facebook page, also referred to as a community. Red agents represent anti-vaccine pages, blue agents – pro-vaccine pages, and golden agents – neutral pages. We will sometimes refer to the blue and red agents collectively as political agents. At any given time, we assign a single attitude value to each page, i.e., each page acts as a coherent unit in the dynamical process of forming connections between pages. While this is superficially similar to how individuals are treated in agent-based models, we make no assumptions about an individual page acting like a human individual – just that the page acts as an indivisible entity in terms of having a single value for its attitude. This page-level compartmentalization in the model is based on the mechanisms that cause the attitudes of a page’s members to converge to a prevailing value on time scales that are shorter than the time scales of that prevailing attitude’s change. We observe these convergence mechanisms qualitatively in our data. They include the fact that all members of a given page are likely to be exposed to any new piece of page content at a similar time, as a result of the way that content gets highlighted on a page; as well as the fact that by becoming page members they have already signed up to sharing and hence being instantly exposed to the page’s content. This exposure dynamic can set up a positive feedback which reinforces the page’s members’ like-minded trust of each other, and hence their likely common and quick reaction to new information. Another qualitatively observed mechanism that is inherent in our assumption of compartmentalization is that the administrators of page A who post content from other pages choose the content that the members of page A would likely choose for themselves, in accordance with the page’s prevailing attitude.
In accordance with our justifications for the compartmentalization assumption, it is important to stress that our model does not capture, for example, either the within-page heterogeneity in individual members’ opinions that persists on the model’s time scales or the tendency of a page’s administrators to post content that the members of that page would not choose themselves. Operationally, modeling each page as a single agent lets us concentrate on macro-level opinion formation and network evolution.
Network structure
We represent our system as a directed graph. Here, a connection between agents A and B represents an active “follow” relationship, such as those indicated by links between pages in Fig. 1d. A golden agent can have both incoming and outgoing connections, representing who actively follows this agent and which other agents it actively follows. On the other hand, a red or a blue agent only has incoming connections, indicating that such an agent influences others but is not influenced itself. In our empirical data, only the static “follow” relationships can be activated as informational connections; however, we do not impose such a restriction on the theoretical model. We refer to the agents that a focal agent follows as its out-neighbors or simply its neighbors.
Attitude
Agent i’s attitude yi is a number between 0 and 1. This number represents the prevailing attitude of the community represented by this agent. In the context of the COVID debate, yi = 0 if agent i is entirely pro-vaccine, yi = 1 if agent i is entirely anti-vaccine, and yi = 0.5 if the agent is undecided with respect to the vaccine. The attitude of a blue agent is always zero, that of a red agent is always one, and the attitude of a golden agent is flexible, somewhere between these extremes. This corresponds to our empirical observation that pro-vaccine and anti-vaccine pages have constant, extreme stances, whereas the stances of neutral pages are generally changeable and intermediate.
Initial conditions
We initialize the attitudes and the links before the start of each simulation, as follows. The attitudes of the golden agents are drawn from a normal distribution with a mean of 0.5 and a standard deviation of 0.2, as in a previous model of opinion dynamics62. That model’s distribution is based on empirical distributions of individuals’ opinions. Here, we assume that the initial distribution of prevailing opinions among our neutral pages is similar to the distributions of individuals’ opinions in such empirical samples. The links among the golden agents are assigned randomly according to the Erdős-Rényi algorithm and the number of links is such that a particular golden agent has Ng/100 golden neighbors, on average. This amounts to a graph density of about 0.01. This is of the same order as the network density in the case of the Facebook pages that are involved in the vaccination debate. Initially, the red and blue agents have no neighbors. Thus, qualitatively speaking, each simulation begins with a network of golden agents that is both random and naïve, immediately before it is exposed to the competing political machines for the first time.
Reputation
Each agent possesses a reputation score, ri, which determines the probability of establishing or severing an in-link from another agent, as well as the probability of being socially influenced by this agent. Reputation ri grows linearly with the number of followers di (i.e., the in-degree or simply degree) and an additional, agent-specific parameter si, which we call size:
where a population-wide parameter λ measures the sensitivity of reputation to changes in di. In the context of the COVID debate, size can be thought of as the number of individuals who are members of the Facebook page represented by the agent, the amount of activity on the page, or the amount of attractive content on the page. The horizontal axis in our empirical Fig. 1c plots values of di that Facebook pages would have if all the information conduits were active.
Changes in connections
Agents can either establish new connections with other agents or sever existing ties. In the context of our COVID debate data, this corresponds to activation and de-activation of informational conduits. Agents tend to follow other agents who share similar attitudes and possess a high reputation and unfollow those with differing attitudes or a lower reputation. New connections are established in two ways: through exploration, i.e., by randomly selecting a new agent to follow from the entire population with probability ε, or through connective social influence, i.e., by connecting with the neighbors’ neighbors with probability 1 − ε. This connective social influence process is similar to how Facebook users, after following a page, see content from other pages that the followed page itself follows.
The probability ({w}_{ij}^{1}) of agent i connecting to agent j increases with agent j’s reputation rj but decreases with the absolute attitude difference between the agents, (Delta =leftvert {y}_{i}-{y}_{j}rightvert). Conversely, the probability ({w}_{ij}^{0}) of i disconnecting from j decreases with rj but increases with Δ. Specifically, we define these probabilities as
where f(Δ; c, σ) is an increasing, S-shaped function of Δ; we refer to c and σ as the “tolerance limit” and “smoothness” parameters. The tolerance limit specifies the approximate attitude difference between a focal agent and a potential influencer beyond which the two agents are unlikely to establish or maintain a connection. Quantitatively, the probability of connection or disconnection reaches half its maximum value when the attitude difference equals c. For connecting, we use limit c1; for disconnecting, c0. The smoothness shows how quickly these probabilities vary with changes in Δ. A smaller σ creates a more abrupt change, while a larger σ leads to a gradual shift. The smoothness parameter σ is the same for both processes. Section S2.1 and Fig. S1 in the SM describe the technical definition of c and σ – they are the pre-truncation mean and standard deviation of a normal distribution whose c.d.f. is the S-shaped probability function.
Changes in attitudes
Golden agents can modify their attitudes either randomly (with probability μ) or by aligning them closer to a neighbor’s perspective (with probability 1 − μ). We categorize the former type of attitude adjustment as mutation and the latter as attitudinal social influence. The attitude shift due to social influence increases with the disparity between the attitudes of the influenced agent i and the influencer j, according to:
where ({y}_{i}^{{prime} }) is the attitude of agent i after the shift and yi is its attitude before the shift. Here, we assume that the attitude of each member on page i changes in accordance with the difference in the prevailing attitudes between pages i and j, the same way that in a previous model30 the attitude of individual i changes in accordance with the difference between individuals i and j. The magnitude of the shift, (| {y}_{i}^{{prime} }-{y}_{i}|), is inversely related to the focal agent’s size, si, reflecting the possibility that pages with more members on platforms like Facebook might exhibit more resistance to change. Symbol δ corresponds to one of three different parameters – α, β or γ – which measure the strengths of social influence for blue, red and golden agents, respectively.
Network evolution
To study our model, we use event-driven simulations, as follows. We randomly choose a focal golden agent, then choose an event that changes either that agent’s attitude or its links. With probability ν1, the agent connects to a new neighbor; with probability ν0, it disconnects from an existing neighbor. If the agent is connecting, with probability ε the new neighbor is chosen at random, otherwise the only candidates for a new connection are neighbors of neighbors. If the agent is not connecting or disconnecting, it changes its attitude. That change is random with probability μ. Otherwise, the change is due to a neighbor’s social influence. We refer to ν = ν1 + ν0 as the rewiring rate, to 1 − (ν1 + ν0) as the rate of attitude change, to ε as the exploration rate, and to μ as the mutation rate. Once the event occurs, the simulation moves on to the next random focal agent and the next event.
Table 1 summarizes all the mathematical symbols that we employ. Section S2 contains additional details of the model’s numerical implementation.
Long-term behavior
To characterize the model’s long-term behavior, we run simulations on networks with Ng = 500 golden agents across various parameter combinations (see Table S1), with 50 independent runs for each combination. Each run lasts 1000 time units, with each golden agent experiencing one event per time unit on average. Assuming one interaction per agent per day, this corresponds to about three years. We analyze the attitude distribution at the final time step of each run.
Extensive numerical simulations identify 3 common long-term regimes. We call these “prototypical” regimes neutrality, consensus and polarization. Figure 2 illustrates these regimes, one in each of the figure’s columns. The first row of graphs in this figure – Fig. 2a–c – shows the distribution of attitudes versus time. The second row – Fig. 2d–f – shows the final network graphs. The third row – Fig. 2g–i – shows the agents’ Kleinberg authority scores21, as well as the hub scores for the golden agents, versus time. Since the red and blue agents do not have any outgoing links, their hub scores are always zero. The authority score, a number between 0 and 1, measures an agent’s informational influence due to its position within the network. Our authority scores are normalized so that the sum of their squares is one, in accordance with a common convention22. The hub scores are similarly normalized. Our implementation of this measure adjusts for different sizes of components on a disconnected graph (see Section S3 in the Supplementary Materials). The fourth row in Fig. 2j–l – plots the authority scores at the end of the simulation versus agent size.
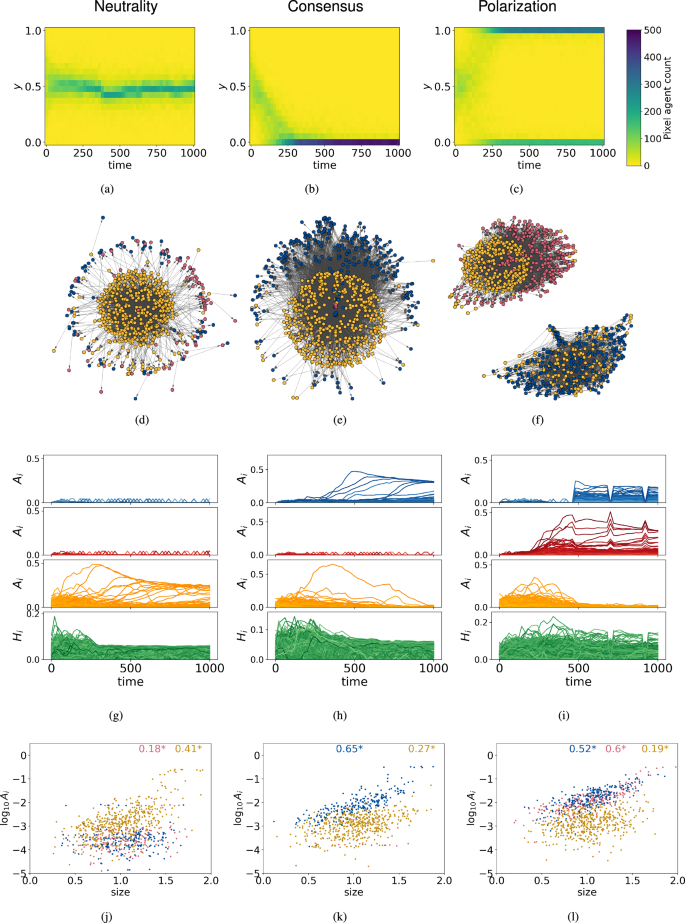
Left to right: neutrality under α = β = 0 and c1 = 1; consensus under α = 0.2, β = 0 and c1 = 1; uneven polarization under α = β = 0.2 and c1 = 0.5. The remaining parameters for all realizations are λ = 0.01, ν0 = ν1 = 0.1, ε = 0.5, μ = 0.05, c0 = 0.3, ({log }_{10}sigma =-1) and Ng = 500. Top to bottom: attitude distributions over time, final network graphs (we exclude components with less than 6 agents), authority scores Ai and hub scores Hi over time (darker lines correspond to larger agent size), logarithmic mean authority score over the last 10% of time steps vs. size (we exclude scores below -5; colored number is Kendall’s tau, a star signifies its significance at p = 0.05).
We define neutrality as a unimodal attitude distribution whose mode is near 0.5. Figure 2a illustrates this definition. Under neutrality, there are many connections among the golden agents and relatively few connections to the red and blue agents. This results in the patterns that we observe in the remainder of the left column in Fig. 2. Specifically, golden agents in the network structure of Fig. 2d clump together and the authority scores of these agents are relatively high in Fig. 2g, j, all because of the dense gold-to-gold connections.
We define consensus as a unimodal attitude distribution whose mode is near 0 or 1. In Fig. 2b, we see a final attitude distribution that falls under this definition. Under consensus, the dominant type of connection is from the golden agents to the political agents on the winning side (blue agents in the middle column of Fig. 2). We readily observe the dominance of this connection type in Fig. 2e; this dominance results in the fact that the winning political agents in Fig. 2h, k have the highest authority scores, the golden agents have intermediate scores and the losing political agents have the lowest scores.
We define polarization as a multi-modal attitude distribution. When the variance of such a distribution is above 0.25, we say that the polarization is complete. When the variance is below 0.25, the polarization is partial. Figure 2c illustrates complete polarization and Fig. 2f shows a typical network structure under these conditions. In this structure, most of the golden agents fall in two separate connected components – those that are connected to the red agents and those that are connected to the blue agents. Figure 2i, l show that this results in blue and red agent authority scores that are both relatively high and comparable to each other.
Generalized regimes
The simulation realizations in Fig. 2 can be categorized according to the prototypical long-term regimes fairly unambiguously. However, many of the simulations in this article end up with attitude distributions that are not so easily categorized. Thus, we need a way to quantify the proximity of a simulation realization to each of the prototypical regimes, given the realization’s attitude distribution at the end. For this purpose, we use three summary statistics: the mean (bar{y}), the standard deviation σy and the Hartigans’ p-value pH.
The Hartigans’ p-value, due to the Hartigans’ dip test63, is a measure of the distribution’s uni-modality. A significantly multi-modal distribution corresponds to pH near zero, whereas a distribution that does not significantly deviate from uni-modality corresponds to pH that is appreciably greater than zero. Section S4 in the Supplementary Materials examines some ways in which pH depends on the shape of the distribution.
Qualitatively, the three summary statistics determine the proximity to a prototypical long-term regime, as follows. If σy is small and pH is appreciably non-zero, the long-term regime is either neutrality if (bar{y}) is close to 0.5 or consensus if (bar{y}) is close to 0 or 1. On the other hand, when σy is large and pH ≈ 0, the regime is polarization. In this case, if (bar{y}) is close to 0 or 1, mode sizes are likely unequal. A combination of small σy and pH ≈ 0 is likely partial polarization.
In Section S5 of the Supplementary Materials, we describe a way to map the three summary statistics to the three components of the additive RGB color scheme. This assignment of colors allows one to gauge the proximity of a simulation realization to each of the prototypical long-term regimes based on the color that is assigned to the realization’s final attitude distribution.
Effects of parameters
We wish to investigate how an initially neutral network of golden agents responds to the polarizing influence of red and blue propaganda. Parameters α and β capture the strength of that influence, whereas the remaining model parameters largely capture the rules according to which the golden agents behave. Accordingly, we set up a 3 × 3 grid of α and β and, one-by-one, vary the remaining parameters within every grid square. The resulting variation in the model’s behavior tells us how each parameter of societal interaction affects the outcome of the online debate under different conditions.
Table S1 provides a more detailed description of this parameter variation. It mentions that we set the connection and disconnection rates equal to each other and thus vary ν = 2ν0 = 2ν1. We also do not vary sg, the average size of the golden agents.
Connection tolerance limits c
1 and c
0
Figure 3 displays the distribution of long-term regimes as we vary connection tolerance limit c1 in the different squares of the propaganda grid. When c1 is appreciably less than 0.5 in Fig. 3, the population is often partially polarized: its final attitude distribution is multi-modal yet narrow. This can mean, for example, that most golden agents are neutral with attitudes near y = 0.5, but there is a minority near one of the extreme attitude values. Around c1 = 0.5 and large propaganda strengths α = β = 0.2, simulation realizations reach full, uneven polarization. Here, the intermediate tolerance threshold for new connections enables the red agents to influence about one half of the attitude range while the blue agents influence the other half. As c1 continues to increase past about 0.6, polarized realizations disappear and the simulation repeats are evenly split between neutrality, “red” consensus and “blue” consensus realizations.
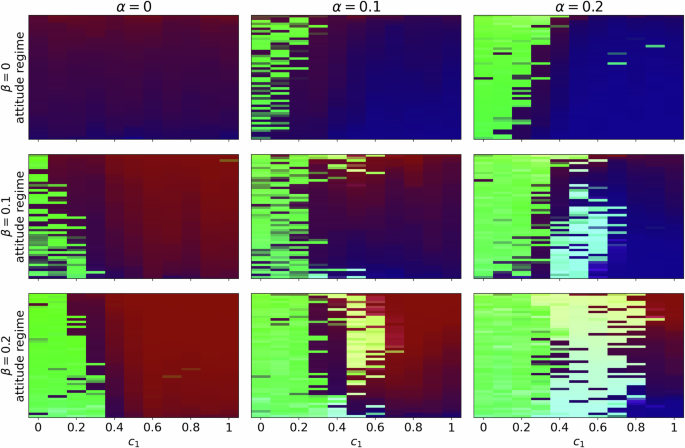
At every parameter combination, there is a column of 50 pixels, each corresponding to a random repeat of the simulation. Dark-purple pixels correspond to neutrality, dark-red and dark-blue pixels — to consensus. Light-yellow pixels correspond to uneven polarization with the larger mode near y = 1, aquamarine pixels — to uneven polarization with the larger mode near y = 0. Green pixels correspond to partial polarization — a multi-modal distribution with low standard deviation. SM Section S5 describes this color scheme in more detail. Pixel ordering from top to bottom is from highest to lowest (bar{y}).
Figures S11 and S13 allow us to compare Fig. 3 with the analogous diagrams for the other two model parameters that control the attitude difference range for the formation and dissolution of connections – the tolerance limit for staying connected c0 and the smoothness of tolerance thresholds σ. According to that analysis, in general, as agents tolerate having neighbors with increasingly different attitudes, the most probable societal outcome transitions from neutrality to partial polarization to more complete polarization to consensus. An intuitive explanation of these transitions is the fact that, as tolerance of others’ opinions increases, political agents can connect to golden agents across larger portions of the attitude spectrum and pull these golden agents’ attitudes toward the extremes.
In Fig. 4, we plot the number of political authorities, i.e., agents whose Kleinberg authority score21 (see the Empirical Context Section, as well as Section S3 in the SM, for descriptions of this measure) is at least 0.22 at the end of the simulation, for the realizations in Fig. 3. This authority score threshold corresponds to a maximum of 20 such agents. We show this number for each agent type separately. Here, we do not report hubs: for the red and blue agents, hub scores are always zero; among golden agents, there are rarely any outstanding hubs. Comparing the two figures at α = β = 0.2, we see that, as c1 increases past 0.3 and polarization becomes complete, the number of political authorities increases and the number of golden authorities decreases. As c1 increases past 0.8 and the simulation transitions to the regime with a high probability of consensus, this pattern reverses itself to some degree. In other words, the number of political authorities decreases and the number of golden authorities increases – although the former remains appreciably above zero. Given that a larger number of political agents with high Kleinberg authority scores is associated with fuller polarization or a considerable probability of consensus, it appears that this measure of authority due to an agent’s placement in the network effectively captures an agent’s level of influence in our model.
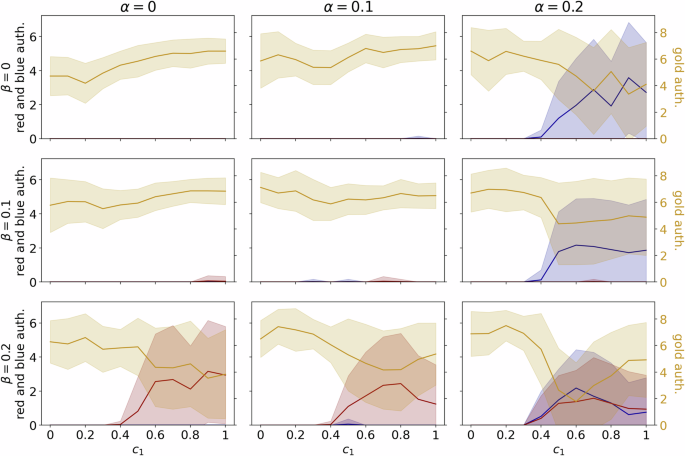
The vertical axis is the number of agents whose authority scores is at least 0.22, averaged over all repeats at a given parameter combination. Lines indicate averages over repeats, shading indicates standard deviations over repeats. Color indicates agent type. The left vertical axis corresponds to red and blue agents, the right vertical axis — to golden agents.
Qualitatively, based on the attitude distribution time series in Fig. 2a–c and observations from similar time series across various model parameters, attitudes in Fig. 3 reach an equilibrium by the end of each simulation. However, Fig. 2g–i suggest that the final authority counts in Fig. 4 may still be transient at that point. Thus, the large standard deviations in Fig. 4 likely stem from both this transience and the stochastic nature of the model.
Figure 5 plots the sizes of the two largest network graph components for the realizations in Figs. 3 and 4, in proportion to the total number of agents. Here, a graph component is a weakly connected component in a directed graph. That is to say, agents A and B are within the same component if and only if there is at least one path between A to B, one that could start either at A or at B. Figure 5 shows that the largest component is generally much larger than the second-largest component, even in the case of polarization. The ratio of the two components is similar to that in the empirical data that provides the motivation for our model (Fig. 1d).
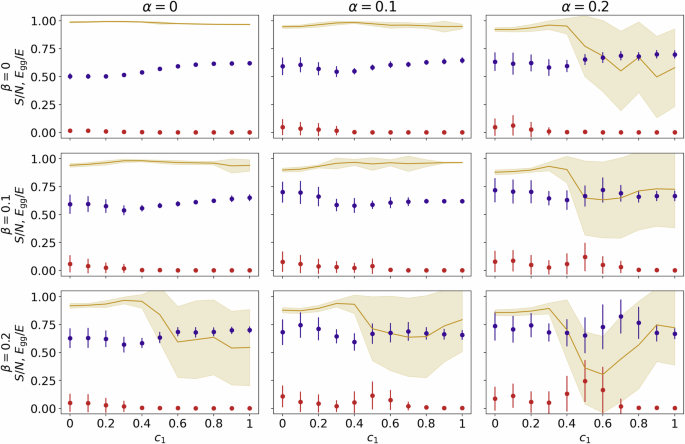
Gold line shows the average ratio of the gold-to-gold edge count Egg to the total number of edges E. Error bars and shading indicate standard deviations over repeats.
Comparison of Figs. 5 and 3 is particularly interesting at α = β = 0.2 and intermediate c1, where Fig. 3 shows a high probability of full, though frequently uneven, polarization. At these parameter values, the largest component generally contains a combination of golden agents and political agents of one color, whereas the second-largest component is composed of golden agents and political agents of the other color – which is what we see in the rightmost panel of the second row in Fig. 2. The polarization-producing parameter values show a relatively populous second-largest component and a relatively high variation in the sizes of the two largest components.
Figure 5 also plots the ratio of the number of connections among golden agents to the total number of connections. Here, smaller and more variable values of this statistic are associated with c1 > 0.4 and large α or β. At these parameter combinations, according to Fig. 3, the political agents exert powerful influence to bring about either full consensus or full polarization. Not surprisingly, this is associated with a decrease in the proportion of connections among the golden agents, which corresponds to an increase in the proportion of connections to the red and blue agents. The proportion of connections among the golden agents is the first term of Newman’s modularity measure Q[64, Eq. 5], applied to the question of how closely the network’s clustering follows the partitioning between the golden agents and the political agents.
Scaling of reputation with degree, λ
In Fig. 6, we continue to show the dependence of long-term regimes on the model parameters as they are varied according to Table S1. This time, the bifurcation parameter is the scaling of agent reputation with degree, λ. As λ increases at large propaganda efficiency, the model’s behavior transitions from relatively complete to relatively incomplete polarization to relative neutrality. We can understand this if we consider the simulation’s initial conditions – a neutral attitude distribution and a random connection network among the golden agents, in combination with zero connections to the propaganda agents. High λ increases the initial reputations of the golden agents and helps them stick together, both in terms of links and in terms of attitudes. At lower λ, this effect is weaker and the propaganda agents can pull the golden agents apart.
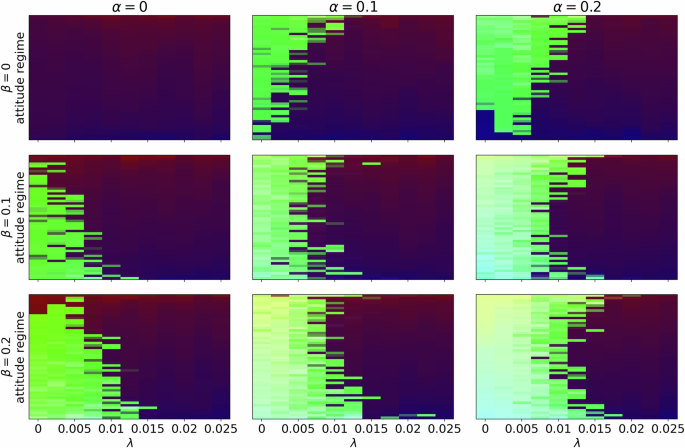
Information display style follows that of Fig. 3.
Event rates μ, ν and ε
The effect of the variation in mutation rate μ is presented in Fig. 7. When μ = 0, all attitude change is due to social influence. Under these conditions and our other model parameters, most golden agents converge to y = 0.5 and stay there most of the time. However, even a small increase in μ substantially increases the probability of polarization, especially at large α and β. Mutation helps the golden agents’ attitudes break away from y = 0.5 and thus become closer to the extreme attitudes of the propaganda agents. This, in turn, allows the propaganda agents to connect to the golden agents and to draw the golden agents’ attitudes further toward the extremes. When the mutation rate keeps increasing under relatively low propaganda efficiency, the political agents can’t hold on to the golden agents’ attitudes against random change, and the attitude distribution becomes uniform. When μ = 1 and thus all attitude change is due to random mutation, the fact that the size of the population is finite causes about half of the simulation realizations appear to be bimodal and about half – unimodal.
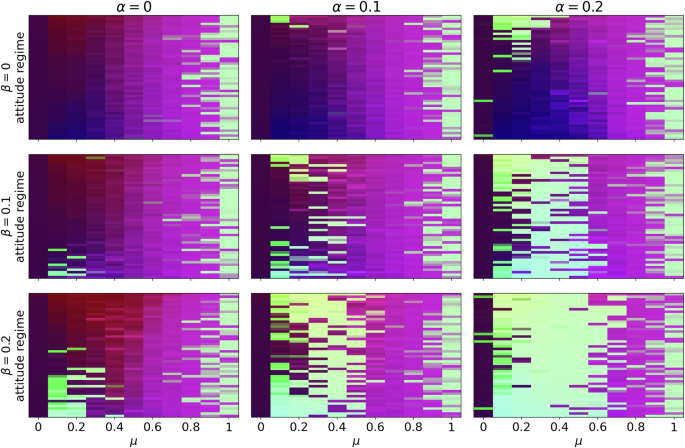
Magenta color indicates a distribution that is close to uniform. General information display style follows that of Fig. 3.
Section S6.3 details the model’s behavior as a function of the remaining event rate parameters. A low, non-zero rewiring rate ν promotes polarization – much like low μ, though for somewhat different reasons. Non-zero ν is necessary so that golden agents connect to political agents at all. Once these connections form, a relatively high rate of attitude change allows the political agents to pull the attitudes of the golden agents into the opposing camps. This, in turn, increases the connections to the political agents even more, while not allowing many connections among the golden agents to form. On the other hand, a relatively high rewiring rate makes the gold-to-gold network more densely connected from the start, since initially the attitudes of these agents are close to each other. This prevents the political agents from pulling the attitudes of the golden agents apart. In other words, when ν is high, attitude change is too infrequent for the political agents to efficiently pull on the neutral golden agent attitude distribution, before the golden agents interconnect so densely that this split becomes impossible to accomplish. Low connection exploration rate ε similarly hinders the ability of the political agents to pull on the attitude distribution, thus helping prevent full polarization.
Discussion
In this article, we aim to contribute to the understanding of online debates on rapidly politicized topics via theoretical analysis. Our starting point is a set of data that tracks the behavior of several hundred Facebook pages in the course of the online debate with regard to the safety and efficacy of the COVID-19 vaccine. The data includes the content that these pages displayed between December 2019 and August 2020, as well as the “following” and “liking” relationships among the pages during that time.
We construct a theoretical model that incorporates many of the features that are relevant to this empirical context, while excluding any elements that are unnecessary for this scenario. At the core of our model is a network of agents, each representing a Facebook page from the COVID-19 data set. Each agent’s attitude on the topic is represented by a value between 0 and 1. There are three types of agents in the model. Blue agents, with attitudes fixed at 0, represent pro-vaccination media or special interest pages. Red agents, with attitudes fixed at 1, represent anti-vaccination media or special interest pages. Golden agents, representing information-seeking pages (such as those focused on parenting or pets), have opinions that can change over time. As time passes, each golden agent changes the network neighbors from which it receives its information. These neighbors can be agents of any type. Each golden agent also updates its attitude over time, based on the information that it receives from its neighbors. The model includes randomness in both opinion change and network re-wiring, which corresponds to processes that the model does not otherwise take into account. We decided to treat each page as a single entity for connections and opinions, thus omitting intra-page dynamics. This decision was due to our empirical context’s qualitatively observed mechanisms that lead to quick convergence of members’ opinions on a given page and to subsequent content exposure that is based on the prevailing opinion values of other pages.
We aim to understand how the parameters of our model influence societal outcomes. We focus on three prototypical outcomes: neutrality, consensus, and polarization, each defined by the final distribution of attitudes. Neutrality is characterized by a unimodal distribution with opinions clustered around moderate values. Consensus is also a unimodal distribution but with most opinions concentrated at one of the extremes. Polarization, on the other hand, is identified by a multimodal distribution. We further distinguish between complete polarization, marked by a large variance in opinions, and incomplete polarization, which exhibits a smaller variance. Given the highly stochastic nature of our model, each parameter combination can lead to a variety of outcomes. Nonetheless, the model’s behavior shifts in clearly identifiable ways as we alter the parameters.
We now highlight some of the model’s predictions. Polarization is associated with high propaganda strength on both sides of the political divide and political agents that produce a lot of attractive content. Each of these conditions increases the tendency of the blue and red agents to attract the golden agents’ connections and pull the golden attitudes toward the extremes. An intermediate connection tolerance threshold can aid polarization as well, as it allows the two propaganda camps to divvy up the entire initially neutral distribution of golden agents’ opinions.
In our simulations, golden agents start off somewhat connected amongst each other and disconnected from the blue and red agents. Additionally, the golden agents’ initial opinions are similar to each other’s and are far away from the extremes. Two of the model’s parameters can help polarization in ways that rely on these initial conditions. Specifically, low scaling of reputation with degree prevents the interconnected golden agents from sticking to each other and maintaining their neutral opinions against the polarizing influences of the political agents. Similarly, a low rewiring rate prevents the golden agents from forming a denser network amongst themselves before the polarizing influences take hold.
Increases in the two kinds of randomness affect polarization in the opposite directions. Random opinion change decreases polarization, because it enables the golden agents to escape the political agents’ grip. On the other hand, when the golden agents connect to random sources as opposed to exclusively friends of friends, they forgo the chance to strengthen the gold-to-gold network and run the risk of connecting to the polarizing political agents instead.
One can understand the conditions that favor consensus via logic that is similar to that which works for polarization. For instance, high propaganda strength on one side of the political divide helps the political agents on that side draw the public’s opinions. A high connection tolerance limit or a gradual tolerance threshold allow these political agents to sway the flexible agents from across the opinion range. Random connections on part of the golden agents increase the probability of connecting to the political agents in the more powerful propaganda camp, which helps the latter bring the golden agents to consensus.
Final attitude distributions in our simulations correspond intuitively to the final network connection patterns. In particular, polarization is associated with a split of the network graph into two components. Additionally, both consensus and polarization are associated with high Kleinberg authority scores among the red and blue agents and low scores among the golden agents.
No unifying theoretical model of opinion dynamics can exist, due to the general complexity of these processes. Accordingly, each empirical context calls for its own combination of model components. Our model combines the components that are necessary for a detailed understanding of the COVID vaccine discussion on Facebook. For example, the model includes an effect of a page’s reputation and size on its ability to exert influence, which is likely in the context of politicized discussion. Furthermore, the qualitative features of the model’s network structure are specific to Facebook and the COVID debate. Applicability of this model to a different empirical context potentially requires the removal, addition, or modification of model components. For instance, a different topic may empirically exhibit multi-dimensional opinions, in combination with a lack of any limits on tolerance toward differences in such opinions. Discussion on a different social media platform may be associated with a different initial attitude distribution or a different network density. However, our experience with similar data on other platforms suggests that the essential structure of the model can also apply to other platforms.
Similarly to our model, we tailored our analysis to include several features that are new to this context and may not be applicable to other cases of opinion formation. These features include the tracking of Kleinberg hub and authority scores, which are particularly well-suited for characterizing the structure of informational authorities on directed hyperlink networks; as well as bifurcation diagrams that explore variation in many parameters.
While some of our findings align with intuitive expectations or resemble conclusions from prior theoretical work, our analysis captures dynamic behaviors that are not always obvious or predictable. The extent of similarity with existing findings depends on the structural parallels to prior models. Table 2 provides a comprehensive summary of our model’s predictions, expanding on the insights presented in this section. Since our model is specific to discussions such as the Facebook COVID debate, so are the detailed predictions in Table 2. Prior to this work, there was no theoretical investigation that was simultaneously equally thorough and equally specific to this empirical context.
Although, in some cases, attitude fragmentation can enhance the quality of collective decision-making, politicization of the vaccine discussion and the subsequent polarization of attitude does not lead to a positive outcome of this sort. On the contrary, polarization in the context of the COVID vaccine debate leads to animosity, counter-productive disagreement and higher costs of the societal response to the epidemic.
Accordingly, we have identified the conditions under which, given our specific empirical context, opposing propaganda machines are less likely to split an initially neutral online community into separate camps. Some of these conditions are both intuitive and unlikely to be under anyone’s control. For example, a split is more likely when the politically motivated media entities have a large amount of attractive content that appeals to followers and helps alter these followers’ opinions. There may not be a way to effectively reduce this informational production capacity.
Other conditions that lead to a less polarized populace are more feasible, though not necessarily rapid, to implement. Previous attempts to mitigate polarization on Facebook and other social media platforms, such as information banners and content moderation, have shown limited effectiveness65. Our theoretical model provides new insights into the underlying dynamics of opinion formation and network structure, thus potentially paving the way for systemic changes that could yield better results. For example, we showed that an intermediate tolerance limit for new connections is particularly conducive to full polarization, because it allows the political agents to split the populace in two and attract the two portions to the extremes. When the tolerance limit is low, golden agents form two or more interconnected clusters with cluster-specific opinions, thus leading to partial polarization. Therefore, social media administrators who wish to mitigate polarization during periods of heightened political tension may want to design algorithms and nudges that expose individuals to a diverse range of perspectives across the political spectrum, thus helping society avoid the pitfalls of similarity preference. In practice, this approach could involve redesigning recommendation algorithms to prioritize content diversity over engagement metrics.
A result that is particularly counter-intuitive is that a higher network re-wiring rate tends to prevent polarization, by increasing the connectivity among the flexible agents before the propaganda machines can pull their attitudes apart. Consequently, social media may wish to apply policies and nudges that encourage users to consider many different sources before solidifying or changing their existing views. For example, social media moderators could periodically suggest new connections outside users’ typical networks or create temporary discussion groups on specific topics that bring together users with diverse viewpoints66.
We also showed that polarization is less likely when agents’ opinions change randomly. This finding might form a basis for several real-world interventions. For instance, a social media company might encourage its users not to rely exclusively on the content of its pages to form opinions. Such a company might suggest other sources – both online and in the real world – where the users might seek information.
In addition to suggesting the policies and nudges that can help prevent political polarization at times of politicization, we showed that several measures of network structure and connectivity can help diagnose the outcome of a debate even when there is no data on agents’ opinions. In particular, and in accordance with the intuition of Fig. 1d, our analysis suggests that a sizeable second-largest network component and politically motivated entities with large Kleinberg authority scores frequently co-occur and indicate the onset of political polarization in online communities.
Future theoretical and empirical work should address in greater detail the dynamic relationship between attitude distributions and emergent network authorities, whose structure can be assessed via the Kleinberg hub and authority scores. Figures 2 and 4 suggest some of the directions that such investigation might take. For instance, in the left column of Fig. 2, golden agents appear to go through at least three distinct stages with the passage of time: (1) an absence of high authority scores and a wide attitude distribution; (2) the appearance of one or two golden agents with higher authority scores, a decrease in the upper bound on hub scores, and a tightening of the attitude distribution; and (3) the appearance of additional high-authority golden agents with an even narrower attitude distribution. Here, one might ask, does the robustness of the neutrality outcome increase with the number of high-authority golden agents? Does this robustness increase or decrease with tighter connectivity among such agents? With regard to the authority score distribution, blue agents go through a similar evolutionary trajectory in the middle column of Fig. 2. In this type of development, how do the distribution of authority scores and the patterns of connections among high-authority agents affect the robustness of the consensus outcome?
We hope that this work encourages careful consideration in the design of social media networks. In the event of an unforeseen crisis, such as COVID-19, the societal aftermath is heavily influenced by the established parameters of social media interaction. Once a crisis is underway, these parameters may not change quickly enough, even with the implementation of the most strategic and well-informed policies. However, if the right parameters are fostered in advance, social media can drive constructive — rather than destructive — societal outcomes during periods of rapid politicization.


Responses