Comparative study of gravity effects in directional solidification of Al-3.5 wt.% Si and Al-10 wt.% Cu alloys

Introduction
Solidification is the phase transformation process that most metallic materials or alloys must undergo during formation. Since the emergence of classical nucleation theory in the 1960s, numerous solidification theories and technologies have been developed1,2. Among these, the directional solidification process has not only become an important means of preparing high-performance alloys but also a crucial tool for studying the solidification theories of metals due to its ability to control the temperature gradient and solidification rate independently3. During the directional solidification of alloys, the temperature gradient and concentration gradient in the melt result in density differences across different regions of the melt. Under conventional ground conditions, the presence of the gravitational field causes relative flow in the melt, known as thermal convection and solute convection, collectively referred to as thermosolutal convection or buoyancy convection4. Thermosolutal convection interferes with heat and mass transfer processes in the melt, thus affecting the microstructure and compositional distribution of alloys. Examples include the freckles in Ni-based single-crystal superalloys5,6 and macrosegregation in direct-chill-cast aluminum alloys7,8, etc. While under microgravity conditions, gravity-induced phenomena, including thermosolutal convection, sedimentation, and hydrostatic pressure, are basically eliminated or significantly suppressed, enabling the solidification process to be controlled almost by pure diffusion9,10. Therefore, it is necessary to take advantage of space or simulated microgravity environments to gain a deeper understanding of the impact of gravity on the directional solidification process.
The binary hypoeutectic Al-based alloy system serves as an excellent model for studying gravitational effects during directional solidification because of its low melting point, making it particularly suitable for use in microgravity environments with limited heating capacity, such as sounding rockets and space stations. Moreover, its relatively simple chemical composition and solidification process make it highly suitable for collecting benchmark experimental data under pure diffusion conditions to guide and refine models11,12. Under directional solidification conditions, hypoeutectic Al-based alloys usually form columnar grains antiparallel to the direction of heat flow, but with appropriate local thermal and solute conditions, as well as the influence of nucleating particles, they may also transform into equiaxed grains. This process is known as the CET (Columnar to Equiaxed Transition)13,14. Both columnar and equiaxed grains consist of two microstructures: primary dendritic and secondary eutectic. Columnar grains contain one or more slender (high aspect ratio) primary dendrites with identical crystallographic orientation. In contrast, equiaxed grains contain only a single primary dendrite with approximately equal lengths in all directions. The secondary eutectic microstructure forms at lower temperatures from the liquid phase in the interdendritic regions and at grain boundaries, which is referred to as intragranular eutectic and intergranular eutectic, respectively. Due to solute redistribution during the solidification of the primary dendritic microstructure, there is generally a significant compositional difference between the secondary eutectic and the primary dendritic microstructures13. Dendritic and grain structures, as well as compositional segregation, are the primary research subjects of directional solidification in hypoeutectic Al-based alloys. In fact, these factors jointly determine the final performance of most industrially cast Al-based alloys15,16,17,18,19.
In recent years, extensive space-based directional solidification experiments on binary hypoeutectic Al-based alloys have been conducted. Cahoon20 et al. and Dupouy21 et al. conducted directional solidification experiments on Al-Cu alloys under microgravity conditions provided by sounding rocket and ESA space laboratory, respectively, both of which found that both the primary and secondary DAS in microgravity samples were larger than those in ground gravity samples; while Steinbach22 et al. carried out directional solidification experiments on Al-Si alloys using sounding rocket and found that the primary dendrite arm spacing increased but the secondary dendrite arm spacing decreased under microgravity condition. In addition, Dupouy14 et al. and Beckermann23 et al. investigated the CET phenomenon during the directional solidification of Al-Cu (4 wt.%) alloys with grain refiners and Al-Cu (4, 10, 18 wt.%) alloys without grain refiners at the ESA Space Laboratory and the International Space Station, respectively. The former found that the microgravity samples exhibited a quasi-equiaxed structure, while the gravity samples showed the occurrence of CET. The latter discovered that all microgravity samples presented a completely equiaxed structure, with CET also occurring in the gravity samples. On the other hand, Zimmermann24 et al. conducted directional solidification experiments on grain-refined Al-Si alloys at the International Space Station, finding that significant CET phenomena were present in both microgravity and gravity samples. It can be seen that the effect of gravity on the directional solidification behavior of alloy systems containing different kinds of solutes is significantly different, which is most likely related to the different densities and redistribution behavior of such solute elements, as well as different experimental conditions, such as different solidification directions compared to the gravity, etc. The influence of gravity in the solidification of alloys is complicated and related to many factors. A study using a single alloy is not enough to reveal the complicated mechanism, and combined research considering more factors is necessary. In this work, two types of binary hypoeutectic Al-based alloys, Al-3.5 wt.% Si and Al-10 wt.% Cu, were selected as the research subjects for conducting directional solidification experiments under gravity and microgravity conditions using the 50-m-high drop tube25. Si and Cu are both positive segregation elements in Al alloys but with different densities. By comparing the different gravity effects exhibited during the directional solidification processes of the two alloys, especially the variations in dendritic and grain structures, eutectic content, and compositional segregation, this study aims to gain a deeper understanding of the fundamental role of gravity in the directional solidification process of Al-based alloys containing different densities of solutes.
Results
Temperature–time curve
The top surface temperatures of the samples, recorded by the infrared thermometer during the experiment, are shown in Fig. 1. It can be seen that for both alloys, the gravity sample (hereafter referred to as 1g sample) and the microgravity sample (hereafter referred to as μg sample) had almost the same heating history, i.e., the same initial status before solidification. They were heated up to above 700 °C within 10 s, then cooled down to the liquidus temperatures within about 1 s. The average cooling rates can be approximately determined from the temperature change during this 1-s interval, which is about 88 °C/s for the Al-3.5 Si alloy (from 718 °C to 630 °C) and 85 °C/s for the Al-10 Cu alloy (from 704 °C to 619 °C). During cooling, the upward directional solidification took place immediately with the solid end as substrate. Due to the drop-down, the temperature of the μg samples was not monitored. Considering whether dropped down or not, both 1g and μg samples were cooled under the same vacuum conditions with identical ambient temperatures, it can be reasonably believed that the solidification conditions for the 1g and μg samples were consistent. This means that both the 1g and μg samples had essentially solidified before falling into the silicone oil, with the only variable during this period of time being the gravity level. Therefore, the solidification microstructures of the 1g and μg samples can be used for a comparative discussion of the gravity effects.

a Al-3.5 Si alloy, b Al-10 Cu alloy. The black curve with square symbols shows the temperature–time profile of the 1g sample, and the red curve with circular symbols shows the temperature–time profile of the μg sample.
Solidification microstructure
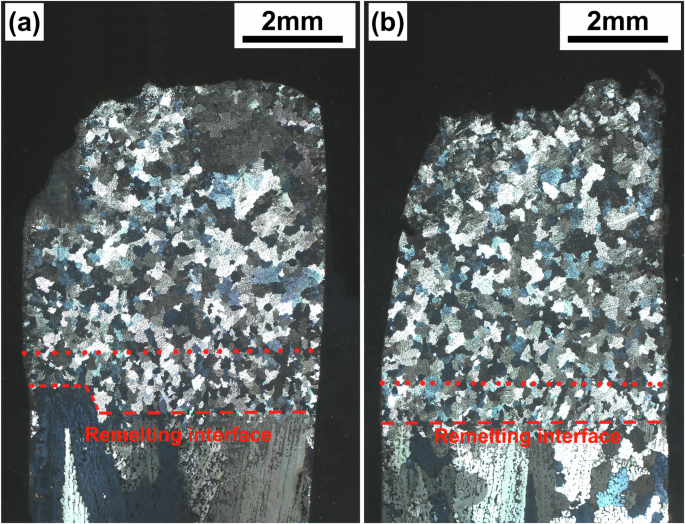
The morphologies of the dendrites in the longitudinal sections of the samples are shown in Fig. 2. The solidification microstructures of the 1g and μg samples of Al-3.5 Si alloy both consist of columnar dendrites growing epitaxially from the substrates at the early stage and equiaxed dendrites growing randomly at the later stage near the top or crucible wall. The epitaxially growing dendrites in the 1g samples are oriented with an approximately 8.5° deviation from the axial direction (Fig. 2a); while in the μg samples, the epitaxially growing dendrites are almost perfectly parallel to the axial direction, with less randomly growing dendrites near the crucible wall (Fig. 2b). On the other hand, the solidification microstructures of the 1g and μg samples of Al-10 Cu alloy are predominantly equiaxed dendrites (Fig. 2c, d). Observations of magnified images near the remelting interface (Fig. 3) reveal that the initial solidification microstructures of the Al-10 Cu alloy samples also consist of epitaxially growing columnar dendrites. However, unlike the Al-3.5 Si alloy, the columnar dendrites undergo a columnar-to-equiaxed transition (CET) shortly after the onset of growth, transforming into endogenously growing equiaxed dendrites.
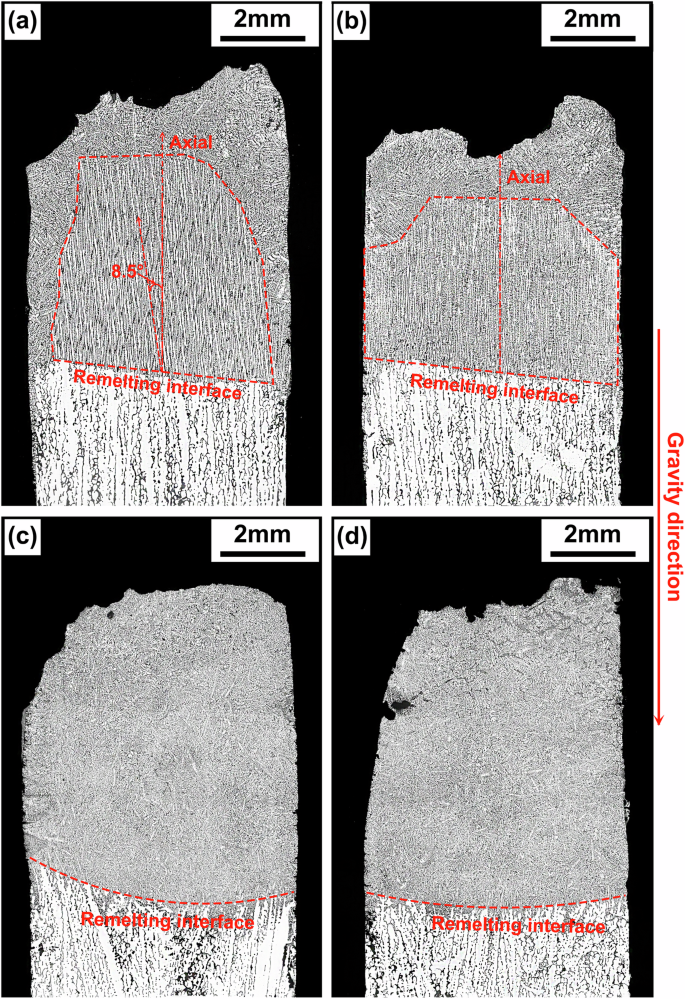
a Al-3.5 Si alloy 1g sample, b Al-3.5 Si alloy μg sample, c Al-10 Cu alloy 1g sample, d Al-10 Cu alloy μg sample. Red lines are used to mark the remelting interface of the samples, as well as the growth direction and growth region of epitaxial dendrites of the Al-3.5 Si alloy. Black lines indicate the direction of gravity.
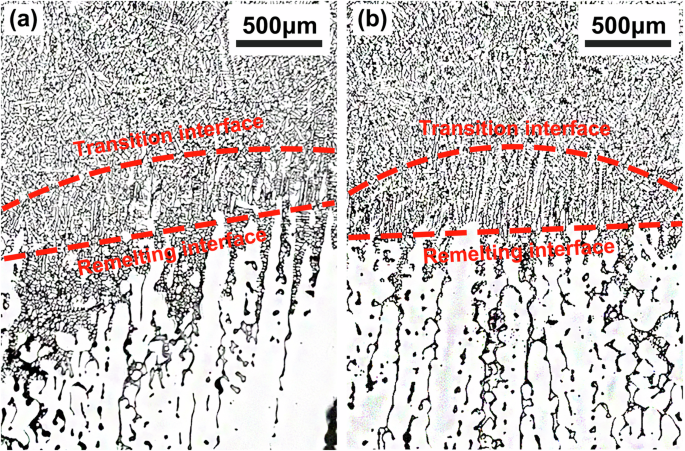
a 1g sample, b μg sample. Red lines mark the remelting interface and CET interface of the 1g and μg samples of the Al-10 Cu alloy.
Statistics on the DAS, eutectic content, and grain size
Figure 4 presents statistical mappings of the DAS and eutectic content distribution for the 1g and μg samples of the two alloys. The specific areas selected are marked in Fig. 4d, avoiding the sidewalls and upper regions of the samples. From the mappings, it can be found that the distributions of the DAS and eutectic content have a direct correlation. Firstly, along the radial direction, the central parts of the 1g samples of both alloys (Fig. 4a, c) have larger DAS and higher eutectic content compared to the sides, whereas the μg samples of both alloys (Fig. 4b, d) show no significant variation in the DAS and eutectic content. Secondly, upward in the axial direction, both DAS and eutectic content increase across all samples. Such radial and axial distribution characteristics are most pronounced at 0.5 mm above the remelting interface and at the central axis, respectively. To better compare the correlation between DAS and eutectic content and understand the role of gravity, statistical values along these two lines are plotted in Fig. 5. It shows that, whether along the axial or radial direction, the DAS and eutectic content in the μg samples of both alloys are lower than those in the 1g samples in most cases, except for the DAS of the Al-10 Cu alloy along the axial direction (Fig. 5d), which is initially lower and then reverses to be higher after some growth distance for the μg sample.
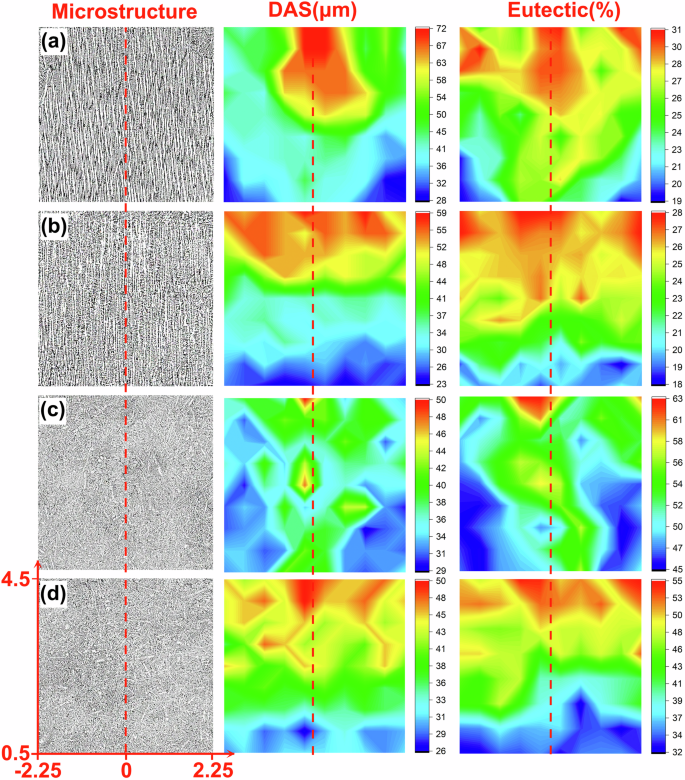
a Al-3.5 Si alloy 1g sample, b Al-3.5 Si alloy μg sample, c Al-10 Cu alloy 1g sample, d Al-10 Cu alloy μg sample. The redder the color, the greater the DAS and eutectic content; conversely, the bluer the color, the smaller the DAS and eutectic content. The specific selection of position coordinates is shown in Fig. 4d, where the red dashed line represents the central axis, and the x-axis is located 0.5 mm above the remelting interface. The measurement grid size, as described in the microstructural characterization section, is 0.5 × 0.5 mm.
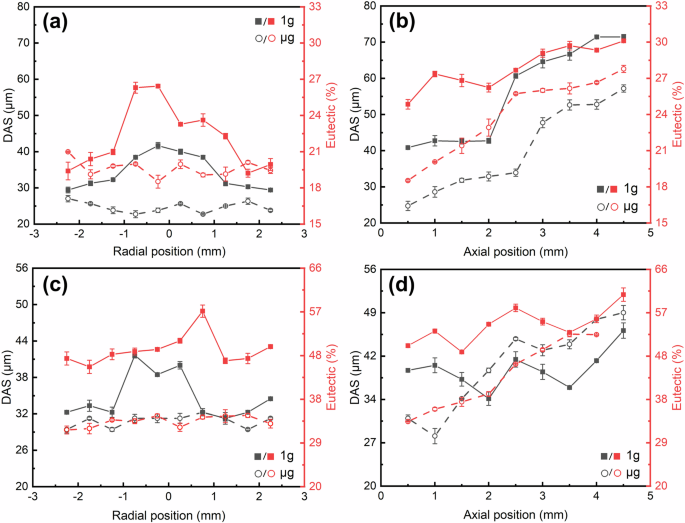
a radial Al-3.5 Si alloy, b axial Al-3.5 Si alloy, c radial Al-10 Cu alloy, d axial Al-10 Cu alloy. All statistical data were collected from at least three independent measurements, with the dots representing mean values and the error bars indicating standard deviation.
Furthermore, the average values of all DAS and eutectic content measured at the locations shown in Fig. 4d were calculated. For the Al-3.5 Si alloy, the average/standard deviation of the DAS for the 1g and μg samples is 45.95/3.55 μm and 39.49/3.26 μm, respectively, while the average/standard deviation of eutectic content is 25.46/2.91% and 22.12/2.82%, respectively. For the Al-10 Cu alloy, the average/standard deviation of the DAS for the 1g and μg samples is 39.33/3.92 μm and 35.82/3.04 μm, respectively, while the average/standard deviation of eutectic content is 51.27/4.24% and 43.73/4.03%, respectively. Compared to the 1g samples, the average DAS for the μg samples of Al-3.5 Si and Al-10 Cu alloys decreased by approximately 14% and 9%, respectively, while the average eutectic content decreased by about 13% and 9%. Additionally, it was found that the average DAS of the Al-10 Cu alloy is significantly smaller than that of the Al-3.5 Si alloy, yet its average eutectic content is significantly higher. This indicates that DAS and eutectic content are not solely related to dendrite morphology but are also largely dependent on grain size and morphology. Therefore, it is necessary to further analyze the grain structure of the alloys. As the grain structure of the Al-3.5 Si alloy consists mainly of epitaxial columnar dendrites parallel to each other, the analysis primarily focuses on the Al-10 Cu alloy.
Due to the interlocking of equiaxed dendrites, features such as grain size and morphology were obscured under normal metallographic conditions; the anodizing method described in the microstructural characterization section, along with the polarized light mode of the OM, was employed to characterize the morphology of grains in the longitudinal section of the Al-10 Cu alloy. The results, as shown in Fig. 6, reveal significant differences in grain size between the upper and lower parts of the samples; therefore, they were analyzed separately. The statistical results of grain number density and grain size in the upper and lower parts of the samples are listed in Table 1. As the table indicates, whether in the upper or lower part of the solidification structure, the grain number density is higher, and the average grain size is smaller in the μg samples than in the 1g samples.
a 1g sample, b μg sample. The red dashed line represents the remelting interface, and the red dotted line indicates the boundary between the coarser grains in the upper part and the finer grains in the lower part.
Statistics on the distribution of solute elements
Figure 7 displays the elemental distribution mapping in the Al-3.5 Si and Al-10 Cu alloys, showing that the Al element is predominantly enriched in the primary dendritic microstructure, while the solute elements Si and Cu are mainly concentrated in the secondary eutectic microstructure, with microsegregation coefficients both below 1. Meanwhile, macrosegregation of solute elements was also observed throughout the solidification region. Considering that elemental segregation is closely connected to the distribution of the DAS and eutectic content, the macroscopic and microscopic distributions of solute elements were statistically analyzed along axial and radial directions where the DAS and eutectic distribution patterns changed most evidently. For measuring the macroscopic distribution of elements, the same grid size of 0.5 × 0.5 mm and step size of 0.5 mm were used for measuring the DAS and eutectic content. The average value of the elemental content within each grid was taken as the macroscopic elemental content at that point. When measuring the microscopic distribution, the step size remained the same while the grid size was reduced to 10 × 10 μm and strictly confined within the primary dendritic and secondary eutectic microstructures, respectively. The measurement results, as shown in Fig. 8, indicate that along the growth direction, the macroscopic distributions of Si content in the Al-3.5 Si alloy 1g and μg samples both exhibit increasing trends, with the increase in the 1g sample being faster (Fig. 8b). In contrast, the macroscopic distribution of Cu content in the Al-10 Cu alloy 1g sample shows a decreasing trend, while that in the μg sample fluctuates around the nominal composition (Fig. 8d). Radially, the macroscopic distributions of solute content in the 1g samples of both alloys are higher in the middle and lower at the sides, while in the μg samples, they both exhibit slightly fluctuating patterns (Fig. 8a, c). On the other hand, it was found that the degree of microsegregation and the macroscopic elemental content are significantly correlated, the higher the macroscopic elemental content, the lower the Kseg value, implying more severe microsegregation.
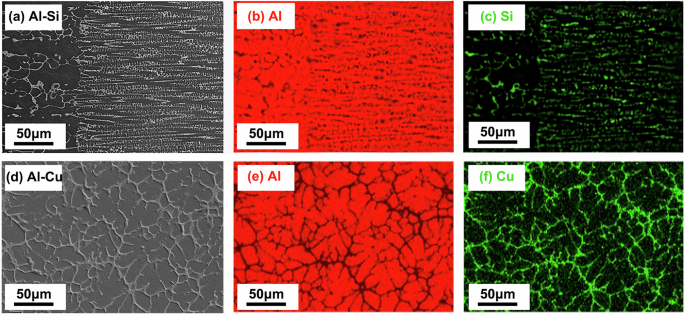
a, b, c Al-3.5 Si alloy; d, e, fAl-10 Cu alloy. From left to right are the backscattered electron images of the dendrite structures, the distributions of the solvent Al, and the distributions of the solutes Si and Cu.
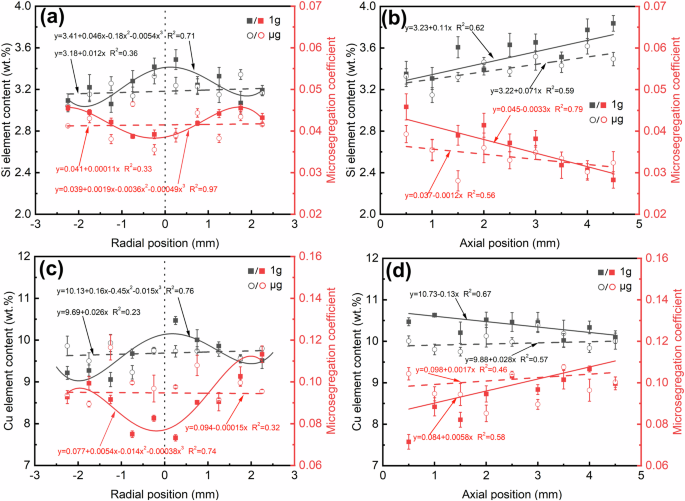
a radial Si element, b axial Si element, c radial Cu element, d axial Cu element. The data sites are consistent with those of the DAS and eutectic content in Fig. 5. The determination method of the microsegregation coefficient is described in the microstructural characterization section. All statistical data were collected from at least three independent measurements, with the dots representing mean values and the error bars indicating standard deviation.
Discussion
In the microgravity environment, the distribution of solute elements is almost entirely controlled by pure diffusion. For both alloys, the solute partition coefficients (k0) are less than 1, indicating that excess solute elements are expelled into the surrounding liquid during the solidification process26. The Al-3.5 Si alloy primarily grows in the way of epitaxial columnar dendrites, with a growth direction almost entirely parallel to the axial direction (Fig. 2b). The expelled Si element gradually accumulates along with the dendrite growth. Thus, the macroscopic content of the Si element continuously increases axially (Fig. 8b) with no significant radial pattern (Fig. 8a). In the Al-10 Cu alloy, which solidified mainly in the way of equiaxed grain growth, the randomly oriented equiaxed dendrites expelled solutes in random directions, resulting in no significant changes in Cu content both axially (Fig. 8d) and radially (Fig. 8c).
Under normal gravity conditions, buoyancy convection is brought into the melt by gravity, whose pattern is shown in Fig. 9. Additionally, Marangoni convection pattern and solute macrosegregation characteristics in the melt of the two alloys are also shown in Fig. 9. Marangoni convection is driven by surface tension gradient, which comes from the differences in temperature or concentration at the liquid-liquid or liquid-gas interface27,28. In this work, Marangoni convection mainly occurs near the gas-liquid interface and has minimal impact on the solidification process. Buoyancy convection, as described in the introduction, is divided into thermal convection and solutal convection. Under the induction heating condition, only the metallic sample is heated, while the crucible, being a non-conductor, is not heated directly. Thus, the melt near the crucible walls has better heat dissipation conditions and cools faster, resulting in a lower temperature and, of course, a relatively higher density there. Under the influence of gravity, it flows downwards, moves radially inward near the solid–liquid interface, and finally flows upwards at the center, forming a typical double-vortex thermal convection as shown in Fig. 9. The thermal convection patterns in the melts of both alloys are the same. Under the action of thermal convection, both Si and Cu elements flow towards the center of the sample near the remelting interface and then flow upwards at the center of the sample. However, the solutal convection patterns depend on the type and density of the solute expelled or absorbed by dendrites during solidification, the density of solvent Al is 2.70 g/cm3, while those of solutes Si and Cu are 2.34 g/cm3 and 8.96 g/cm3, respectively. The Si-rich melt in the Al-3.5 Si alloy is lighter, while the Cu-rich melt in the Al-10 Cu alloy is heavier. Moreover, during the epitaxial growth of the Al-3.5 Si alloy dendrites, the dendrite growth direction remains unchanged, always upward, and the Si-rich melt at the front of the solid–liquid interface will continuously flow upwards under the effect of gravity due to smaller density. This accounts for the upward enrichment of Si in the Al-3.5 Si alloy sample. However, in the Al-10 Cu alloy, which solidifies in the form of equiaxed crystals with independent nucleation, the grains can move and rotate freely, and the growth direction of dendrite can be any orientation. Furthermore, after expelling Cu into the melt, the solidified grain skeletons may become less dense than the surrounding melt, consequently, they probably float upwards while growing under the effect of buoyancy, and the Cu-rich melt surrounding the grains flows downwards meanwhile29. Then, under such combining effects, the distribution of downward enrichment of Cu content in the sample was formed. As for the radial distribution of Si and Cu contents, i.e., higher in the middle and lower at the sides (Fig. 8a, c), it is tended to be the results primarily influenced by thermal convection, which has little relationship with solute density. Along the central axis, thermal convection and solutal convection synergistically affect the distribution of Si element, intensifying the upward segregation of Si (Fig. 8b). In contrast, they have competing effects on the distribution of Cu element, coupled with the influence of the floating of equiaxed grains and the downward flow of Cu-rich melt, leading to the downward segregation of Cu (Fig. 8d).
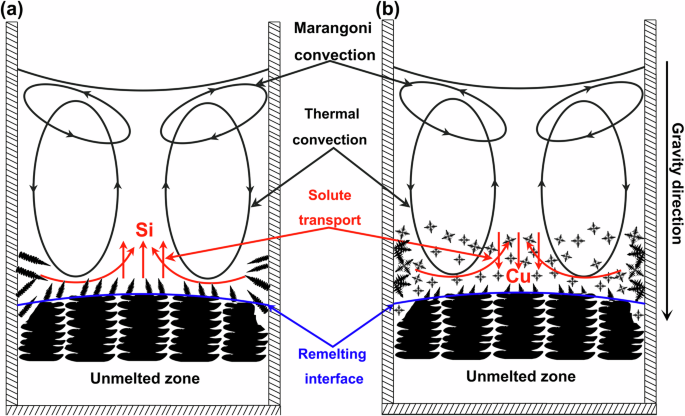
a Al-3.5 Si alloy, b Al-10 Cu alloy. The diagram reveals the underlying mechanisms of solute segregation in 1g samples of both alloys due to gravity-induced convection and sedimentation. The black circles represent the thermal convection, and Marangoni convection rings, the blue line indicates the remelting interface and the red curves and lines represent the direction of solute macrosegregation caused by thermal convection and solute convection, respectively. The downward pointing arrow represents that the direction of gravity is top-down.
It can be found that, even under microgravity conditions, macrosegregation of solute elements cannot always be eliminated. In the case of epitaxial growth of the Al-3.5 Si alloy, although the extent is weaker than that in 1g sample, the macrosegregation of Si element still exists. In the case of polycrystalline growth of the Al-10 Cu alloy, the macrosegregation of the Cu element almost disappears. This suggests that the macrosegregation behavior of solute elements is not only dependent on gravity level but also on the type of solute and solidification morphology. Finally, for both alloy systems in this work, an increase in the local macroscopic content of solute elements intensifies local microsegregation. This could be well understood from the phase diagram: higher solute concentrations lead to a larger composition gap between the solid and liquid phases in the phase diagram, and thus greater differences between the compositions of primary dendritic and secondary eutectic microstructures, resulting in more severe microsegregation26.
The impact of gravity on dendritic growth, especially on the DAS, has always been a focal point in the study of directional solidification theory. Hunt30 was the first to establish a theoretical model relating the primary dendrite spacing (λ1) to solidification process parameters, given by the formula:
The growth of secondary dendrites is accompanied by coarsening, a process primarily dependent on the local solidification time of the alloy. The relationship for the secondary dendrite spacing (λ2) can be expressed as31:
In both formulas, aside from the temperature gradient GL at the dendritic front, the local dendritic growth rate R, and the local cooling rate ν, all other parameters are constants related to the properties of the alloy itself, and the product of GL (°C/mm) and R (mm/s) equals ν (°C/s)31. Regarding other classic theoretical models32,33,34,35 for λ1 and λ2, although the expressions vary, the principle remains consistent, agreeing that for any given alloy, λ1 and λ2 are inversely related to GL and R. In reality, when GL and R decrease, leading to a reduction in ν, the local dendritic solidification time increases, as do the times for dendritic coarsening and eutectic development. To adapt to these conditions, dendrites must grow at greater spacing.
Along the axial direction, the solid phase heat dissipation capacity in the μg samples of both alloys continuously decreases with the release of crystallization latent heat, leading to a continuous decrease in the temperature gradient and dendritic growth rate36. Therefore, both DAS and eutectic content show an increasing trend. In the 1g samples of Al-3.5 Si alloy, the presence of thermal convection further reduces the temperature gradient in the melt, and the continuously upward-accumulating Si element reduces constitutional supercooling, thereby slowing down the dendritic growth rate36. Meanwhile, the enrichment of Si intensifies microsegregation (Fig. 8), increasing the Si content between dendrites and producing more intragranular eutectic. As a result, both thermal convection and the macrosegregation of the Si element further increase the DAS and eutectic content, causing the DAS and eutectic content in the 1g sample of Al-3.5 Si alloy always being greater than those of the μg sample. As a contrast, for the Al-10 Cu alloy, the thermal convection pattern in its 1g sample is the same as that of the Al-3.5 Si alloy 1g sample, leading to an increase in the DAS and eutectic content. However, due to the upward buoyancy motion and downward solute flow as described in the previous section, the floating grains have better conditions for solute and heat exchange, resulting in a faster dendritic growth rate and correspondingly lower DAS and eutectic content, meanwhile, the Cu element continuously segregates downwards during such a process, slowing the dendritic growth rate in the lower part of the sample and increasing DAS and eutectic content. Therefore, the downward segregation of the Cu element suppresses the dendrite growth at the initial solidification stage, causing the DAS and eutectic content near the remelting interface of the 1g sample greater than those of the μg sample, but then, with floating-up of Al-rich grains and decreasing of Cu content, the DAS and eutectic content of the 1g sample gradually become less than or close to those of the μg sample, respectively. The distribution patterns and relative differences of the DAS along the axial direction of the 1g and μg samples of both alloys are consistent with the previous findings of Cahoon20 and Steinbach22 et al. mentioned in the introduction, which is related to the weakening effect of thermal convection on the temperature gradient. This is undoubtedly true but not sufficient to explain the observed phenomena. It is found in this study that the differing transport phenomena of solutes with varying densities, under the influences of thermal and solute convection, also played a significant role in microstructure formation, it is the differing segregation patterns of solutes with varying densities that affect dendrite growth rates, leading to the contrasting relative sizes of the DAS in the 1g and μg samples of the two alloys.
Along the radial direction, the temperature gradient and composition of the μg samples of both alloys show no obvious pattern of change, resulting in fluctuating trends in DAS and eutectic content. In the 1g samples, the Si and Cu elements enrich toward the center region, leading to a slower dendritic growth rate at the center region and consequently higher DAS and eutectic content.
Furthermore, the interlocking equiaxed dendrites of the Al-10 Cu alloy increase the number of phase boundaries and grain boundaries. This, on the one hand, increases the number of intersection points, making the DAS of the Al-10 Cu alloy smaller than that of the Al-3.5 Si alloy. On the other hand, the competition between adjacent grains leads to solute accumulation at the grain boundaries, transforming into intergranular eutectic, making the eutectic content of the Al-10 Cu alloy higher than that of the Al-3.5 Si alloy. Similarly, the grain size and distribution in the 1g and μg samples of the Al-10 Cu alloy are also different, which impacts the DAS and eutectic content of both. Any factor that promotes nucleation and inhibits growth is beneficial for refining grains. The melt above the remelting interface, under the chilling effect of the unmelted end, generates a large degree of undercooling. Generally, as undercooling increases, both the nucleation rate and growth rate increase, but the nucleation rate increases more significantly than the growth rate. Therefore, at the initial stage of solidification, the grain sizes of the 1g and μg samples are both small. As solidification proceeds, the liquid phase temperature gradient decreases, and the melt undercooling decreases. Therefore, along the axial direction, the grain sizes of both the 1g and μg samples of the Al-10 Cu alloy increase. The difference is that, under gravity conditions, thermal convection continuously brings hotter melt to the front of the macroscopic solid–liquid interface at the bottom, raising the melt temperature there, and the downward segregation of Cu element lowers down the liquidus temperature of the melt, both of which further reduces nucleation rate, but the floating-up motion of the nuclei gives them more space and time as well as better solute and heat exchange condition to grow up, resulting in the number density always lower but the grain size much larger than those of the μg sample at the same solidification stage. The larger the grain size, the fewer the phase boundaries and grain boundaries. This explains why, although the DAS at the central axis of the Al-10 Cu alloy 1g sample is progressively smaller than that of the μg sample, the overall average DAS value (39.33 μm) is still greater than that of the μg sample (35.82 μm). Influenced by the average DAS, the average eutectic content of the 1g sample (51.27%) is higher than that of the μg sample (43.73%).
Besides the thermosolutal convection and sedimentation movement, under gravity conditions, hydrostatic pressure in the melt also plays a role in affecting the solidification process. Under the effect of the hydrostatic pressure, melt at the edge of the samples has close contact with the crucible wall, resulting in a better radial heat dissipation effect. Therefore, the Al-3.5 Si alloy 1g sample has many dendrites growing radially from the crucible wall, interfering with the growth of axial epitaxial dendrites. Furthermore, influenced by radial heat flow, the growth direction of epitaxial dendrites deviates by approximately 8.5° from the axial heat flow direction. Under microgravity conditions, without the hydrostatic pressure, the melt exhibits a weak wall effect, the number of radial dendrites significantly decreases, and the epitaxial dendrites are almost parallel to the axial heat flow direction.
It should be noted that all the statistical data in this study were collected from at least three independent measurements. Although the statistical results for individual data points may deviate slightly from actual values due to factors such as instrument error and manual operation error, the overall trends that the results show are still reliable and valid. These findings suggest that the gravity effects on the solidification of alloys cannot be simply generalized. In addition to the gravity itself, other relevant factors, such as solute density, solute redistribution behavior (positive or negative segregation), solidification direction with respect to the gravity and dendrite growth pattern (epitaxial or equiaxial growth), etc., should be taken into account. Only in this way, deep insights could be achieved, and that’s what we need to do in future research.
Methods
Experimental materials and procedures
The experimental materials were Al-3.5 wt.% Si alloy and Al-10 wt.% Cu alloy (hereinafter referred to as Al-3.5 Si alloy and Al-10 Cu alloy). The composition points of the two hypoeutectic alloys are consistently positioned at approximately 30% of their respective eutectic compositions in their phase diagrams, aiming to ensure a roughly similar overall content ratios of primary dendritic microstructure to secondary eutectic microstructure in both alloys, facilitating subsequent comparison and discussion. The preparation process was as follows: firstly, the Al-3.5 Si and Al-10 Cu master alloys were smelted in a vacuum induction furnace using 99.99% industrial pure aluminum, 99.99% pure silicon, and 99.99% pure copper. Then, the master alloys were pretreated in a Bridgeman-type directional solidification furnace to obtain the columnar dendrite structures. Finally, they were cut into cylindrical rods with a diameter of 6 mm and a length of 20 mm.
The microgravity experimental device is a 50-m-long vacuum drop tube, which can achieve approximately 3.2 s of microgravity time (the schematic diagram of the drop tube is detailed in the previous publication by Luo25 et al.). The device’s vacuum and microgravity levels can reach 1 × 10⁻⁴ Pa and 1 × 10⁻⁶ g0, respectively. During the experiment, the temperature at the top of the sample was measured and recorded using a METIS MI16 infrared pyrometer. The experimental procedures are as follows: (1) Load each sample into a corundum crucible with an inner diameter of 6 mm and a length of 35 mm, place the crucible on a removable tray uprightly at the top of the drop tube, and evacuate the drop tube to a vacuum of 1 × 10⁻⁴ Pa. (2) Use a high-frequency heating coil wrapped around the crucible to rapidly heat the upper part of the sample to a molten state while keeping the lower part of the sample unmelted. (3) Switch off the heating power and remove the tray simultaneously, the sample, along with the crucible, was released and underwent free-fall motion in the drop tube. During the 3.2 s fall, the sample solidified from the unmelted end, and finally was collected in a vessel containing silicone oil at the bottom of the drop tube. This kind of sample was recorded as the μg sample. For comparison, in procedure 3, after switching off the heating power, another sample stayed still for 3.2 s before removing the tray. During the 3.2 s, the sample solidified at rest, then was collected in a vessel containing silicone oil at the top of the drop tube. This kind of sample was recorded as the 1g sample
Statistics and reproducibility
The experimental procedures for Al-3.5 Si and Al-10 Cu alloys are identical, for each of the two alloys, at least five samples were experimented under both gravity and microgravity conditions. Subsequent sectioning analysis of these samples indicated that multiple samples of the same alloy under identical conditions exhibited generally consistent solidification characteristics (such as solidification structure and compositional distribution), demonstrating excellent reproducibility. Therefore, we selected one of the most representative and universally applicable samples from each alloy under each condition to present the experimental results in this study. The specific experimental parameters are shown in Table 2.
Microstructure characterization
The samples were bisected along their central axis, mounted, ground, and mechanically polished, followed by electropolishing with a QETCH 1000 polisher. The longitudinal dendritic morphology of the samples was observed with an Olympus GX53 optical microscope (OM). Then, the electropolished samples were anodized with the QETCH 1000, and the grain structures of the longitudinal section were observed under the polarized light mode of the OM. Electropolishing was conducted at a voltage of 20 V for 15 s in a solution of HClO4 (50 ml) and C2H6O (450 ml), and anodizing was conducted at a voltage of 20 V for 120 s in a solution of HBF4 (10 ml) and H2O (400 ml). The DAS, eutectic content, and grain size were statistically analyzed with the Image Pro Plus image processing software. Initially, the images of the longitudinal dendritic morphology of the samples were gridded at a grid size of 0.5 × 0.5 mm. Then, to differentiate between primary dendritic and secondary eutectic microstructures, color thresholding was applied to the images. Areas with a gray value below the threshold were identified as the eutectic microstructure, and the eutectic content was expressed as a percentage of the total area occupied by eutectic. Subsequently, to standardize the measurement of DAS for both alloys, the linear intercept method described by Liu13 et al. was adopted. Several lines were randomly generated, and intercept points were recorded where the lines crossed the boundaries between dendrites and eutectic microstructures, the DAS was then determined by the ratio of the line length to the number of intercept points. It should be noted that the DAS determined by this method does not correspond to the primary or secondary dendritic arm spacings but represents the average intercept of random lines intersecting with dendrites, serving as an effective parameter for assessing the spatial distribution of the size of the dendritic microstructures. Finally, DAS and eutectic content were quantified for each grid cell, and the results were organized by corresponding locations and represented in contour maps. The macroscopic and microscopic distribution of solute elements at different locations in the samples were analyzed using an FEI APREO scanning electron microscope with energy-dispersive spectroscopy (SEM-EDS). The microsegregation coefficient used here is defined as follows9:
where Cd and Ce represent the solute concentrations in primary dendritic and secondary eutectic microstructures, respectively. For the alloys used in this work, Kseg values are both less than 1, lower Kseg value indicates more severe microsegregation.
Responses