Compounding effects of climate change and WUI expansion quadruple the likelihood of extreme-impact wildfires in California

Introduction
The impact of anthropogenic climate change on wildfires (hereafter called fires) has been extensively documented in the scientific literature1,2,3. Rising temperatures, prolonged droughts, and changes in precipitation patterns have created conditions highly conducive to the ignition and rapid spread of fires4,5,6,7. As the climate continues to warm, these trends are expected to intensify, leading to longer fire seasons, more frequent and severe fire-weather conditions, and an overall increase in the annual area burned by fires where fuels remain available8,9,10,11,12. In addition to climate change, human development and activities have played a significant role in shaping the fire landscape13,14,15,16. The majority of fires in the United States are human-caused13,17,18. Furthermore, the expansion of developed lands and human settlement into fire-prone areas, known as the wildland-urban interface (WUI), has increased the risk of fire and the potential for catastrophic losses19,20,21,22,23,24. The WUI represents a complex and dynamic environment where human development meets wildland vegetation, creating a unique set of challenges for fire management and mitigation efforts25,26,27. As human development encroaches upon these high-risk zones, the likelihood of human-caused ignitions increases, leading to an overall increase in exposure of assets to fires28,29,30. Furthermore, flammable materials used in houses provide ample fuel for the fire, increasing the likelihood of flames spreading deeper into residential areas31,32,33. In addition, the presence of homes and other structures within the WUI complicates firefighting efforts and increases the potential for property damage and loss of life20,34.
While previous studies have provided valuable insights into the individual factors contributing to fire risk, there is a need for a more comprehensive and integrated understanding of the complex interplay between human activities (e.g., human ignitions and settlement patterns) and climate change in shaping the compound fire risk19,35,36. Studies have focused on specific aspects, such as the role of climate change in altering fire regimes35,37, the impact of WUI expansion on ignition patterns19,20,38, and understanding the role of compound hot-dry-extremes in elevating the fire danger39,40,41. However, there is a need for research that examines the compound effects of anthropogenic activities and climate change in enhancing fire risk and their implications for fire management and policy.
To address this research gap and enhance our understanding of compound fire risk, this study analyzed the characteristics of the top 20 largest (based on area burned), most destructive (based on structures destroyed), and deadliest (based on fatalities caused) fires, hereafter referred to as extreme-impact fires, in California during the period 1932–2022 (Table S1). Building upon the derived insights, we developed the “Integrated Human-centric Wildfire Risk Index (IHWRI)” for quantifying the evolving fire risk increases due to compounding impacts of additional housing units in WUI areas, expansion of the extent of the wildland-urban interface that increases ignition opportunities, and the rising frequency of extreme fire-weather. The primary objectives of this research are to: (1) Investigate the causes, impacts, and seasonal patterns of extreme-impact fires, (2) Quantify the proximity of extreme-impact fire occurrence to the wildland-urban interface, (3) Quantify the compound contribution of climate change and WUI expansion to fire risk.
Results
Seasonal patterns, causes, and impacts of extreme-impact fires
Using the records of extreme-impact fires in California from 1932 to 2022 (Table S1), we found that all naturally ignited largest fires occurred in summer (JJA: June-July-August; Fig. 1a)13. Human-ignited largest fires mainly occurred in summer (36% of burned areas), followed by fall (SON: September-October-November) and winter (DJF: December-January-February) (Fig. 1a). None of the largest, most destructive, or deadliest fires started in spring (MAM: March-April-May).

Seasonality of extreme-impact fires in California from 1932 to 2022 (Table S1) separated by cause (natural versus human) and based on a percentage of burned areas by largest fires; b structures destroyed per 1000 acres of burned areas in most destructive fires; and c fatalities per 100,000 acres of burned areas in deadliest fires. The seasons are abbreviated as follows: Winter or DJF (December-January-February), Spring or MAM (March-April-May), Summer or JJA (June-July-August), and Fall or SON (September-October-November). The percentages of human and naturally ignited fires are shown with pie charts in each category. The human and natural ignited fires are indicated with light red and light blue colors, respectively.
The most destructive fires were mostly human-caused and mainly occurred in fall (88%). The most destructive fires in fall destroyed 31 houses per 1000 acres of burned area (Fig. 1b). This structure loss rate is nearly an order of magnitude larger than any other season (statistically significant, p-value < 0.001). In addition, all the most destructive fires in fall were ignited by human activities (Fig. 1b). Naturally ignited most destructive fires occurred only during summer (Fig. 1b). Among the most destructive fires across all seasons (Fig. 1b), those ignited by humans destroyed 37 structures per 1000 acres burned, while naturally ignited events destroyed 3 structures per 1000 acres of burned area.
We found a similar pattern for the deadliest fires in California to that of the most destructive fires. The fall season has the highest fatality rate, with 31 deaths per 100,000 acres burned in the deadliest fires (Fig. 1c). The deadliest fires are mainly ignited by human activities, generally in fall but also in summer. The deadliest fires ignited by natural causes only occur in summer, claiming 4 fatalities per 100,000 acres burned. None of the top 20 deadliest fires analyzed in this study occurred during the winter or spring seasons.
Proximity of fires to human settlements
We used edge-based linear WUI data from Kumar et al.42 and showed that the majority (71%) of the largest fires in California from 2012 to 2022 (period of data availability) ignited within 1 km from the edges of the direct WUI. Figure 2 shows the highest frequency of extreme-impact fires within the closest distance range (0–1 km) to WUI. Close proximity of largest fires to WUI aligns with our finding that majority of these fires were human-ignited, according to CalFire records. Two examples are the Dixie Fire in July 2021, which burned 963,309 acres, and the Mendocino Complex Fire in July 2018, which burned 459,123 acres. Both of these large fires were human-ignited, with the Dixie Fire igniting within 50 m from the WUI edge, and the Mendocino Complex Fire igniting at 560 m of the WUI lines (Table S1).
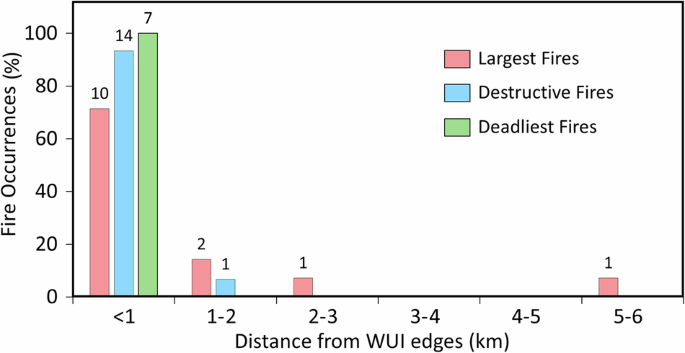
The ranges of histogram bins represent the distance of fire ignitions from the WUI edges and numbers on each histogram bar represent the number of extreme fires within each category. Note that some fires have more than one ignition point and we have shown only the closest ignition point to the WUI.
We found that 93% of the fires that destroyed the highest number of structures were ignited within 1 km from WUI from 2012 to 2022 (Fig. 2). Fires close to WUI can increase the risk of damage to properties. Examples include the human-ignited 2018 Camp Fire and 2017 Tubbs Fire that ignited 240 m and 620 m from WUI edges and destroyed 18,804 and 5636 structures, respectively (Table S1).
All of the deadliest fires from 2012 to 2022 in California were ignited within 1 km from the WUI edge (Fig. 2), indicating fires that start closer to the WUI cause more fatalities. The deadliest fire on record in California is the 2018 Camp Fire which caused 85 fatalities and was human-ignited.
Trends in conditions conducive to extreme-impact fires
Defining “Integrated Human-centric Wildfire Risk Index (IHWRI)” as the product of area, number of houses exposed to critical fire-weather, and the number of critical fire-weather days, we found a 4.1-fold increase in the compound fire risk in California from 1990 to 2022 (Fig. 3a), with critical fire-weather days (i.e., weather conducive to significant fire activity) increasing by 2.5-fold, from 14 days in 1990 to 34 days in 2022 (Fig. 3b). The area of WUI (i.e., areal opportunity for human ignition of fires) grew by 1.2-fold, from 23,772 to 27,756 km2, and WUI housing units (i.e., susceptible to fire losses) increased by 1.4-fold, from 3,646,036 to 5,138,055 (Fig. 3c, d). IHWRI experienced the greatest average annual growth at 12%, while WUI area experienced the smallest increase at 3.5%. Assessing the contribution of individual factors, critical fire-weather accounted for 49% of the IHWRI increase, and WUI area and housing growth contributed 23% and 28%, respectively. Statistical trend analysis using Mann-Kendall (M-K) and Theil-Sen tests showed significant increasing trends for IHWRI, fire-weather days, WUI area, and housing units from 1990 to 2022 (p-values < 0.0001) (Table S2).
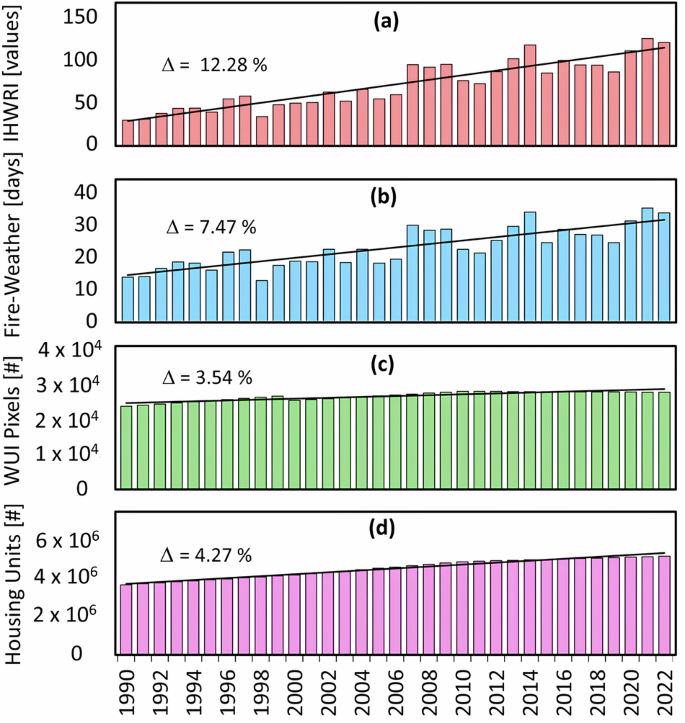
a Integrated Human-centric Wildfire Risk Index (IHWRI); b critical fire-weather days; c wildland-urban interface (WUI) area; and d housing units within WUI. The delta symbol (Δ) denotes the average annual percentage change for each trend line over the period from 1990 to 2022 and black lines indicate linear trend lines. The IHWRI values in sub-plot (a) are divided by 1010 for better readability.
The Sacramento Drainage observed the highest increase in conditions conducive to extreme-impact fires across California with an 8.7-fold increase of IHWRI over the past three decades and an average annual growth of 26% (Fig. 4b). The San Joaquin and North Coast Drainages each experienced a 5.4-fold increase in IHWRI, with average annual growth rates of 16% (Fig. 4e, a). These were mainly driven by the increases in the critical fire-weather days component of IHWRI (Figs. 4i and S1). The Central Coast Drainage had a 13% average annual growth and 4.2-fold rise in IHWRI, while the South Coast Drainage, despite the lowest average annual growth of 9%, still faced a substantial increase in compound fire risk (3.1-fold) due to WUI expansion and increasing fire-weather severity (Fig. 4c, f). The Southeast Desert Basin, with a 12% average annual increase in IHWRI and 3.8-fold increase over the past three decades, experienced the highest growth in WUI housing units (1.6-fold), highlighting increased human exposure to fire risks (Fig. 4g). Nevertheless, the Sacramento Drainage also observed a 1.5-fold increase in WUI housing units and the highest increase in WUI area (1.5-fold) from 1990 to 2022 (Fig. S3).
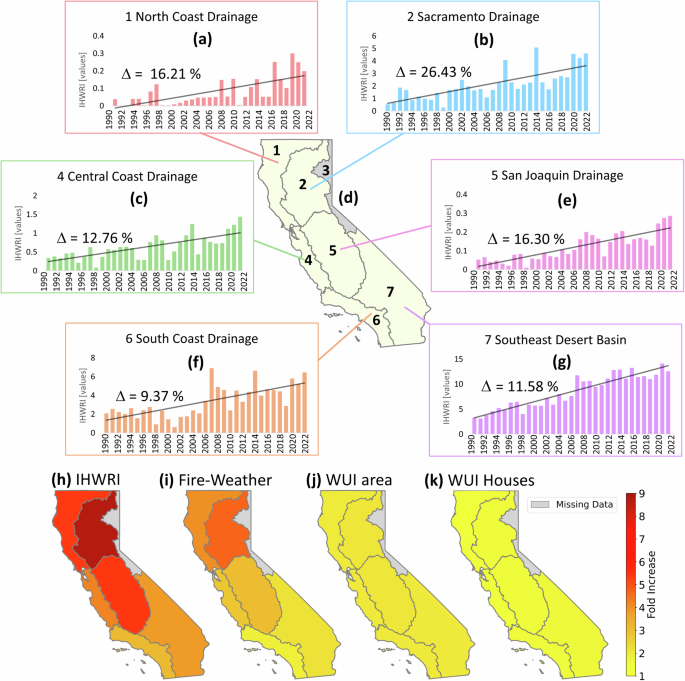
Time series of IHWRI for a North Coast Drainage; b Sacramento Drainage; c Central Coast Drainage; e San Joaquin Drainage; f South Coast Drainage; and g Southeast Desert Basin. The Northeast Interior Basin in d is excluded from this study due to missing data. The bottom panels show the spatial map of increase in h Integrated Human-centric Wildfire Risk Index; i critical fire-weather days; j wildland-urban interface (WUI) areas; and k WUI housing units from 1990 to 2022. The delta symbol (Δ) denotes the average annual percentage change in IHWRI for each climate division from (a) to (g) over the period from 1990 to 2022 and black lines indicate linear trend lines. The IHWRI values in each time series sub-plot are divided by 1010 for better readability.
Spatial distribution maps illustrate the geographical variability in IHWRI, fire-weather, WUI area, and housing increases (Figs. 4h–k and S1–S3), emphasizing the need for targeted mitigation efforts. Our analysis underscores that while WUI expansion into fire-prone areas is a concern, a significant driver of California’s escalating fire risk is the intensification of fire-weather conditions exacerbated by climate change29. Future strategies must prioritize climate adaptation and manage new developments to effectively reduce fire risks across the state.
We also found that IHWRI can directly translate to fire impacts in terms of four key metrics: area burned, structures threatened, structures destroyed, and fatalities. We found a strong correlation between IHWRI and log-transformed area burned from 1990 to 2022 (r = 0.62, p-values < 0.001) (Fig. 5d), which underscores the effectiveness of IHWRI in capturing the likelihood of extensive fire spread. This logarithmic relationship suggests that as IHWRI increases, the potential for larger fires grows exponentially (Fig. S4). Our results also indicated a significant positive correlation (r = 0.67, p-value < 0.01) between IHWRI and structures threatened by fires (Fig. 5a). However, the relationship between IHWRI and structures destroyed (Fig. 5b) and fatalities (Fig. 5c) were non-significant, although positive, indicating that factors beyond IHWRI—such as fire suppression efforts, individual preparedness, variability in fire intensity, and the stochastic nature of extreme large-loss fire events—may play a role in determining the extent of losses. This aligns with the design of IHWRI, which emphasizes exposure and hazard components over vulnerability factors, pointing to potential areas for refining the index to capture direct fire impacts more comprehensively.
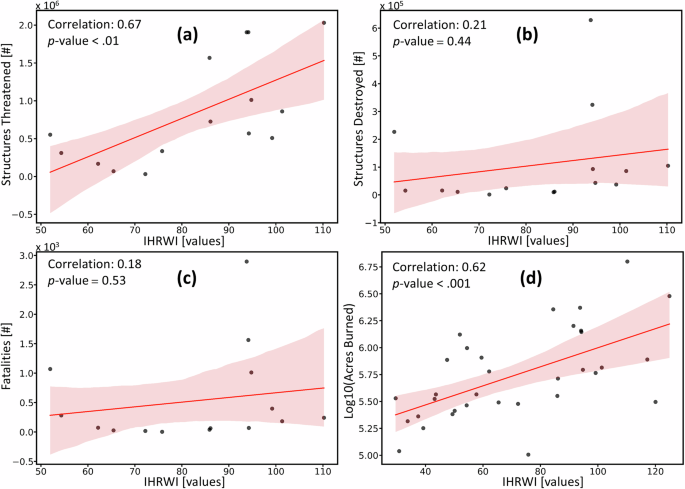
a A statistically significant positive correlation (r = 0.67, p < 0.01) is observed between IHWRI and the number of structures threatened from 2002 to 2020, suggesting that higher IHWRI values are associated with increased structural exposure to fire risk. b The relationship between IHWRI and structures destroyed from 2002 to 2020 is positive but weaker (r = 0.21, p = 0.44), indicating that additional factors may influence structural loss. c The correlation between IHWRI and fire fatalities from 2002 to 2020 is also positive but weak (r = 0.18, p = 0.53), indicating that factors such as emergency response and evacuation procedures likely play a significant role in reducing human casualties. d A strong correlation between IHWRI and log-transformed area burned from 1990 to 2022 (r = 0.62, p-values < 0.001), shows the effectiveness of IHWRI in predicting the spatial extent of wildfire spread. The IHWRI values in each sub-plot are divided by 1010 for better readability.
Discussion
This study presented an analysis of extreme-impact fires in California from 1932 to 2022, focusing on their seasonal patterns, ignition sources, impacts, and proximity to human settlements to inform the development of a comprehensive, human-centric fire risk index. Our results indicated that human-ignited fires accounted for 56% of the largest fires in California. Notably, all naturally ignited largest fires occurred during the summer months (June-August). In contrast, human-ignited largest fires occurred not only in summer but also in fall and winter. This seasonality analysis highlights the year-round vulnerability to human-caused fires, emphasizing the need for sustained public awareness and preventive measures.
Our findings indicated that the fires that destroyed the highest number of structures and caused the most fatalities were predominantly (~90%) human-ignited and mainly occurred during the fall season. These fires resulted in significantly higher destruction rates and fatalities compared to natural-ignited fires, complementing Hantson et al.’s43 findings on the distinct impacts of human-caused wildfires on ecological systems. This underscores the devastating consequences of human-caused fires, particularly in the fall season when dry, hot, windy conditions converge to develop conditions conducive to mega fires8.
Extreme-impact fires occurred in close proximity to the WUI, with 71%, 93%, and 100% of the largest, most destructive, and deadliest fires from 2012 to 2022 being ignited within 1 km of the WUI edges, respectively. This highlights the elevated risk of damage to human settlements within or near these areas. Ignition frequency of extreme-impact fires declines as the distance from the WUI increases. These findings underscore the urgent need for proactive measures to mitigate fire risks and impacts, especially in and around WUI areas, such as implementing stricter building codes, enhancing fire-resistant landscaping, and promoting community preparedness. The list of the most extreme-impact fires in California have been rapidly updated in the past decade. While outside of our study period, the Palisades and Eaton fires that occurred in January 2025 both of which currently are in the top-20 list of deadliest and most destructive fires in California as of 2025, largely adhere to our findings of such extreme fires igniting within 1 km of the WUI, being human-caused, and a product of high fire weather with large population exposure.
Notably, we introduced a novel index, the “Integrated Human-centric Wildfire Risk Index (IHWRI),” which takes into account the compounding effects of critical fire-weather days and WUI expansion, which accounts for the expansion of geographical and temporal opportunities for the ignition and growth of extreme-impact fires and housing growth in harm’s way. IHWRI indicated a 4.1-fold increase in compound fire risk in California from 1990 to 2022. While climate-driven trends alone increased critical fire-weather days by 2.5-fold, the compounding impacts of WUI expansion and climate trends amplified conditions conducive to extreme-impact fires by 4.1-fold. The Sacramento Drainage climate division in Northern California emerged as the region with the highest increase in IHWRI, mainly due to its increasing critical fire-weather days.
Our findings underscore the urgent need for a multifaceted approach to fire risk mitigation, addressing both climate change adaptation and fire-aware developments and planning. Failure to address these compounding factors can lead to increasingly catastrophic fire events, posing grave threats to human lives, property, and ecosystems. By understanding the critical role of human activities and WUI developments in exacerbating the compound fire risk, this research informs policy interventions aimed at reducing human-ignited fires and regulating development in fire-prone areas. The introduction of IHWRI offers a valuable tool for quantifying and monitoring the evolving fire risk associated with the compound impacts of WUI expansions and climate change. This index can inform targeted mitigation efforts, resource allocation, and public awareness campaigns, ultimately contributing to the protection of lives, property, and natural resources in California’s fire-prone regions. Finally, it is crucial that future studies consider factors, such as fuel management and fire prevention strategies, that can mitigate the ever-increasing fire risks.
Limitations and future work
While our study provides valuable insights into the compounding effects of climate change and WUI expansion on fire risk, we acknowledge some limitations that present opportunities for future work. Our analysis relies on data from 36 weather stations across California, which could be expanded to create a spatially continuous field of risk change, better capturing spatial heterogeneity. Incorporating additional variables related to fuel characteristics and landscape conditions would also provide a more comprehensive assessment of fire risk. Our fire proximity analysis uses a single WUI edge map from 2020 for the 2012–2020 period, which is a limitation, although changes in WUI from 2010 to 2020 were only −0.7%19. Future work could explicitly investigate how the increasing frequency of very large and mega fires affect the likelihood of their encroachment upon or occurrence near WUI zones, as our current analysis only implicitly captures this relationship. Furthermore, exploring data with higher temporal resolution could reveal seasonal or daily variations in fire risk factors, enhancing the precision of our findings. Additionally, the IHWRI index could be further refined to include vulnerability factors, potentially improving predictions of structural losses and fatalities. Finally, expanding the analysis to include various climate change scenarios would offer valuable insights into future fire risks and inform long-term mitigation strategies. Addressing these limitations in future research will enhance the understanding of compound fire risk and support the development of more effective management and policy strategies.
Methods
Study region and period
We analyzed the occurrence of extreme-impact fires in California from 1932 to 2022 (Table S1). We also investigated the compound fire risk due to WUI growth and climate-induced critical fire-weather days over the last three decades across different climate divisions of California. There are seven climate divisions in California as defined by the National Oceanic & Atmospheric Administration (NOAA): North Coast Drainage, Sacramento Drainage, Northeast Interior Basin, Central Coast Drainage, San Joaquin Drainage, South Coast Drainage, and Southeast Desert Basin44. The Northeast Interior Basin was excluded from this study due to missing data. However, this exclusion does not impact our analysis since the fires studied in our analysis generally did not occur in the Northeast Interior Basin climate division.
Fire data
We used different sources of fire data. First, the California Department of Forestry and Fire Protection (CalFire) statistical reports on fires were used for selecting the top 20 largest, most destructive, and deadliest fires in California through 202245. These fires are not mutually exclusive (Table S1). For example, the 2018 Camp Fire qualifies as one of the top 20 most destructive and one of the top 20 deadliest fires. The CalFire report provides information on the fire discovery month, fire cause, and the damages due to these fires. However, for some incidents, the information on fire causes is missing, and we collected that information from media publications and online sources. Second, to analyze the trend of annual burned acres and its correlation with IHWRI from 1990 to 2022, we used: the Monitoring Trends in Burn Severity46 fire data. To investigate the occurrence of these extreme-impact fires with respect to the recent WUI developments, we used the fire occurrence data from Chen et al.47, which provides precise information on fire starting points, derived from the Visible Infrared Imaging Radiometer Suite (VIIRS) data48. Chen et al.47 employed a machine learning algorithm to track fire growth by using active fire pixels recorded by the VIIRS instrument48. In addition, we used the all hazards dataset49 to test the correlation of fire exposure metrics (structured threatened, structures destroyed, and fatalities)—mined from the public archive of the US National Incident Management System Incident Status Summary (ICS-209) forms—with IHWRI from 2002 to 2020 (common period of data availability).
WUI and housing data
We used the edge-based linear WUI data methodology from Kumar et al.42. It is calculated using accurate building footprint data and vegetation data from the National Land Cover Database 201950 to provide the updated linear WUI maps for California for 2020. Kumar et al.42 data serve to find the risk of fire occurrence with respect to the edges of the WUI, which has a higher risk of human-ignited fires due to the direct contact between flammable vegetation and houses42. Thus, it better serves our goal to investigate the distance between the point of ignition for extreme-impact fires and WUI. Additionally, to understand how WUI developments over the past three decades evolved in California, we used WUI areal data for 1990, 2000, 2010, and 2020 from Radeloff et al.19. This dataset also provides information on the number of houses present in those respective years within the WUI areas. Kumar et al.42 data provides more accurate WUI edge mapping compared to Radeloff et al.19, whereas the latter provides more detailed information, including the number of houses in the WUI, and has a longer coverage period. For a comparison of the two WUI datasets, refer to Li et al.51.
Climate data
To gather information on critical fire-weather days in California, we used data from Climate Central52, which used 36 weather stations from NOAA across six different climate divisions. A “fire-weather day” occurs when at least two measurements of hourly weather variables meet the following criteria: relative humidity less than 5% of NOAA’s regional thresholds based on fuel type and climate, temperatures higher than 45 °F in winter, 55 °F in summer, and 50 °F in spring and fall, and sustained wind speeds of 15 mph or greater52. The Climate Central data provides the time series for critical fire-weather days from 1973 to 2022 during each season and the annual average. We extracted information on the annual number of critical fire-weather days from 1990 to 2022 consistent with the timeline of WUI data availability (Fig. 1).
Analysis
Driven by data availability, we used three distinct timelines in this study: 1932–2022 for the analysis of extreme-impact fires, 2012–2022 for the analysis of the proximity of fire ignitions to WUI, and 1990–2022 to quantify the compound contribution of climate change and WUI growth to fire risk. We use the delta (Δ) symbol (Figs. 3, 4) to represent the average annual growth rate for each parameter from 1990 to 2022. This metric quantifies the rate of change over the study period for the Integrated Human-centric Wildfire Risk Index (IHWRI) and its components. We calculate the average annual growth rate using the formula: (End Value/Start Value)/Number of Years. This approach allows us to compare the relative changes in different parameters over time, providing insights into the dynamics of fire risk factors. To analyze seasonal differences in fire destructiveness, we employed a negative binomial Generalized Linear Model (GLM) to account for overdispersion in count data. The model revealed a significant effect of season on the number of structures destroyed (likelihood ratio χ2 = 24.3, df = 3, p-value < 0.001). Post-hoc pairwise comparisons with Tukey’s correction showed that fall fires were significantly more destructive than those in other seasons. The estimated rate ratio for fall compared to the next most destructive season was 2.8 (95% CI: [1.9, 4.1]).
We performed correlation analyses to assess the relationship between the IHWRI and the fire-burned area. Our analysis revealed a significant non-linear relationship between IHWRI and fire-burned areas (Fig. S4). Using log-transformed acres burned, we found a strong positive correlation (r = 0.62, p-value < 0.001) between IHWRI and fire area burned (log-transformed) (Fig. 5d).
Statistics of extreme-impact fires (1932–2022)
We analyzed seasonal patterns and causes of the extreme-impact fires in California from 1932 to 2022. We categorized the fires into three categories: the top 20 largest fires by burned area (Fig. 1a), the top 20 most destructive fires by structures destroyed (Fig. 1b), and the top 20 deadliest fires by fatalities caused (Fig. 1c). We used histograms to show the seasonal distribution of burned areas, the number of structures destroyed normalized by burned area, and fatalities normalized by burned area, providing a detailed understanding of historical fire impact.
Proximity of fire ignition point to WUI (2012–2022)
We analyzed extreme-impact fires from 2012 to 2022 (period of data availability based on Chen et al.47 data) with respect to the recent WUI of 2020. For consistency, we selected only those fires from 2012 to 2022 that are part of our previous analysis of extreme-impact fires (Fig. 1). There were 14 largest, 15 most destructive, and 7 deadliest fires during the period of 2012–2022. It is important to note that some fires have more than one ignition point, and for consistency, we have shown only the closest ignition point to the WUI in Fig. 2. We assessed the distance between the edges of WUI and fire ignition points.
Trends in integrated human-centric wildfire risk index (1990–2022)
We developed IHWRI (more details later) as the product of (1) total area of 2 × 2 km pixels adjacent to and inclusive of WUI (>73% of extreme-impact fires start within 2 km from WUI; more later), (2) number of housing units within WUI, and (3) number of critical fire-weather days. The first element represents geographical opportunity for extreme-impact fire ignition, the second element represents the structures in harm’s way, and the third element represents temporal opportunities for extreme-impact fires to ignite and spread. We estimated IHWRI annually between 1990 and 2022 in California. Since WUI data are available for 1990, 2000, 2010, and 2020, we performed a linear regression analysis to estimate annual WUI area and housing units from 1990 to 2022. We acquired critical fire-weather days from Climate Central for the period of 1990 to 2022. We estimated IHWRI values for each climate division in California, excluding the Northeast Desert Basin due to missing data. To analyze IHWRI across California, we summed the individual contributing factors over the state (i.e., sum of area, housing units, and critical fire-weather days) and calculated their product annually.
We also conducted a statistical trend analysis on the IHWRI, fire-weather days, WUI area pixels, and housing units data from 1990 to 2022 using the Mann-Kendall test and the Theil-Sen test. The results, summarized in Table S2, show statistically significant increasing trends for all four variables over the study period. The M-K test revealed strong positive correlations for IHWRI, fire-weather days, WUI area pixels, and housing units, with p-values < 0.0001 for each. The Theil-Sen test estimated significant annual increases for all variables, with 95% confidence intervals supporting the reported trends.
Integrated human-centric wildfire risk index (IHWRI)
We developed the Integrated Human-centric Wildfire Risk Index (IHWRI) as a novel approach to quantifying compound fire risk. This index is designed to incorporate three key elements: the geographical extent of the WUI—representing geographical opportunities for ignition of extreme-impact fires, the number of structures at risk, and the critical fire-weather days conducive to extreme-impact fire ignition and spread.
Mathematically, IHWRI is expressed as:
Where:
A (Area): Number of 2 × 2 km pixels (4 km2) adjacent to and inclusive of WUI
H (Housing): Number of housing units within WUI
D (Days): Number of critical fire-weather days
This formula combines spatial, structural, and temporal factors to provide a comprehensive assessment of fire risk. It is important to note that IHWRI is designed to be a flexible tool that can be adapted to different scales and contexts. The spatial resolution of the area measurement (currently 2 × 2 km pixels) and other parameters can be adjusted to suit different regions or specific risk assessment needs, allowing for flexibility in applying this index to various geographical contexts and scales. IHWRI is not intended for direct comparison between areas of vastly different sizes without consideration of scale. Instead, it provides a comprehensive risk assessment for an area given its specific characteristics and is particularly useful for assessing changes in fire risk over time within a given area. For comparisons between areas of different sizes, users should consider normalizing the index values by area.
We note that our current formulation of IHWRI primarily focuses on hazard and exposure. This approach allows us to capture the most critical and quantifiable aspects of fire risk. While studies have attempted to capture hazard, exposure, and vulnerability to understand fire risk28, our understanding of housing vulnerability to fire destruction remains incomplete, and publicly available data on structure vulnerability are lacking. Although IHWRI does not directly incorporate vulnerability factors, it provides a robust foundation for assessing overall fire risk, particularly in terms of potential impact and changes over time.

Responses