Comprehensive dataset of interactors for the entire PARP family using TurboID proximity labeling

Background & Summary
Poly (ADP-ribose) polymerases (PARPs) are a family of proteins that catalyze the transfer of ADP-ribose units from NAD+ to target proteins (ADP-ribosylation), thus playing pivotal roles in various cellular processes, including DNA repair, genomic stability, and cell death. For a long period of time, PARPs have been recognized as promising therapeutic targets in oncology, with PARP inhibition emerging as a prominent therapeutic strategy for various cancers, including pancreatic cancer1, advanced ovarian cancer2, refractory neuroblastoma3, ovarian cancer4,5, and intrahepatic cholangiocarcinoma6. Beyond cancer, recent research in the past five years has expanded our understanding of the involvement of PARPs in non-oncological diseases, such as diabetes7,8,9, intellectual disabilities7,10,11, infectious diseases12,13,14, and cardiovascular disorders15, through their effects on cellular stress responses, inflammation, and metabolic regulation14,16,17. These findings underscore the therapeutic potential of PARPs across a range of globally significant diseases and the necessity for further investigation into their pathogenic mechanisms.
The PARP family consists of 17 members, with molecular and cellular evidence suggesting that PARP members often function cooperatively. Gene sequence alignment indicates that all PARPs share a conserved catalytic domain essential for ADP-ribosylation, which is critical for their central cellular roles in DNA repair, transcriptional regulation, and chromatin organization18. Additionally, each PARP contains a unique combination of domains for specific functions, suggesting collaborative involvement in various cellular pathways. For example, PARP1’s participation in DNA repair complex formation is further modulated by PARP2 and PARP319, while PARP14 regulates PARP13’s antiviral activity through both ADP-ribosyl transferase and hydrolase activities20. PARP13 is also a major target of PARP7, with MARylation preferentially occurring on cysteine residues in PARP13’s RNA-binding zinc finger domain, while cysteine serves as a primary MARylation acceptor for PARP721. The limited selectivity of current PARP inhibitors towards distinct PARP family members and their associated adverse effects22 further suggest that PARPs function in a collective manner to regulate cellular activities. However, despite these insights, a proteomic analysis encompassing all 17 PARPs under controlled conditions remains unpublished, which is critical for understanding their collaborative pathogenic roles.
This study implemented TurboID technology in combination with high-throughput proteomic assays to systematically identify interactors of all 17 PARPs under unified experimental conditions (Fig. 1). TurboID, an engineered biotin ligase, utilizes ATP to convert biotin into biotin-AMP, a reactive intermediate that covalently labels proximal proteins, enabling efficient capture of transient and weak interactions often overlooked by traditional methods like co-immunoprecipitation and yeast two-hybrid screening23,24. To ensure spatial fidelity of TurboID fusion proteins, we designed parallel EGFP-tagged PARP constructs sharing identical vectors and linker sequences (as per TurboID chimeras). Systematic fluorescence microscopy confirmed consistent subcellular distributions across both tagging systems (see Technical Validation), thus establishing spatial credibility of subsequent interactomes. The experimental workflow involved the transfection of HEK293T cells with V5-TurboID-tagged PARP plasmids, using empty vectors as controls, followed by biotin labeling at 37 °C for 1 hour. Proteins were extracted at 95 °C in 1% SDS to ensure denaturation, and buffer exchange was performed to remove excess biotin. Streptavidin beads were then used for affinity purification, followed by biotin-competitive elution and on-bead tryptic digestion. The resulting peptides were analyzed using data-dependent acquisition (DDA) LC-MS/MS, and subsequent data processing, including missing value imputation performed with NAguideR25, yielded a total of 6,314 interacting proteins after stringent filtering. Downstream analyses included differential enrichment patterns and functional annotations, forming a validated experimental workflow that supports further interpretation of PARP interactions (Fig. 1).

High-throughput proteomic workflow for the PARP family. HEK293T cells were transfected with V5-TurboID-tagged PARP plasmids. After transfection, biotin labeling was performed at 37 °C for 1 hour. Proteins were extracted at 95 °C in 1% SDS, followed by buffer exchange. Streptavidin beads were used for affinity purification, and biotinylated proteins underwent biotin-competitive elution and on-bead tryptic digestion. Peptides were analyzed via LC-MS/MS, with data processing including database searching, missing value imputation, data filtering, and subsequent analysis through protein-protein interacton enrichment, fluorescence localizaton, GO/KEGG and interaction network construction.
To provide a broader context for these interactions, a protein-protein interaction network was constructed to visualize shared and unique interactors across the PARP family (Supplementary Figure 1 and Data Records). This network offers a comprehensive perspective on the cooperative and specialized roles of PARPs, with notable connectivity observed for members such as PARP1 and PARP2. Researchers may leverage this resource to guide mechanistic studies of under-characterized PARP members or interrogate polyPARP regulatory complexes.
Methods
Cell culture and plasmid preparation
HEK293T cells were purchased from the American Type Culture Collection (ATCC, CRL-3216) and cultured in Dulbecco’s modified Eagle’s medium (DMEM) supplemented with 10% FBS (ExCell Bio, FSD500) and a penicillin–streptomycin solution. For plasmid construction, PARP family genes were purchased from Miaoling Biology Company and amplified into pDONR221 vectors. The primers used for amplification, along with the Gene symbols and UniProt accessions, are provided in Supplementary Table 1. The genes in these entry vectors were then transferred to destination vectors, pSB26 renamed pKO187, with V5-TurboID or EGFP tags via the Gateway LR Clonase enzyme (Thermo Fisher, 11791-043). To construct the pKO187-V5-TurboID and pKO187-EGFP plasmids, PCR fragments of V5-TurboID and EGFP tags were amplified and then inserted into the pKO187 vector using the ClonExpress II One Step Cloning Kit (Vazyme, C112-01). The V5-TurboID tag and EGFP tag were inserted at the N-terminus of the target proteins. The linker sequence between the TurboID/EGFP tag and the PARP variant is 5′-3′: GAATTGATCACAAGTTTGTACAAAAAAGCAGGCTTCACC, corresponding to the amino acids EFITSLYKKAGFT (1.3 kDa). All the constructed plasmids were verified via DNA sequencing.
Protein expression and enrichment for mass spectrometry analysis
HEK293T cells at approximately 90% confluency in 150 mm dishes were transfected with 75 µl of polyethylenimine (Polysciences, 24765-1) and 15 µg of V5-TurboID-tagged PARP plasmid. To achieve similar expression levels, proteins with high expression levels—PARP5A, PARP6, PARP8, PARP10, PARP13, PARP15, and PARP16—were expressed for 24 hours. Proteins with low expression levels—PARP1, PARP2, PARP3, PARP4, PARP5B, PARP7, PARP9, PARP11, PARP12, and PARP14—were expressed for 48 hours. The V5-TurboID empty vector was used as a control in both sets of experiments, employing the same plasmid quantity across different experimental groups. The duration of cell culture was aligned with that of the corresponding experimental group to ensure the consistency of the experimental conditions. After expression, the cells were cultured in DMEM supplemented with 50 µM biotin (Sigma, V900418) for 1 hour. Biotinylation protein enrichment was performed with minor modifications as previously described for SUMOylated proteins27. Briefly, the cells were washed twice with ice-cold PBS, lysed in SDS-Lysing buffer (50 mM Tris-HCl pH 8, 1% SDS, 40 mM dithiothreitol, 5% glycerol, and protease inhibitors (Bimake China)) at 95°C for 15 minutes, and centrifuged at 12,000 × g for 10 minutes at room temperature. The supernatant was collected and diluted 10-fold with NP40-RIPA buffer (50 mM Tris-HCl pH 8, 0.5% NP-40, 150 mM NaCl, and 1 mM EDTA) and centrifuged in a centrifugal filter device (Millipore, UFC9003) at 3,000 × g for 40 minutes at room temperature. The supernatant was then diluted with SDS-RIPA buffer (50 mM Tris-HCl pH 8, 0.1% SDS, 0.5% NP-40, 150 mM NaCl, and 1 mM EDTA) to 15 mL and centrifuged again. Finally, the supernatant was collected and incubated with streptavidin magnetic beads (Beyotime, P2151-5 ml) at room temperature overnight.
Pretreatment for mass spectrometry
Streptavidin magnetic beads were captured via a magnetic rack, followed by three washes with SDS-RIPA buffer and five washes with PBS to remove surfactants. DTT (6 μL of 1 M), biotin (12 μL of 100 mM), and ammonium bicarbonate (ABC) (600 μL of 50 mM) were added to the beads, which were then incubated with shaking at 56°C and 1200 rpm for 1.5 hours. A 5% aliquot of the solution containing the beads was reserved for subsequent protein band identification via Western blotting (Fig. 2). After cooling to room temperature, iodoacetamide (IAA) (12 μL of 1 M) was added. The mixture was incubated in the dark at 37 °C with shaking at 800 rpm for 30 minutes. Trypsin (3 μL of 1 μg/μL) was added, followed by incubation with shaking at 37°C for 12–18 hours. The digestion was terminated by adding 15 μL of 10% trifluoroacetic acid (TFA). The mixture was then equally divided among three C18 desalting microcolumns (Guangzhou KeFu Tech Co.) and centrifuged at 5000 rpm. The columns were washed with 200 μL of mobile phase A (98% H2O, 2% acetonitrile (ACN), 0.1% formic acid (FA)). The bound peptides were eluted with 200 μL of mobile phase B (98% ACN, 2% H2O, 0.1% FA). Following vacuum freeze-drying, the dried peptides were resuspended in 20 μL of mobile phase A and centrifuged at 12000 rpm for 10 minutes. The concentration was determined via a microvolume spectrophotometer, and 10 μL of the supernatant was subsequently analyzed via mass spectrometry.
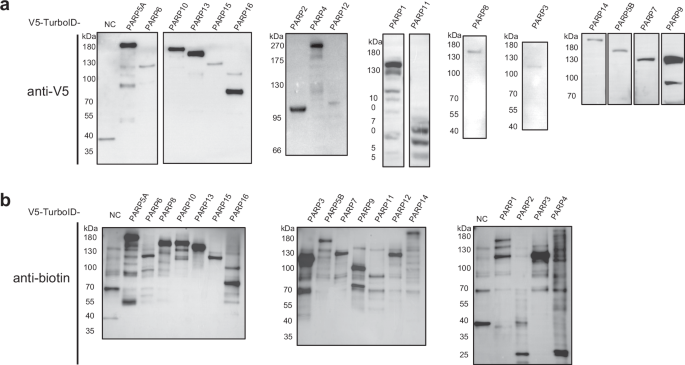
Detection of the overexpression and interaction of 17 PARP family members. (a) Western blot analysis of V5-tagged PARP family members. Cell lysates from cells overexpressing individual PARP proteins were probed with an anti-V5 antibody to detect the respective V5-tagged PARP proteins. The specific bands corresponding to each PARP member are shown. (b) Western blot analysis was used to detect biotinylated proteins. The same cell lysates were probed with HRP-conjugated anti-biotin antibody to detect biotinylated. NC: native control.
Mass spectrometry and statistical analysis
Peptidomic profiling was performed via liquid chromatography-mass spectrometry/mass spectrometry (LC-MS/MS), which combines an easy nLC 1200 and an Orbitrap Fusion mass spectrometer. The process began with the separation of peptides via a capillary column (75 μm × 150 mm) filled with C18 AQ stationary phase with a 1.9 μm particle size. Tryptic digests, each at a precision of 500 ng for mass spectrometry analysis, followed a gradient of 1–5 min, 5% to 8% ACN; 5–90 min, 8% to 40% ACN; and 90–110 min, 40% to 100% ACN. Data acquisition was performed on a Fusion mass spectrometer in positive mode, with all MS and MS/MS spectra captured in data-dependent mode, initiating with an MS full scan from 300 to 1800 m/z, followed by 10 MS/MS scans. The analysis utilized Proteome Discoverer version 2.4.1 for processing raw data files, with searches against the UniProt Homo sapiens reference proteome (Proteome ID: UP000005640), which contains 82,485 entries from 20,597 genes. The search parameters included trypsin digestion allowing up to two missed cleavages, carbamidomethylation of cysteine as a fixed modification, and variable modifications of oxidation (M), acetylation at the protein N-terminus, and biotinylation on lysine. The precursor mass tolerance was set at 10 ppm, the fragment mass tolerance was set to 0.6 Da, and the false discovery rate (FDR) threshold was maintained at less than 1% for all identified peptides and proteins, emphasizing the rigorous standards applied throughout the study to ensure the accuracy of peptide identification. The mass spectrometry proteomics data have been deposited in the ProteomeXchange Consortium (http://proteomecentral.proteomexchange.org) via the PRIDE28 partner repository with the dataset identifier PXD05274529.
In the data filtering process, NAguideR was first applied for imputing missing abundances (normalized) in mass spectrometry data, focusing exclusively on proteins modified by biotin. Initially, protein data with more than 50% missing values were excluded, and log2 transformation was performed on the numerical values. Subsequently, 23 different algorithms were utilized for data imputation. To refine the analysis, the weight ratio of the experimental proteomics standards was customized to CORUM:PPI as 1:3, and the imputation algorithm with the highest average rank (rank_mean) was selected. The specific imputation algorithm used for each proteome dataset is detailed in Supplementary Table 2. This approach ensures the consistency and reliability of the data processing procedure, thereby enhancing the accuracy of subsequent analyses. The FC was calculated as the ratio of the geometric mean protein abundance in the PARP-overexpression group to that in the vector control group. P-values were computed via a two-tailed t-test assuming equal variances. Proteins were considered significantly enriched if they met the criteria of p-value < 0.05 and log2FC > 1, thereby filtering out non-specifically bound proteins.
Western blotting and antibodies
For Western blotting, the pretreated streptavidin bead mixture was treated with 5 × protein loading buffer to reach a final concentration of 2.5× , supplemented with 2 mM biotin and 20 mM DTT, and then heated at 95 °C for 10 minutes. The samples were separated by 8% SDS-PAGE and transferred to PVDF membranes. An anti-V5 mouse monoclonal antibody (Beyotime, AF2894) and an HRP-linked anti-biotin antibody (Cell Signaling Technology, #7075) were used at a dilution of 1:2000 for detection in separate experiments.
Fluorescence microscopy
HEK293T cells at approximately 50% confluency in 20 mm confocal glass dishes were transfected with 5 µl of PEI and 1 µg of EGFP-tagged PARP plasmid. After 24 h of transfection, the cells were washed twice with PBS, followed by fixation with 4% paraformaldehyde at room temperature for 30 min. After fixation, the cells were incubated with 0.5% Triton X-100 for 5 min. Following this, the cells were stained with DAPI, and images were acquired using a Leica SP-8 STED 3X microscope at room temperature. PBS washes are performed twice after each reagent treatment step throughout the process.
Volcano plot analysis
Volcano plots were generated using RStudio with custom R scripts to visualize PARP interactors and pathway-specific enrichment. For multi-group analysis, volcano plots displayed log2 fold changes and -log10(p-values) of interacting proteins for each PARP member, with red points highlighting bait proteins and labels for the top 10 interactors. For pathway-specific analysis, single-group volcano plots highlighted proteins enriched in key biological pathways, with all enriched pathway proteins dynamically marked as red points and labeled. The R scripts for generating these plots are available on figshare30. Post-generation, manual adjustments were performed on the labels to enhance clarity and overall visual presentation of the plots.
Functional annotation and enrichment analysis
The list of interacting proteins was uploaded to DAVID online bioinformatics resource31 for GO/KEGG pathway analysis. Specifically, we selected the following options for analysis: GOTERM_BP_DIRECT, GOTERM_CC_DIRECT, GOTERM_MF_DIRECT, and KEGG_PATHWAY, to comprehensively explore biological process (BP), cellular component (CC), molecular function (MF), and relevant signaling pathways. The results were filtered based on a p-value threshold of less than 0.05 to retain significantly enriched terms (Supplementary Table 4). Heatmap was plotted by https://www.bioinformatics.com.cn (last accessed on 10 Oct 2024), an online platform for data analysis and visualization.
Shared protein-protein interaction network
To investigate the interaction dynamics among PARP family members, Cytoscape (version 3.1) was used to construct and visualize a PPI network. Interaction data for all PARP family members were imported, with node sizes scaled based on shared interactors across multiple PARP members, highlighting key interaction hubs. Distinct interactions between specific PARP members and their interactors were represented using color-coded edges, facilitating differentiation of unique interactions and shared pathways. This approach enabled analysis of both the individual and convergent roles of PARP members. The network was laid out using the “Edge-weighted Spring Embedded Layout” algorithm, with edge weights based on log2FC. Key layout parameters included a spring strength of 20, a spring rest length of 120, and a disconnected spring strength of 0.05 with a rest length of 2000. Each node underwent 200 iterations, with two passes performed for optimal representation. To enhance network readability, the “Bundle Edges” feature was applied, reducing visual clutter and improving clarity.
Data Records
The mass spectrometry-based proteomics data have been deposited to the ProteomeXchange Consortium via the PRIDE partner repository (Project Accession: PXD052745)29. The dataset consists of 57 raw files and 19 msf files, corresponding to 19 distinct experimental conditions as described in Fig. 1 and Methods. Specifically, these conditions include 2 TurboID control samples (TurboID-Vector-24h and TurboID-Vector-48h) and 17 TurboID-PARP experimental samples, each representing a different member of the PARP family (PARP1 through PARP16). All conditions were analyzed in biological triplicates, resulting in a total of 57 raw files and 19 msf files, with each condition comprising 3 raw files and 1 msf file. In addition, supplementary data files have been uploaded to the figshare30 to provide comprehensive resources for further analysis, such as PARP_PPI.cys: This Cytoscape-compatible file visualizes the shared protein-protein interaction (PPI) network of PARP family members. Nodes represent PARP members, with sizes indicating the number of shared interactors among them. Color-coded edges represent unique interactions, and the network layout uses an edge-weighted spring-embedded algorithm to reflect interaction strengths and connectivity. This file allows readers to explore and analyze the PARP interaction network in detail using Cytoscape. And there is also Plasmid_Sequences.zip: This compressed file contains the full nucleotide sequence validation data for pKO187-V5-TurboID and pKO187-EGFP expression vectors. These resources facilitate reproduction of our vector construction methodology.
Technical Validation
To ensure the reliability and robustness of our dataset on PARP-binding proteins generated via TurboID proximity labeling, we employed a comprehensive and rigorous validation strategy aimed at confirming the specificity of the identified interactions and ensuring reproducibility across biological replicates. Additionally, we verified the technical quality of mass spectrometry data.
Validation of protein expression and biotin labeling efficiency
The expression levels of each V5-TurboID-tagged PARP protein in HEK293T cells were verified using Western blot analysis with an anti-V5 antibody, which confirmed the expected molecular weights of the PARP-TurboID fusion proteins (Fig. 2a). Given the inherent variability in expression levels of different PARP proteins due to cell-specific effects, we conducted pre-experimental optimization to determine suitable expression time points, assessing variability by monitoring protein expression through time-course Western blot analysis. Based on these optimization studies, we implemented two distinct expression protocols with 24 h and 48 h expression windows. PARP proteins were assigned to either of these groups based on the expression levels observed during optimization. We performed three independent biological replicates for each PARP and corresponding control sample to ensure data reliability, which demonstrated consistent and robust results. Matched control groups were used to account for the variability associated with different expression time points. By comparing the experimental groups to their respective time-matched controls, we aimed to ensure that the endogenous protein expression levels between experimental and control groups were as similar as possible, thus minimizing the impact of temporal dynamics and enhancing the reliability of detected interactions.
To optimize the TurboID biotinylation time, we systematically tested labeling durations in 293 T cells expressing V5-TurboID-tagged PARP proteins. Our preliminary results, shown in Supplementary Figure 2, indicated that even at the 0 h time point, faint biotinylation signals were detectable for TurboID-PARP2 and TurboID-PARP3, likely due to trace endogenous biotin. However, this background signal was negligible compared to the progressive increase in biotinylation intensity observed with extended incubation. After 1 hour, the reaction reached saturation, as evidenced by plateauing band intensity in Western blot and stabilization of the mass spectrometry signals. This confirmed that 1 hour of TurboID labeling provided an optimal balance between sensitivity and specificity, aligning with the typical labeling duration reported in other studies using TurboID in mammalian cells23,32,33,34,35,36.
Biotinylation efficiency was evaluated by probing pretreated streptavidin bead with anti-biotin antibody, which demonstrated a marked increase in biotinylated proteins in cells expressing PARP-TurboID constructs compared to those transfected with the empty TurboID vector (Fig. 2b), confirming successful biotinylation and efficient labeling of proteins in close proximity to the PARP proteins. Enrichment of biotinylated proteins was achieved using multiple specificity-enhancing strategies, including washes with high-salt and detergent-containing buffers, which help to disrupt weak non-specific interactions, along with high-temperature denaturation to inactivate proteases. Ultrafiltration was subsequently employed to remove residual free biotin, minimizing competition between biotinylated proteins and free biotin for streptavidin bead binding. This multi-step approach resulted in a highly specific enrichment of proteins labeled by TurboID.
Statistical processing and normalization of LC-MS/MS data
DDA settings were optimized to enhance the detection of biotinylated peptides, with high-resolution MS1 scans followed by MS/MS scans of the most abundant precursor ions. Data normalization and imputation were crucial for minimizing technical variability. Missing values were imputed using NAguideR, which runs almost 23 different imputation algorithms. The imputation algorithm with the highest average rank (rank_mean) was selected to minimize bias and variance. Protein abundance values were normalized across all samples to account for variations in sample loading and instrument performance, thereby ensuring that differences in protein levels reflected biological variation rather than technical artifacts. Significant PARP interactors were identified based on a fold change greater than 2 (log2FC > 1) and a p-value below 0.05, calculated using a two-tailed Student’s t-test. During data processing, non-biotinylated proteins were excluded, ensuring that only biotin-modified proteins were retained, as these represent true interactors detected through the TurboID labeling reaction.
Differential analysis of PARP interactors
The enrichment of interacting proteins for each PARP family member was assessed through differential analysis and visualized using volcano plots (Fig. 3). These plots illustrate the significantly enriched interactors for each PARP based on fold change and statistical significance (p-value < 0.05 and log2FC > 1). The red data points represent the PARP proteins themselves, which rank among the most highly enriched interactors, indicating their strong expression levels and the high efficiency of the TurboID labeling reaction. This highlights both the effectiveness of PARP overexpression and the specificity of the TurboID labeling, ensuring robust detection of these proteins. The volcano plots provide a detailed overview of the interaction landscape for each PARP, highlighting the distinct and significant protein partners that are unique to each member. This representation effectively summarizes the interaction profiles for all PARP members, showing variability in the number of interactors across the PARP family, which underscores the potential specialization of different PARP members in cellular functions.
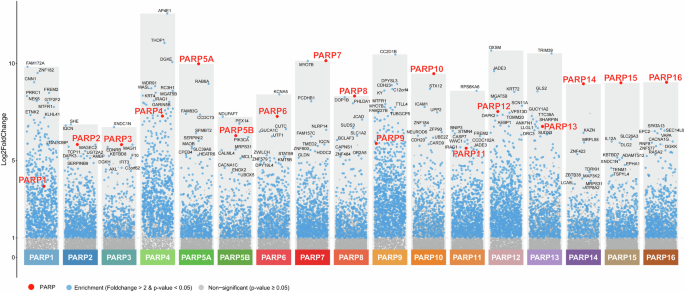
PARP interactome enrichment analysis using volcano plots. Volcano plots for each PARP member show enrichment of interacting proteins. Red data points indicate significant enrichment of each PARP protein, while the top 10 interacting proteins are labeled in black.
Validation of PARP subcellular localization fidelity
To corroborate the physiological relevance of our TurboID-tagged PARP chimeras, we systematically analyzed the subcellular distribution of EGFP-PARP fusion proteins in 293 T cells (Fig. 4). Consistent with canonical nuclear PARP functions, PARP1 and PARP2 exhibited predominant nuclear localization, aligning with previous reports in 293 T and related cell models37,38. PARP5A displayed cytoplasmic enrichment, which supports its established cytoplasmic role in mitotic regulation39. Notably, PARP6 demonstrated dual nuclear-cytoplasmic distribution, while the remaining PARP family members exhibited cytoplasmic localization under our experimental conditions, thus defining their spatial context within this cell model. Despite optimization attempts, EGFP-PARP7 fluorescence remained undetectable in both 293 T and HeLa cells, suggesting potential protein instability (data not shown), potentially reflecting protein instability. Crucially, the EGFP-PARP constructs share identical linker sequences and expression vectors with their TurboID counterparts (Methods), ensuring spatial congruence between tagging systems. These localization data collectively validate the subcellular framework from which our proximity-labeling interactomes were derived.
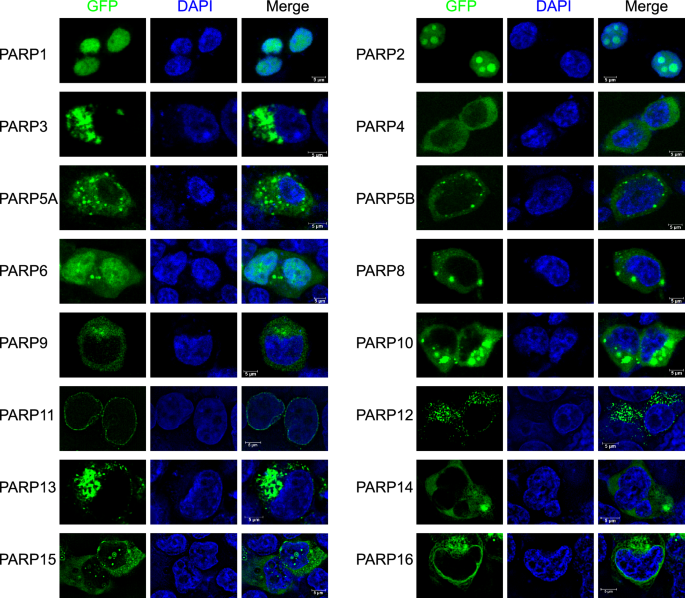
Subcellular localization of PARP family proteins in 293 T cells. Fluorescence microscopy images showing the expression and localization of EGFP-tagged PARP family proteins (except PARP7) in 293 T cells. The first column represents the green fluorescence (EGFP-PARP) indicating the localization of each PARP protein, while the second column shows the nuclei stained with DAPI (blue). The third column displays the merged images of EGFP-PARP and DAPI, with scale bars indicating 5 µm.
Functional validation of enriched pathways in PARP1 and PARP2 interactomes
To further evaluate the technical quality of our dataset, we performed functional enrichment analyses of the interactomes for PARP1 and PARP2, two prominent members of the PARP family, to determine whether the identified protein interactions align with known biological roles. The enrichment results revealed significant clustering of interacting proteins within key biological pathways, including DNA repair, chromatin organization, and RNA processing, consistent with the established functions of these proteins (Fig. 5). For PARP1, the DNA repair pathway was prominently enriched with key interactors such as BARD140, a critical partner in homologous recombination, MRE1141, a core component of the MRN complex involved in DNA damage recognition, and APEX142, an essential protein in base-excision repair (BER). These proteins play fundamental roles in maintaining genomic stability and reflect the high specificity of our TurboID proximity labeling approach in capturing biologically relevant interactions. Similarly, for PARP2, base-excision repair emerged as a major pathway, with interactors such as XRCC143, a key scaffold protein in BER, and POLG44, a mitochondrial DNA polymerase critical for repairing oxidative damage. Chromatin organization pathways were also significantly enriched for both PARP1 and PARP2 interactomes. PARP1-associated proteins included SUV39H145, a histone methyltransferase that promotes heterochromatin formation, and HMGN146, a non-histone chromosomal protein involved in nucleosome stability and transcriptional regulation. For PARP2, interactors such as EHMT147, a histone methyltransferase, and SFMBT148, a Polycomb group protein involved in chromatin remodeling and transcriptional repression, emphasized its role in chromatin structural maintenance. In addition, proteins involved in RNA processing were highly represented in the interactomes of both PARPs, with notable interactors such as SF3B249 (PARP1), a spliceosomal core protein, and GEMIN250 (PARP2), a critical component of snRNP assembly. These enrichment results provide a robust indication of the technical quality and biological relevance of our dataset, as the identified pathways and key interactors align with well-established roles of PARP1 and PARP2. These findings through pathway-specific bubble plots (Fig. 5a) and corresponding volcano plots (Fig. 5b), illustrating the enrichment significance and highlighting interactors within key pathways. These results not only validate the specificity and reliability of our dataset but also underscore its potential utility for understanding PARP-mediated biological mechanisms and interactions.
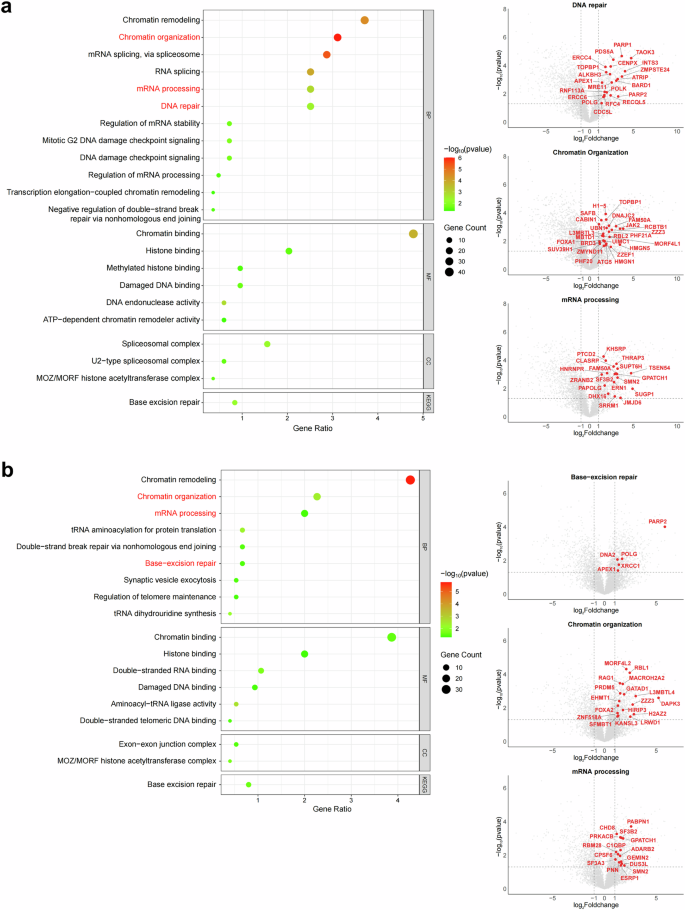
GO/KEGG enrichment analysis of PARP1 and PARP2 interactomes. The left panels in (a,b) show bubble plots of GO/KEGG enrichment for PARP1 and PARP2 interactomes. Bubble size indicates the number of enriched proteins, and color represents the statistical significance. The right panels show volcano plots for the highlighted pathways, with red data points indicating significantly enriched proteins.


Responses