Comprehensive understanding of context-specific functions of PHF2 in lipid metabolic tissues

Introduction
Lipid metabolism includes the storage, synthesis, and degradation of lipids to support cellular energy production1. Among many tissues, adipose tissues and liver act as a control tower of lipid metabolism1. Adipocytes serve as the primary energy storage by accumulating large amounts of fat in specialized lipid droplets2. When energy levels in the body are low, adipocytes break down stored lipids into fatty acids and glycerol, which are then released into the bloodstream for use by other tissues3. The circulating lipids are transported into the hepatocytes as free fatty acids. In the liver, free fatty acids can either undergo oxidation or esterification to form triglycerides (TG). Some of these TGs are utilized for the synthesis of protein components such as very-low-density lipoprotein (VLDL) and chylomicrons, while excess TGs are stored in the liver in the form of lipid droplets4. In addition, the liver synthesizes fatty acids, primarily through two transcription factors, sterol regulatory element-binding protein 1c (SREBP1c) and carbohydrate-responsive element-binding protein (ChREBP)5. When there is a disruption in lipid metabolism within metabolic tissues, it can lead to an accumulation of excess lipids, which can cause various metabolic disorders such as type 2 diabetes mellitus, obesity, non-alcoholic fatty liver disease (NAFLD), steatohepatitis, and liver cancer5. Therefore, it is crucial to identify the key factors that regulate lipid metabolism across different tissues.
PHF2, a member of the KDM7 histone demethylase family, demethylates di- or tri-methylated lysine 9 residue in histone 3 (H3K9) and relieves gene silencing via its Jumonji C domain-dependent demethylase activity6. Recent research has shown that PHF2 plays an important role in lipid metabolism. During the process of adipogenesis, PHF2 is recruited along with CCAAT-enhancer-binding protein alpha and delta (C/EBPα and C/EBPδ) to the promoter regions of their target genes such as Pparg, Cebpa, and Fabp4. This recruitment facilitates adipocyte differentiation by demethylating H3K9me2 near C/EBPα-binding regions7,8. PHF2 plays different roles in lipid metabolism in hepatocytes during various stages of liver disease. In the normal liver, PHF2 promotes fatty acid uptake and de novo lipogenesis rates by coactivating ChREBP, which leads to hepatic steatosis9,10. However, PHF2 plays a protective role in the liver by activating NF-E2-related factor 2 (NRF2), which helps to prevent steatohepatitis9. In liver cancer cells, PHF2 decisively acts as an E3 ubiquitin ligase for SREBP1c11, a crucial transcription factor that regulates lipogenic genes. This action effectively suppresses de novo lipogenesis. Given that the impact of PHF2 on lipid metabolism differs between tissues and disease progression, a comprehensive understanding of the role of PHF2 is necessary. However, previous studies primarily examined PHF2 in isolated tissues and there have been experimental variations between different datasets.
In this study, we comprehensively investigate the role of PHF2 in the genetic contribution to lipid metabolism in various tissues. We utilize cDNA-chip microarray data, publicly available clinical and proteomics datasets, as well as in vitro-based analyses to evaluate how PHF2 affects the regulatory machinery in different tissues. Through comparative analyses, we found that PHF2 plays an important role in enhancing adipogenesis or lipid storage in adipose tissue, as well as in early-stage liver disease by exerting epigenetic functions. Importantly, the function of PHF2 changes in late-stage liver disease. In this stage, PHF2 decreases lipid storage, lipid synthesis, the immune pathway, and disease progression. Therefore, we suggest that PHF2 could serve as a molecular checkpoint for metabolic disease stages. Our research findings may be useful in guiding the development of future treatments for metabolic disorders.
Results
A comprehensive investigation of the roles of PHF2 during adipogenesis
To investigate the role of PHF2 in adipocyte differentiation, we conducted a gene profiling analysis using a cDNA-chip microarray on 3T3-L1 cells. 3T3-L1 cells stably expressing sh-Control or sh-Phf2 were cultured with adipogenic stimuli. The chip detected a total of 31,939 genes, and the scatter and MA plots revealed significant changes in the pattern of gene expression between the selected groups (Supplementary Fig. 1A,B). After adipogenesis, PHF2 knockdown with adipogenic stimuli differentially increased 248 annotated genes and decreased 347 genes compared to sh-Control with a significant difference of p < 0.05 (Supplementary Fig. 1C). To identify the signaling pathways involved, we conducted gene ontology (GO) and Kyoto Encyclopedia of Genes and Genomes (KEGG) enrichment analyses for the downregulated genes. According to the GO analysis on biological processes, PHF2 knockdown suppressed several pathways including transcription and gene expression, differentiation of fat cells, erythrocytes, osteoblasts, embryonic placenta, and neuron development, as well as cell cycle pathways (Fig. 1A, left). Additionally, as per the KEGG pathway analysis, PHF2 knockdown reduced the AMPK, PPAR, and Rap1 signaling pathways, hormone regulation, Alzheimer’s and Parkinson’s diseases, non-alcoholic fatty liver disease, and neurodegeneration (Fig. 1A, right). To better understand the functions of PHF2, we further analyzed downregulated 347 differentially expressed genes (DEGs) using network analysis in the ClueGO application. PHF2 knockdown significantly suppressed the following pathways: myeloid, enucleate erythrocyte, and osteoblast differentiation; development of adipocyte tissue; Alzheimer’s disease; non-alcoholic fatty liver disease; the lipid metabolic pathway; the PPAR, Rap1, AMPK, and adrenergic pathways; cell proliferation and mitotic cell cycle; DNA biosynthetic process; transcription activity; and protein phosphorylation (Fig. 1B). These results suggest that PHF2 is positively associated with cell development, differentiation, hormonal regulation, and lipid metabolism during adipogenesis.

A comprehensive investigation of the roles of PHF2 during adipogenesis. (A and B) After screening genes based on statistically significant differences (p < 0.05, comparison between the sh-Phf2 and sh-Control groups after adipogenesis), the 347 downregulated genes were analyzed. (A) The downregulated genes in the sh-Phf2 versus sh-Control groups were analyzed by the gene ontology (GO)_biological process (BP) (left) and the Kyoto Encyclopedia of Genes and Genomes (KEGG) pathway (right). The top 20 enriched pathways are represented with a color bar and the color intensity represents statistical significance using p value. (B) The 347 downregulated genes in the sh-Phf2 group were analyzed using functional enrichment analysis via the ClueGO application. The color in the circle indicates the individual enrichment pathway. The semicircle represents the common pathways in functional enrichment analysis.
Next, we conducted a comparative analysis using 248 genes increased in the sh-Phf2 group compared with the sh-Control group (p < 0.05). An analysis of these upregulated genes was performed using GO and KEGG enrichment techniques. There was an increase in pathways related to tissue morphogenesis and development, DNA-templated transcription, immune signaling and response to viruses, somite specification, lipid signaling, cell migration, motility, and differentiation, and nervous development in the sh-Phf2 group compared to the sh-Control group (Supplementary Fig. 2A, left). Furthermore, the KEGG pathway analysis indicated an increase in genes related to focal adhesion, pathways in cancer and glioma, influenza A, NOD-like receptor, cytosolic DNA-sensing, PI3K-AKT, Rap1, and JAK-STAT signaling pathways, hepatitis B and C, and transcriptional misregulation in the sh-Phf2 group (Supplementary Fig. 2A, right). Based on the network analysis conducted using ClueGO application, sh-Phf2 cells were found to have high expression in various processes such as DNA-binding transcription, endochondral ossification, synaptic vesicle localization, tube morphogenesis, focal adhesion, and pattern specification (Supplementary Fig. 2B). This suggests that PHF2 knockdown promotes immune pathways related to response to infection and inflammation, cell structure processes such as morphogenesis, focal adhesion, and endochondral ossification, and cancer progression processes such as migration, proliferation, PI3K-AKT signaling, and transcriptional misregulation in adipocytes. Supplementary Fig. S2C-L presents the top five KEGG pathway maps from the low- or high-expressed DEGs in sh-Phf2 cells.
Clinical roles of PHF2 in patients with obesity, NAFLD, NASH, and liver cancer
To validate the biological pathways involved in PHF2 expressions, we evaluated the contribution of PHF2 in clinical samples. All publicly available NCBI GEO data were divided into PHF2-low and -high expression groups, and gene set enrichment analyses (GSEA) were performed. The result from genes of normal-weight and obese individuals (GSE55205, n = 23) revealed that the hallmark of histone 3 lysine 9 demethylase activity, which is the originally known function of PHF2, was closely correlated with PHF2 expression levels (Fig. 2A). In terms of lipid metabolism, PHF2 is positively involved in lipid droplet organization and adipogenesis (Fig. 2A). It has been suggested that adipocyte might activate gamma delta T cells and evade immune response via lipid antigen presentation12,13. Thus, we validate the crosstalk between PHF2 and immune response in the dataset (GSE55205). Interestingly, PHF2 expression is positively associated with gamma delta T cell activation (Supplementary Fig. 3A). However, the other immune pathways including adaptive immune response, B and T cell activation, the T helper cell type 1 and 2 pathways, and natural killer cell-mediated cytotoxicity showed no significant association with PHF2 (Supplementary Fig. 3A).
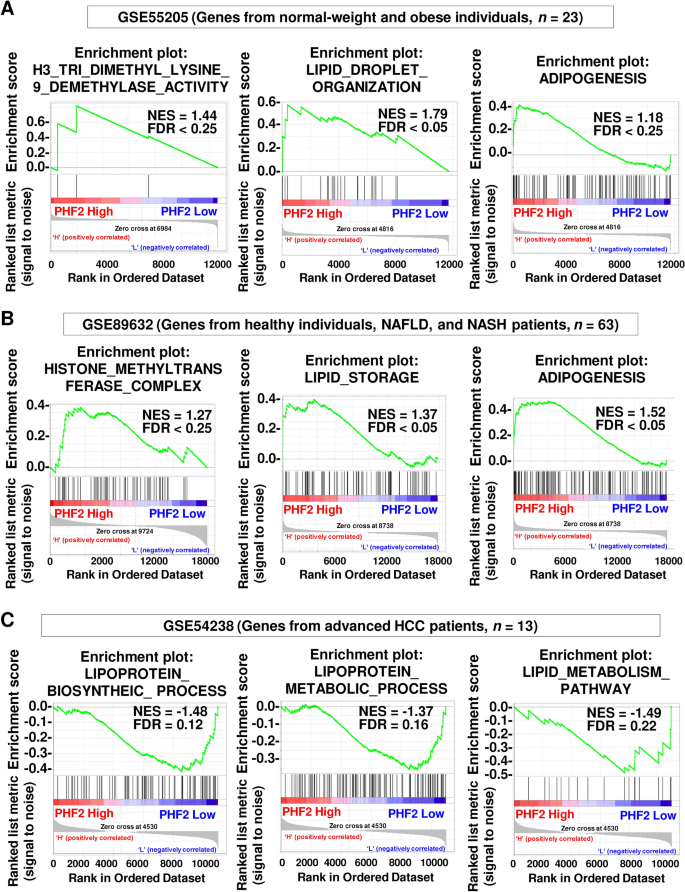
Clinical roles of PHF2 in patients with obesity, NAFLD, NASH, and liver cancer. (A–C) NCBI GEO datasets (GSE55205, GSE89632, and GSE54238) were selected and genes were divided into PHF2-low or -high expression groups. The GSEA plots present the relationship between PHF2 expression and histone demethylase activity, lipid droplet organization, lipid storage, adipogenesis, lipoprotein biosynthesis progress, lipoprotein metabolic process, and lipid metabolism pathway.
Because the liver is one of the important tissues involved in lipid metabolism1, we wondered if PHF2 is also associated the hallmarks of metabolic genes in patients with liver diseases. During liver pathogenesis, PHF2 mRNA level showed a gradual loss along the following disease gradient: healthy control → steatosis → non-alcoholic steatohepatitis (NASH) and cirrhosis → hepatocellular carcinoma (HCC) (Supplementary Fig. 3B). Genes from patients with NAFLD and NASH (GSE89632, n = 63) showed that PHF2 is positively involved in histone methylase complex, lipid storage, and adipogenesis (Fig. 2B). Next, we analyzed genes from patients with severe liver damage such as cirrhosis and HCC (GSE54238, n = 56). Unexpectedly, the correlations between PHF2 and genes involved in H3K9 methylation, histone methylase complex, and liver cancer with H3K9me3 were comparable (Supplementary Fig. 3C). However, when we analyzed genes from patients with advanced HCC only, the genes associated with lipoprotein biosynthesis progress, lipoprotein metabolic process, and lipid metabolism pathway showed negative correlations with PHF2 expression (GSE54238, n = 13) (Fig. 2C). In this dataset, the hallmarks of immune effector process, cell activation involved in immune response, and chemokine signaling pathway were highly enriched in PHF2-high expression group (Supplementary Fig. 3D). These results imply that PHF2 might have different functions across tissues and disease progression. In terms of oncogenic pathways, PHF2 expression showed positive correlation with the genes involved in TGF beta signaling and p53 pathway, which exhibit tumor suppressive effects (Supplementary Fig. 3E). PHF2 expression level showed positive correlation with downregulated genes in metastasis indicating that PHF2 acts as a tumor suppressor in liver cancer patients (Supplementary Fig. 3E).
Functional investigation of PHF2-interacting proteins in liver cancer cells
In order to investigate the role of PHF2 in severe liver disease, we analyzed publicly available mass spectrometry proteomics data (PRIDE repository #PXD044277) and observed 295 PHF2-interacting proteins. These proteins were identified through co-purification between two groups in the dataset, using immunoprecipitation with Flag or SA beads (Fig. 3A). Further analysis of protein–protein interaction networks revealed that PHF2 physically interacts with proteins related to several important biological processes such as lipid metabolic process (FDR = 0.001), regulation of gene transcription (FDR = 2.7 × 10⁻¹⁰), cell cycle (FDR = 2.3 × 10⁻⁴), HCC markers (FDR = 0.002), and immune system (FDR = 6.5 × 10–59) (Fig. 3B). These findings suggest that PHF2 may have the potential to play a role in regulating liver cancer progression.
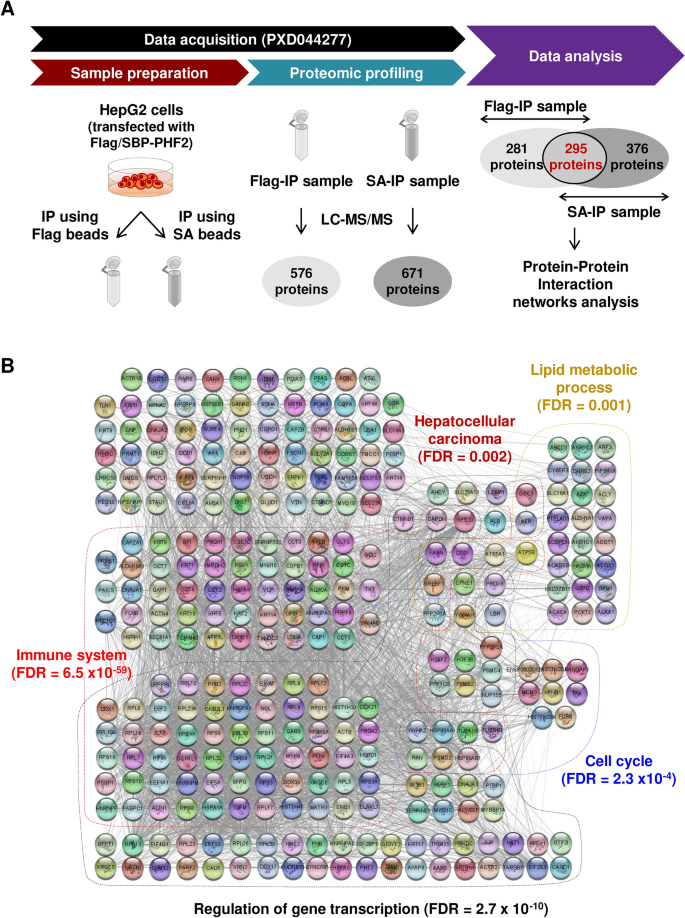
Functional investigation of PHF2-interacting proteins in liver cancer cells. (A and B) The diagram of data acquisition and analysis from the mass spectrometry proteomics data PXD044277. (A) In the dataset, co-expressed proteins in immunoprecipitation (IP) samples using Flag-affinity or streptavidin (SA) beads were identified. (B) Systemic network analysis was performed using Cytoscape software.
The suppressive role of PHF2 in immune cell infiltration in HCC tissues
Infiltration of immune cells into tumors is linked to better patient survival and predicts the effectiveness of immune therapies14. In a group of 371 patients with HCC, PHF2 was found to have positive correlations with the infiltration of various immune cells, including B cell (p = 6.4 × 10⁻⁵), CD4+ T cell (p = 3 × 10⁻¹⁰), CD8+ T cell (p = 7.4 × 10⁻⁴), natural killer cell (p = 1.6 × 10⁻³), myeloid dendritic cell (p = 5.7 × 10⁻¹⁰), macrophage (p = 2.6 × 10⁻¹¹), neutrophil (p = 5 × 10–11), T follicular helper cell (p = 2.7 × 10⁻³), and mast cell (p = 9.9 × 10⁻⁴) (Fig. 4A–J). However, PHF2 was negatively correlated with gamma delta T cell, which suppresses immune response (p = 4.2 × 10⁻³) (Fig. 4K). Additionally, the correlation between PHF2 and the infiltration levels of regulatory T cells was found to be comparable (p = 0.77) (Fig. 4L). These findings suggest that PHF2 enhances the presence of immune cells within tumors and plays a role in suppressing tumor growth in HCC.
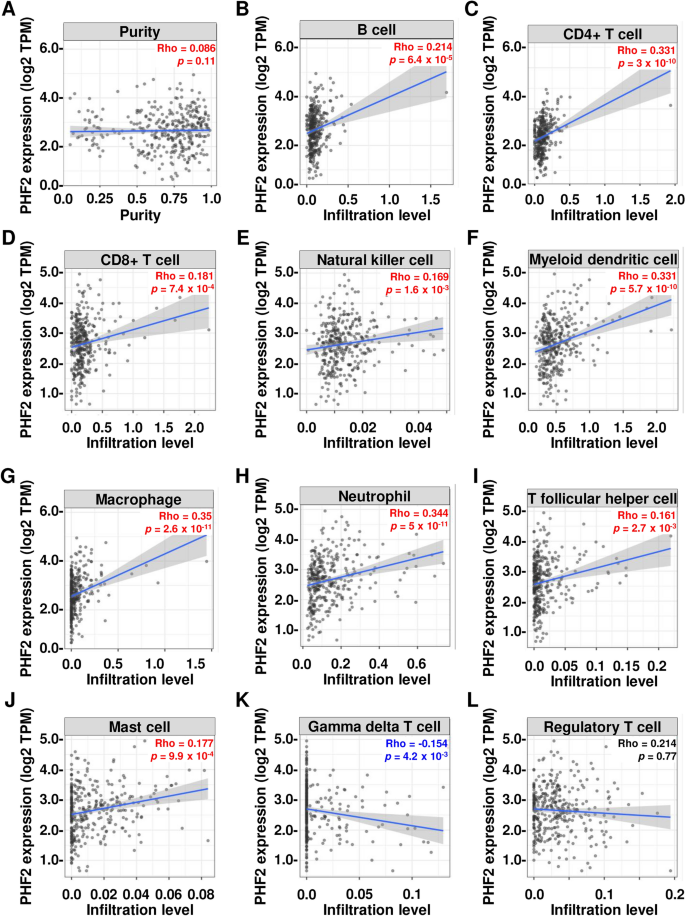
The suppressive role of PHF2 in immune cell infiltration in HCC tissues. (A–L) The plots of correlation between PHF2 expression and eleven intra-tumoral immune cells (B cell, CD4+ T cell, CD8+ T cell, natural killer cell, myeloid dendritic cell, macrophage, neutrophil, T follicular helper cell, mast cell, gamma delta T cell, and regulatory T cell) were shown. Rho and p values were obtained by purity-adjusted Spearman’s rank correlation test.
Assessment of bioinformatic analyses in adipocytes
Here, we comprehensively analyzed the role of PHF2 in lipid metabolism across adipose tissue.
We verified the expression patterns of genes in differentiated adipocytes, using Gene Ontology (GO) annotation. In differentiated 3T3-L1 cells, PHF2 knockdown significantly reduced the expression of genes linked to lipid storage (GO:0010884), lipid droplet organization (GO:0034389), and fat cell differentiation (GO:0045600), with the exception of Cebpb. Knocking down PHF2 significantly increased the expression of genes associated with B cell (GO:0002312) and T cell activation (GO:0050870) in differentiated 3T3-L1 cells (Supplementary Fig. 4A). To comprehensively examine the role of PHF2, we isolated human adipose-derived stem cells (hADSCs) from adipose tissue and effectively differentiated them into adipocytes using adipogenic stimuli. Upon the depletion of PHF2, the expression of genes associated with lipid metabolism was either reduced or remained comparable in differentiated hADSCs (Fig. 5A). While most mRNA levels for fat cell differentiation genes decreased, CEBPB remained unchanged, and mRNA levels for immune cell activation genes increased following PHF2 knockdown (Fig. 5A). Overexpression of PHF2 clearly resulted in the increase of not only FITM1 and PLIN2 involved in lipid storage, but also the genes related to fat cell differentiation (Fig. 5B). Conversely, the mRNA level of genes which are linked to the immune cell activation pathway declined significantly (Fig. 5B). The analysis of lipid metabolism-related genes clearly demonstrates that depleting PHF2 in adipocytes leads to a marked reduction in lipid content, as confirmed by Oil Red O staining (Fig. 5A, C). On the contrary, PHF2 overexpression significantly increased lipid accumulation in adipocytes, aligning with the elevated mRNA levels of the genes involved in lipid storage and fat cell differentiation (Fig. 5B, D). These results firmly validate the critical role of PHF2 in lipid metabolism, as previously indicated by bioinformatics analyses (Fig. 1).
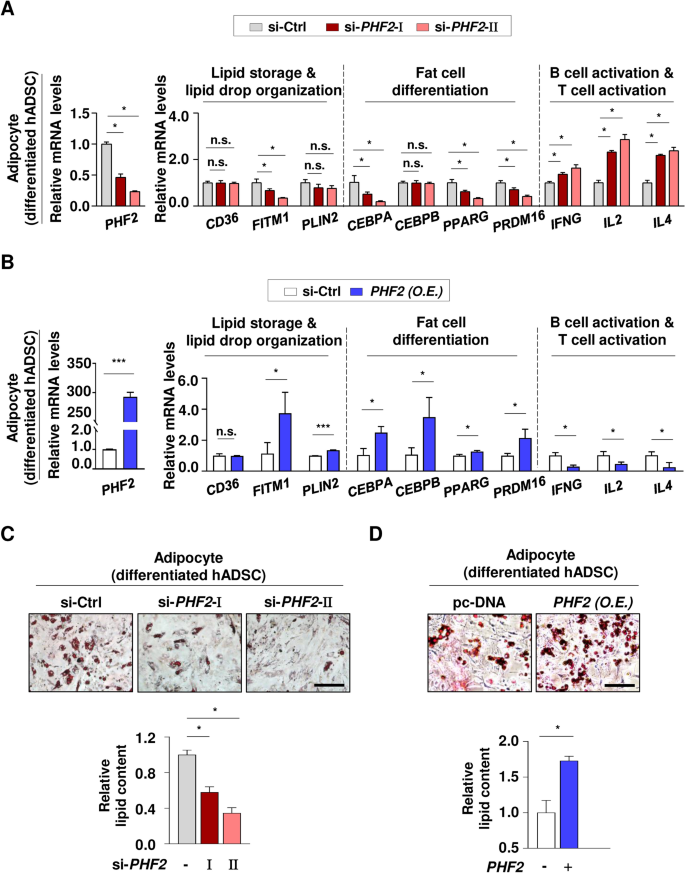
Assessment of bioinformatic analyses in adipocytes. (A) The differentiated hADSCs were transfected with the indicated si-RNAs and the mRNA levels were quantified using RT-qPCR relative to 18S mRNA. The list of genes related to lipid storage (GO:0010884), lipid droplet organization (GO:0034389), fat cell differentiation (GO:0045600), B cell activation (GO:0002312), and T cell activation (GO:0050870) was based on GO annotation. Mean ± SD (n = 3); *p < 0.05. (B) The differentiated hADSCs were transfected with PHF2 plasmid and the mRNA levels were quantified using RT-qPCR relative to 18S mRNA. Mean ± SD (n = 3); *p < 0.05, **p < 0.001, ***p < 0.0001. (C and D) The differentiated hADSCs were fixed with formaldehyde, stained with Oil Red O, and visualized using a microscope. For quantification, stained Oil Red O was dissolved in 100% isopropanol and its absorbance was measured at 500 nm. Scale bar = 200 µm. Mean ± SD (n = 3); *p < 0.05.
Assessment of bioinformatic analyses in hADSCs
In fat tissue, there are undifferentiated hADSCs which are located among adipocytes. Therefore, PHF2’s functions were confirmed in undifferentiated hADSCs under PHF2 knockdown and overexpression as well. In hADSCs under PHF2 knockdown, there was a clear decrease in mRNA levels of genes associated with lipid metabolism except for FITM1. Additionally, there was a notable reduction in the levels of CEBPA and CEBPB which are related to fat cell differentiation. Conversely, there was a pronounced increase in the expression of genes involved in B cell and T cell activation pathways (Fig. 6A). In hADSCs with overexpression of PHF2, there was an increase in the expression of FITM1, CEBPA, and CEBPB which are the genes related to lipid metabolism and fat cell differentiation (Fig. 6B). Conversely, the expression of genes associated with immune cell activation pathways decreased when PHF2 was overexpressed in hADSCs except for IL4 (Fig. 6B). Nile red staining confirmed a reduction in lipid content when PHF2 was knocked down in hADSCs, while lipid accumulation was observed in hADSCs with PHF2 overexpression (Fig. 6C,D). These results clearly demonstrate the significant impact of PHF2 on lipid metabolism in undifferentiated hADSCs, widening the rage of validated cells in adipose tissue and broadening the conclusions drawn from previous bioinformatics analyses (Fig. 1).
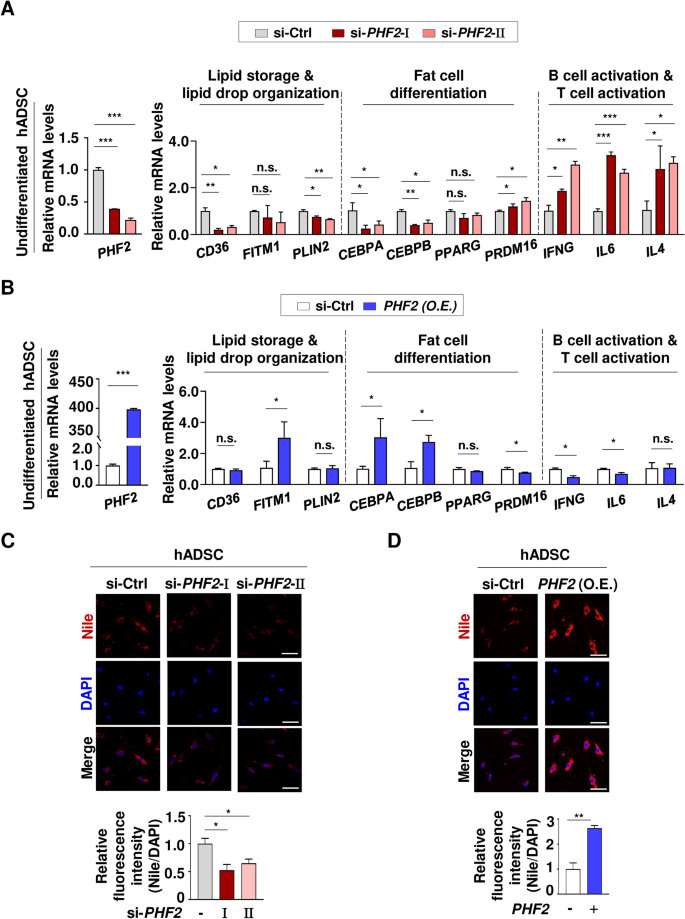
Assessment of bioinformatic analyses in hADSCs. (A) The undifferentiated hADSCs were transfected with the indicated si-RNAs and the mRNA levels were quantified using RT-qPCR relative to 18S mRNA. Mean ± SD (n = 3); *p < 0.05, **p < 0.001, ***p < 0.0001. (B) The undifferentiated hADSCs were transfected with PHF2 plasmid and the mRNA levels were quantified using RT-qPCR relative to 18S mRNA. Mean ± SD (n = 3); *p < 0.05, **p < 0.001, ***p < 0.0001. (C and D) The undifferentiated hADSCs were fixed with 4% PFA and stained with Nile red (1 mg/ml) and DAPI. Scale bar = 50 µm. Mean ± SD (n = 3); *p < 0.05, **p < 0.001.
Assessment of bioinformatic analyses and the role of the E3 ligase PHF2 in liver cancer
In our thorough examination of the previous bioinformatic analyses, we determined that PHF2 has markedly different effects on lipid accumulation and immune cell activation. This is clearly illustrated when contrasting the gene expression changes in human liver cancer cells with those in adipocytes and hADSCs (Figs. 5A, 6A, 7A). In HepG2 cells, the knockdown of PHF2 resulted in an increase in lipid metabolism-related genes, while decreasing genes associated with immune cell activation. This finding contrasts with the gene expression changes observed in adipocytes and hADSCs (Figs. 5A, 6A, 7A). The alterations in mRNA levels of genes linked to immune cell activation provide insights into the role of PHF2 as a regulator in the immune pathway, as suggested by bioinformatics analyses (Fig. 4). The knockdown of PHF2 resulted in no significant changes in the expression of genes associated with fat cell differentiation in HepG2 cells, in stark contrast to the observable decrease observed in adipocytes and hADSCs (Figs. 5A,6A,7A). When PHF2 was knocked down in HepG2 cells, lipid accumulation increased, while the amount of lipid decreased in adipocytes. The Oil Red O staining for lipids confirmed that PHF2 has varying effects on lipid accumulation in adipocytes and liver cancer cells (Figs. 5C, 7B). Furthermore, these results suggest that PHF2 plays different roles in maintaining lipid metabolic balance across different tissues.
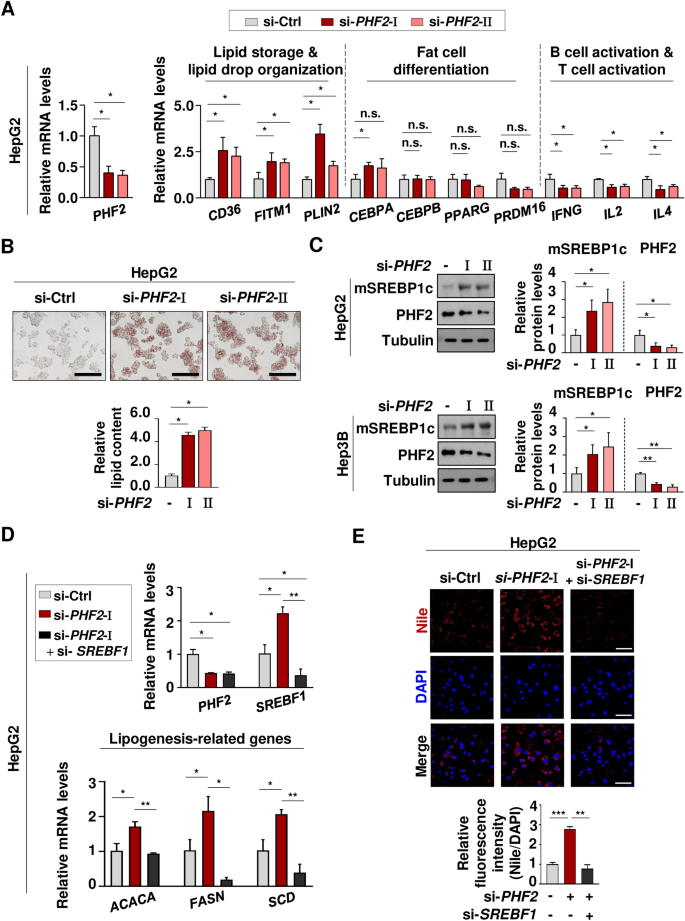
Assessment of bioinformatic analyses and the role of the E3 ligase PHF2 in liver cancer. (A) HepG2 cells were transfected with the indicated si-RNAs, and the mRNA levels were quantified using RT-qPCR relative to 18S mRNA. Mean ± SD (n = 3); *p < 0.05. (B) HepG2 cells were fixed with formaldehyde, stained with Oil Red O, and visualized using a microscope. For quantification, stained Oil Red O was dissolved in 100% isopropanol and its absorbance was measured at 500 nm. Scale bar = 200 µm. Mean ± SD (n = 3); *p < 0.05. (C) HepG2 cells were transfected with the si-RNAs and followed by western blotting. Mean ± SD (n = 3); *p < 0.05, **p < 0.001. (D) HepG2 cells were transfected with the si-RNAs and the mRNA levels of genes regulated by SREBP1c were quantified using RT-qPCR relative to 18S mRNA. Mean ± SD (n = 3); *p < 0.05, **p < 0.001. (E) HepG2 cells were fixed with 4% PFA and stained with Nile red (1 mg/ml) and DAPI. Scale bar = 50 µm. Mean ± SD (n = 3); *p < 0.05, **p < 0.001, ***p < 0.0001.
In assessing the bioinformatic analyses of lipogenesis, a new role of PHF2 as an E3 ubiquitin ligase for SREBP1c11 was established in HepG2 and Hep3B cells which are liver cancer cell lines. Immunoblotting revealed that the mature form of SREBP1c increased when PHF2 was knocked down (Fig. 7C). To verify the role of PHF2 in regulating lipogenesis via SREBP1c, we identified adipogenic genes that are in downstream of SREBP1c. Following the knockdown of PHF2, the mRNA levels of lipogenesis-related genes increased due to the accumulation of SREBP1c. However, when SREBP1c and PHF2 were knocked down simultaneously, the mRNA levels of lipogenic genes were restored, as these genes are downstream of SREBP1c (Fig. 7D). Similarly, an increased amount of lipid was observed in HepG2 cells stained with Nile red, following PHF2 depletion. However, when PHF2 and SREBP1c were knocked down together, the lipid levels were found to recover (Fig. 7E). The results decisively validate PHF2’s role as an E3 ligase for SREBP1c, clearly demonstrating its impact on lipid metabolism in cancer cells, as previously indicated in the bioinformatics data (Fig. 2).
Assessment of clinical role of PHF2 in liver cancer
3D culture chips can replicate the in vivo tumor microenvironment by allowing for less hypoxic spheroid formation. These chips are designed with a PDMS bottom, which enables oxygen to penetrate effectively. It takes about one day for the cells to assemble and form spheroids, as they are seeded into 1,700 microwells. In five days, the spheroids at the bottom can be collected to evaluate their cross sections (Fig. 8A). Thus, a 3D culture system was utilized to culture HepG2 cells, demonstrating the tumor suppressive function of PHF2 (Fig. 8). The average diameters of spheroids after 5 days were compared following the knockdown of PHF2 in HepG2 cells. The results showed that the depletion of PHF2 promoted liver cancer growth, resulting in increased diameters of the spheroids (Fig. 8B). Furthermore, immunofluorescence analysis of sectioned spheroids confirmed the promoted cancer growth. In the spheroids where PHF2 was knocked down, the expression level of Ki67, a well-known tumor marker, was elevated (Fig. 8C). In addition, the mRNA levels of proliferation-related genes increased in the groups where PHF2 was knocked down (Fig. 8D). Conversely, when PHF2 was overexpressed, we observed the opposite results (Fig. 8E–G). These findings suggest that PHF2 plays a critical role in suppressing liver cancer progression, supporting the previous bioinformatics data that indicated PHF2’s tumor-suppressive function in liver cancer (Fig. 3).
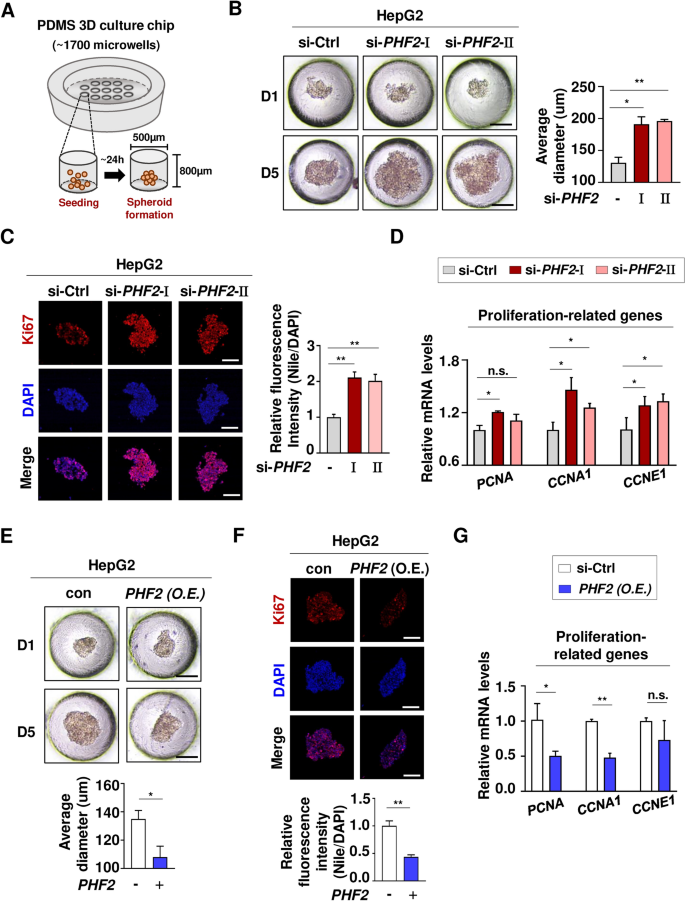
Assessment of clinical role of PHF2 in liver cancer. (A) Graphical scheme for a PDMS 3D culture chip showing spheroid formation in a microwell (B and E) Representative microscopic observation of spheroid formation of HepG2 cells cultured on PDMS 3D culture chips for 1 and 5 days after seeding. Scale bar = 100 μm. The average spheroid diameter on 3D culture chips was quantified by ImageJ. Mean ± SD (n = 3 independent experiments); *P < 0.05, **p < 0.001. (C and F) At day5, the spheroids were embedded into OCT compound and followed by immunofluorescence with Ki67 antibody and DAPI. Scale bar = 100 μm. Mean ± SD (n = 3); *p < 0.05, **p < 0.001. (D and G) At day5, the spheroids were collected, and the mRNA levels of proliferation-related genes were quantified using RT-qPCR relative to 18S mRNA. Mean ± SD (n = 3); *p < 0.05, **p < 0.001.
Discussion
The lipid metabolic pathway defects can lead to various health risks like obesity, diabetes mellitus, and fatty liver disease. Obesity refers to the accumulation of excessive lipids in adipose tissue and increase of the size and number of fat cells in the body15. The excess amounts of macronutrients in adipose tissue increase the risk of several diseases. This leads to insulin resistance, hyperinsulinemia, diabetes, and glucose intolerance16. Studies have shown that the development of adipose tissue is dependent on the activity of certain transcription factors, including members of PPAR and C/EBP families. During early adipocyte differentiation, the expression of C/EBPβ and C/EBPδ is rapidly induced, followed by the activation of PPARγ and C/EBPα17. This cascade supports adipocyte differentiation by enhancing the expression of genes such as PPARγ and C/EBPα.18. In addition, a metabolic syndrome can lead to various liver diseases, ranging from simple steatosis to NASH, cirrhosis, and liver cancer. One of the major liver conditions associated with metabolic syndrome is NAFLD, where more than 5% of the liver cells accumulate lipids19, increasing the risk of other liver diseases20. Two transcription factors of SREBP1 and ChREBP21, are responsible for de novo lipogenesis in the liver. They regulate the expression of lipogenic genes like FASN, ACC, SCD1, and ELOVL6, which increase lipid composition in the liver22.
PHF2 affects cellular metabolism and differentiation not only in adipocytes and hADSC but also in the liver. It enhances the transcriptional activities of C/EBPα, C/EBPδ, and PPARγ7,8, playing a crucial role in the process of adipogenesis. In this study, we have observed that PHF2 knockdown did not change the levels of CEBPB in both differentiated 3T3-L1 and adipocytes (Fig. 5A and Supplementary Fig. 4A). As per a previous publication, C/EBPβ is induced during early adipocyte differentiation and its level gradually decreases over time17. Thus, the levels of CEBPB can be comparable in fully differentiated adipocytes. However, under PHF2 overexpression, the mRNA level of CEBPB increased as the induced level of CEBPB became detectable during adipocyte differentiation. This increase can be attributed to the more significant change in PHF2 expression under overexpression, due to higher transfection efficiency, compared to the expression change observed under PHF2 knockdown (Fig. 5B). Similarly, the mRNA level of PLIN2 increased when PHF2 was overexpressed but it was not changed when PHF2 was knocked down. It can be considered that the result is also due to the bigger change of PHF2 expression under overexpression than knockdown (Fig. 5A,B). In case of undifferentiated hADSC, the lipid metabolism-related genes affected by PHF2 overexpression and knockdown were different from each other. This suggests that the types and degrees of pathways affected by PHF2 in hADSCs may vary depending on the expression level of PHF2. Also, the unexpected change of PRDM16 mRNA level was opposite to that of CEBPA and CEBPB, suggesting the possible existence of other pathways regulated by PHF2 in an opposing manner in undifferentiated hADSCs. Further studies about these results are demanded (Fig. 6A,B). In hepatocytes, PHF2 enhances fatty acid uptake and de novo lipogenesis rates via activating ChREBP. Furthermore, PHF2 transgenic mice exhibit increased hepatic glutamate and succinate-driven mitochondrial respiration9. There has been no significant impact on glucose or insulin tolerance rates observed in PHF2-knockout mice8. In human adipocytes and hADSCs, it was found that PHF2 knockdown led to a slight decrease in genes associated with lipid storage and lipid droplet organization, with the exception of a few genes (Figs. 5A and 6A). It is interesting to note that the genes associated with lipid storage and lipid droplet organization significantly decreased in mouse adipocytes, but increased in HepG2 cells (Fig. 7A and Supplementary Fig. 4A). These findings suggest that the impact of PHF2 may vary between different tissues and species. Since PHF2 behaves slightly differently in human adipocytes and hADSCs, despite both being part of adipose tissue, further research is needed to understand its various functions in the interplay between PHF2 and lipid metabolism across different cells and species.
According to Fig. 7A, PHF2 has negative correlation with lipid metabolism-related genes. Furthermore, PHF2 has been found to have E3 ubiquitin ligase activity towards SREBP1c which is an upstream of the genes involved in de novo fatty acid synthesis. Thus, PHF2 can control the protein level of SREBP1c, regulating the lipid accumulation in liver cancer cells11. In this study, it was validated by performing western blotting, RT-qPCR, and Nile red staining after knocking down PHF2 and SREBP1c in HepG2 cells (Fig. 7C–E). The lipogenesis-related genes and lipid accumulation increased under PHF2 knockdown, but they were reversed when PHF2 was knocked down alongside SREBP1c, suggesting that PHF2 can regulate lipid metabolism through its E3 ligase activity targeting SREBP1c.
PHF2 suppresses tumor growth in various tumors, including bladder, esophageal, head and neck, and prostate cancers23,24. Additionally, low PHF2 expression was found to be significantly associated with aggressive metastasis, high Ki67 expression levels, and poor survival rates in breast and renal cancer patients24,25. In colon cancer, PHF2 acts as an epigenetic coactivator of p53 playing an essential role in p53 signaling pathway26. To further confirm the tumor suppressive function of PHF2 in liver cancer, this study identified the expression of Ki67 and proliferation-related genes with 3D culture chips, which replicate the in vivo tumor microenvironment, thereby supporting the bioinformatics analyses (Figs. 3 and 8). Because an in vitro assay is only a small part of the whole in vivo systems, it may be beneficial to elucidate the regulatory mechanism of PHF2 both in vivo and in vitro systems, which could help us gain better insight into its precise functions during the progression of disease across different tissues. In addition, culturing liver cancer cells in 3D culture chips effectively replicates the in vivo tumor microenvironment. This method unequivocally demonstrates the direct influence of PHF2 on liver cancer progression within an environment that closely mirrors physiological conditions (Fig. 8).
The effect of PHF2 on immunity is still controversial and depends on the context. For instance, PHF2 targets and eliminates H4K20me3 on TLR4-responsive promoters, which enhances the expression of inflammatory genes such as Tnf and Cxcl10 in murine macrophage cells. On the other hand, PHF2 promotes H3K9me2 demethylation, which enhances the expression of Nrf2, a major transcription factor involved in defense against oxidative stress9. As a result, PHF2 plays a crucial role in safeguarding the liver from inflammation, oxidative stress, and fibrosis. Moreover, our research indicates that PHF2 boosts the immune pathways in HCC patients and liver cancer cells (Figs. 4 and 7A). In the case of patients with obesity, PHF2 exerts no significant effects on the activation of immune pathways except that of gamma delta T cells (Supplementary Fig. 3A). Meanwhile, PHF2 knockdown increases genes related to immune cell activation in differentiated adipocytes from human and mice, and hADSCs (Figs. 5A, 6A and Supplementary Fig. 4A). It is an interesting finding that PHF2 suppresses immune cell activation-related genes in adipocytes and hADSCs, while it upregulates the genes in HepG2 cells. Further research is needed on the opposing regulation of PHF2 according to each cell type.
Our research sheds light on the different roles of PHF2 in metabolic tissues. We have carried out comprehensive validation using bioinformatics, genomics, proteomics, and functional studies, which reveal that PHF2 enhances the accumulation of lipids or adipogenesis in adipose tissue through its canonical function as a transcriptional enhancer. However, in late-stage liver disease, PHF2 functions as a negative regulator of lipid metabolism through its non-canonical role as an E3 ligase for SREBP1c. Moreover, PHF2 behaves like a tumor suppressor in HCC tissues by enhancing immune cell infiltration. This comprehensive overview about tissue-specific functions of PHF2 is summarized in Table 1. Our study not only confirms the previously suggested role of PHF2 in adipogenesis and liver disease progression but also proposes PHF2 as a molecular checkpoint in metabolic disease stages. Therefore, developing therapeutics targeting PHF2 could be a promising way to control disease progression.
Methods
Cell lines
HEK293T cells (human embryonic kidney, No. CRL-3216) were obtained from the American Type Culture Collection (Manassas, VA, USA). HepG2 and Hep3B cells (human hepatocellular carcinoma, No. 88065) were obtained from the Korea Cell Line Bank (Seoul, Republic of Korea). 3T3-L1 preadipocytes were kindly gifted by Dr. Jae-Woo Kim (Yonsei University, Seoul, Republic of Korea). Cells were maintained in Dulbecco’s modified Eagle’s medium (DMEM), supplemented with 10% fetal bovine serum (FBS) and 100 units/mL of penicillin and 0.1 mg/mL streptomycin. Cells were incubated at 37 °C and 5% CO2.
Isolation of human adipose-derived stem cells
This study was approved by the Institutional Review Board of Seoul National University Hospital (approval No. H-1506-136-683). All experiments were performed in accordance with the guidelines of the Institutional Review Board of Seoul National University Hospital. Human adipose-derived stem cells (hADSCs) were isolated and tissues were chopped and digested in Hanks’ balanced salt solution (Sigma-Aldrich, St. Louis, MO, USA) with 0.2% collagenase type 1 (Worthington Biochemical Corporation, Lakewood, NJ, USA). After the inactivation of collagenase activity, the cell suspension was filtered through a 40 μm cell strainer (BD Biosciences, San Jose, CA, USA). After centrifuging at 420× g for 5 min, floating adipocytes were removed and only stromal vascular fraction cells were collected.
Short hairpin RNAs (shRNAs) and transduction
For gene silencing, the pLKO.1-puro vector was purchased from Sigma-Aldrich. Oligonucleotides targeting PHF2 were inserted into the vector using AgeI and EcoRI restriction enzymes. The viral vector was co-transfected with the pMD2-VSVG, pRSV-RRE, and pMDLg/pRRE helper plasmids into 80% confluent HEK293T cells, and the viral supernatant was collected. Plasmids were transfected into cells using Lipofectamine 2000 (11668–019, Invitrogen) according to the manufacturer’s instructions. 3T3-L1 cells were infected overnight with the virus in the presence of 6 μg/ml polybrene (sc-134220, Santa Cruz). Cells stably expressing viral vectors were selected using 5 μg/ml of puromycin (P8833, Sigma-Aldrich). To perform cDNA microarray analysis, we collected single colonies (n > 3) from heterogeneous clones in each group and subcultured them together. The sequences of sh-RNAs are listed in Supplementary Table 1.
Small interfering RNAs (siRNAs) and plasmid transfection
All siRNAs were synthesized by Integrated DNA Technologies (Coralville, IA). Cells were transfected with siRNAs using Lipofectamine RNAiMAX according to the manufacturer’s instructions (Thermo Fisher Scientific, Newark, DE). The sequences of siRNAs are listed in Supplementary Table 1. The plasmid encoding PHF2 protein was used for overexpression of PHF2. According to the manufacturer’s instructions, the plasmid was transfected into cells, using Lipofectamine 2000 (Thermo Fisher Scientific, Newark, DE).
Adipocyte differentiation
3T3-L1 cells stably expressing sh-Control and sh-PHF2 were differentiated with 1 μM dexamethasone (D17856, Sigma-Aldrich), 500 μM 3-isobutyl-1-methylxanthine (I5879, Sigma-Aldrich), and 10 μg/ml insulin (I9278, Sigma-Aldrich). After four days of treatment, the cells were maintained in DMEM with 10 μg/ml insulin; the media were changed every other day. After eight days of differentiation, cells were harvested for microarray analysis.
For hADSC differentiation, cells were incubated with1 μM dexamethasone, 500 μM 3-isobutyl-1-methylxanthine, 5 μg/ml insulin, and 200 μM indomethacin (Sigma-Aldrich). Cells were incubated for 14 d and the media were changed every two days.
Microarray analysis
After differentiation, total RNA was extracted from stable 3T3-L1 cells. Gene expression in samples was analyzed using DNA microarrays in a duplicate manner (each group contained n > 3 single colonies in one experiment). The synthesis of target cDNA probes and hybridization were performed using Agilent’s Low RNA Input Linear Amplification Kit (Agilent Technology, Santa Clara, CA, USA) according to the manufacturer’s instructions. The hybridized images were scanned using Agilent’s DNA microarray scanner and quantified using Feature Extraction Software (Agilent Technology).
Data analysis of genes from cDNA microarray
All data normalization and selection of fold-changed genes were performed using GeneSpringGX 7.3 (Agilent Technology). The averages of the normalized ratios were calculated by dividing the average of the normalized signal channel intensity by the average of the normalized control channel intensity. An unpaired t-test was used to determine differences in gene expression between the sh-Control and sh-Phf2 groups after adipogenesis. The significant difference between the duplicate samples was assessed based on previous studies27,28. p < 0.05 and fold change > 1.5 or < − 1.5 were defined as the cut-off criteria. The DEGs that could not be annotated with gene symbols were excluded. Scatter and MA plots were used to compare two unrelated groups.
Gene ontology (GO) functional enrichment analysis
Genes differentially expressed between the sh-Phf2 nd sh-Control groups with adipogenesis (p < 0.05) were used to functionally annotate the genes. Cytoscape 3.8.0 software and plug-in ClueGO were employed to annotate the GO functions of genes. The enrichment of the GO annotation function mainly included three aspects: biological processes, KEGG pathways, and wikipathways. GO functional enrichment was selected based on statistically significant differences (p < 0.05). The circle represents genes that have different expression levels and are enriched in functional pathways. Each color represents a different pathway.
KEGG pathway maps
Genes differentially expressed between the sh-Phf2 and sh-Control groups with adipogenic stimuli (p < 0.05) were plotted using the KEGG database (https://www.genome.jp/kegg/pathway.html) and presented by KEGG mapping tools (https://www.genome.jp/kegg/mapper/color.html). The found objects are marked in blue or red.
Gene set enrichment analysis
A computational method, GSEA, was used to determine statistically significant differences between the low- and high-PHF2 expression groups. A formatted GCT file was used as the input for GSEA algorithm v2.0 (http://www.broadinstitute.org/gsea). A false discovery rate (FDR) q-value of less than 0.25 was considered statistically significant.
Immune infiltration analysis
Tumor Immune Estimation Resource 2.0 (TIMER2, http://timer.cistrome.org/) was used to plot Spearman’s correlation coefficient between PHF2 expression and immune infiltration. The proportions of infiltrating immune cells were inferred using the CIBERSORT or TIMER algorithm.
RT-qPCR
After isolating total RNAs using TRIzol reagent (Invitrogen, Carlsbad, CA), cDNA was synthesized using an EasyScript cDNA Synthesis Kit (Applied Biological Materials, Richmond, BC, Canada). The cDNAs were amplified with BlasTaq™ 2X qPCR MasterMix reagent (Applied Biological Materials) using a StepOne Real-time PCR System. The sequences of primers are summarized in Supplementary Table 2.
Oil red O staining
After washing with phosphate-buffered saline (PBS), cells were fixed with 3.7% formaldehyde in PBS for 10 or 30 min and dehydrated with 60% isopropanol. Cells were stained with 0.5% Oil Red O (O0625, Sigma-Aldrich) for 1 h at room temperature. Next, the cells were washed with 60% isopropanol until the background was clear. For quantification, lipid accumulation in cells was quantified by eluting Oil Red O stain using 100% isopropanol, and optical density (OD) was measured at a wavelength of 500 nm.
Nile red staining
After washing with PBS, cells were fixed with 4% paraformaldehyde (PFA) for 10 min at room temperature. After fixation, each well of samples were incubated with Nile red (1 mg/ml) for 20 min at room temperature. The cells were stained with 4′,6-diamidino-2-phenylinodle (DAPI) for 1 min subsequently.
3D culture and immunofluorescence for sectioned spheroid
The 5 × 10⁵ HepG2 cells were seeded in each oxygen permeable PDMS plate after coated with 4% fluronic for 24 h. The cells were incubated in the plates for 5 days and average diameters were analyzed by Image J. Immunofluorescence staining was performed to the frozen sections of HepG2 3D spheroids. Spheroids collected from each plate were fixed with 4% paraformaldehyde for 30 min at 4 °C and washed three times with PBS. Then the spheroids were immersed into 10, 20, and 30% sucrose for 1 h, respectively. After being embedded into OCT compound (Sakura Finetek, Tokyo, Japan) and stored at − 80 °C for 24 h, the OCT blocks were cut into 10 μm thickness on a glass slide. The sectioned spheroids were washed with PBS.
and incubated with 1% BSA solution for 1 h. After the blocking step, they were incubated for overnight with Ki-67 primary antibody (1:200 dilution). After washing three times with 0.1% Tween-20 in PBS solution (PBST), they were incubated with secondary antibody (Alexa Flour 568, anti-rabbit, 1:400 dilution) for 1 h at room temperature. After that, spheroids were washed with PBST three times, and the nuclei were stained with DAPI (1:400 dilution) for 5 min before the immunofluorescence images were observed.
Statistical methods
All data were analyzed using Microsoft Excel 2010 (Microsoft), and results are expressed as the mean ± standard deviation (SD). The two-tailed unpaired Student’s t-test was used to compare the means of the two groups. CIBERSORT (DOI: (https://doi.org/10.1038/nmeth.3337) and TIMER (https://doi.org/10.1186/s13059-016-1028-7)) in the R package were used to evaluate the immune infiltration patterns. In all analyses, *p < 0.05 was taken to indicate statistical significance.
Western blotting
Cells were lysed in a 2× sodium dodecyl sulfate (SDS) sample buffer. The lysate was separated on SDS–polyacrylamide gels and transferred to Immobilon-P membranes (Millipore, Billerica, MA, USA). After cutting the membranes around the size of proteins, they were blocked with a 5% skim milk dissolved in Tris-saline solution containing 0.1% Tween 20 (TBST) for 1 h and incubated with a primary antibody overnight at 4 °C (Mouse monoclonal anti-SREBP1; BD Biosciences 557036 (1:500 dilution), Rabbit polyclonal anti-PHF2; Cell Signaling D45A2 (1:1,000 dilution), Mouse monoclonal anti-Tubulin; Cell Signaling 2146S (1:10,000 dilution)). After brief washing with TBST, the membranes were incubated with a horseradish peroxidase-conjugated secondary antibody for 1 h and visualized using an ECL Plus kit (Thermo Fisher Scientific, Waltham, MA, USA).


Responses