Conditioned serum-free culture medium accomplishes adhesion and proliferation of bovine myogenic cells on uncoated dishes

Introduction
The global food supply crisis1,2 has led to cultured meat technology attracting increasing attention3,4. Cultured meat is processed meat produced by collecting a small number of cells from livestock, mass culturing them, and then processing and shaping the cultured cells. It is expected to serve as an alternative food to traditionally farmed animal meat. Cultured meat can substantially reduce the number of livestock raised for food production. Consequently, it could help solve the economic, ethical, environmental, and public health issues associated with traditional livestock farming. However, according to a 2022 U.S. report, production costs for cultured meat are estimated to be ~$63 per kilogram considering the costs for culture medium production, bioreactor operation, cryopreservation infrastructure, employment, and transportation costs5. Considering that commercially available lean beef costs ~$6.17 per kilogram5, developing a cost-effective technology is essential for a sustainable cultured meat industry.
One of the main factors affecting the production cost of the cultured meat is the culture medium5. For example, fetal bovine serum (FBS), which is traditionally added to the culture medium6, and coating agents such as laminin 511, which is coated on the culture dishes for culturing the cultured meat constituent cells7,8, are expensive. Furthermore, not only is the supply of FBS unstable, but also the use of FBS fundamentally opposes the conceptual purpose of cultured meat9,10,11. Therefore, serum-free culture media must be developed that can produce the cultured meat constituent cells without using FBS and coating agents.
Kolkmann et al. identified commercially available serum-free and chemically defined media that induce the proliferation of bovine satellite cells in coated culture dishes12,13. Stout et al. developed a serum-free culture medium to induce the proliferation of bovine satellite cells on coated dishes14. These are powerful approaches that could potentially liberate cultured meat technology from its dependence on serum. However, coating agents remain indispensable. Although the development of a serum-free culture medium without using coating agents is an important goal in the cultured meat industry, cell adhesion and proliferation on uncoated dishes in serum-free culture media remain challenging.
This study aimed to develop a new serum-free culture medium that enables the adhesion and proliferation of bovine myogenic cells on uncoated culture dishes. To develop a serum-free culture medium, we focused on the liver, which secretes a metabolic profile that correlates with serum components15. Frank et al. reported that secretions from a human hepatoblastoma-derived cell line HepG2 tend to reflect a fetal liver16. Furthermore, co-culture, not feeder layer, with HepG2 and mouse fibroblast-like cell line NIH/3T3 enhances the liver-associated function of HepG217,18,19. Taken together, we hypothesized that by co-culturing HepG2 and NIH/3T3 cells, we could develop a serum-free culture medium rich in secreted products that would represent similar culture function as serum-containing culture medium. Therefore, we aimed to develop a new serum-free culture medium conditioned by the HepG2 and NIH/3T3 cells that can accomplish cell adhesion and proliferation of bovine myogenic cells without a culture dish coating.
Results
Development of a serum-free co-culture medium conditioned by HepG2 and NIH/3T3 cells
In serum-free culture medium, inducing adhesion and proliferation of bovine myogenic cells on the uncoated culture dishes remain difficult (Fig. 1a). To overcome these limitations, we developed a serum-free co-culture medium conditioned by HepG2 and NIH/3T3 cells (Fig. 1b). Briefly, both cell types were adhered to the same uncoated culture dish and then co-cultured in contact with each other in serum-free culture medium for three days. At the end of the culture, the culture medium was collected and centrifuged, and the supernatant was collected as serum-free co-culture conditioned medium. To evaluate the manufacturing method on the conditioned serum-free medium, we also developed different methods to develop the conditioned serum-free medium (Fig. 1c).

a Representative phase-contrast microscopy images of bovine myogenic cells cultured by a conventional serum-free culturing method. On uncoated culture dishes, serum-free culture medium does not induce cell proliferation or even cell adhesion. b Fabrication of the serum-free co-culture medium conditioned by human hepatocellular carcinoma-derived cell line HepG2 and mouse skin-derived cell line NIH/3T3 cells. c Fabrication of serum-free co-culture medium in different ways. In the co-culture group, HepG2 and NIH/3T3 cells were seeded together in same culture dish to perform contact co-culture. In the mix group, HepG2 and NIH/3T3 supernatants were mixed at a 1:1 ratio to create the culture medium after collecting supernatants from each culture dish with HepG2 and NIH/3T3 respectively. In the non-contact co-culture groups, HepG2 and NIH/3T3 cells were seeded on either the bottom surface of a cell culture insert and the bottom of a well plate, respectively. The group with HepG2 cells seeded on the insert bottom was designated as the non-contacted coculture (H-N) group, while the group with the reversed configuration, where NIH/3T3 cells were seeded on the insert bottom, was designated as the non-contacted coculture (N-H) group. In the diluted co-culture group, the culture medium prepared by contact co-culture was mixed with serum-free culture medium (DMEM + 1% PS) at a 1:1 ratio to create a 2-fold diluted culture medium.
On uncoated culture dishes, the developed medium accomplished cell adhesion and proliferation comparable to serum-containing medium
To evaluate the culture function of the developed medium on uncoated culture dishes, we prepared five experimental groups: cells were cultured in serum-free culture medium as the control(−) group, in serum-containing culture medium as the control(+) group, in developed serum-free co-cultured medium as the co-culture group, and in serum-free medium conditioned only by HepG2 cells or NIH/3T3 cells as the HepG2 or NIH/3T3 group. Cell adhesion and proliferation in these culture mediums were evaluated by measuring the number of cells after 24 h of culture and 72 h of culture, respectively.
The representative phase-contrast microscopy images are shown in Fig. 2a. Despite the lack of serum and coating substrates, cell adhesion and proliferation were observed in the co-culture group comparable to control(+) groups. HepG2 and NIH/3T3 groups showed more elongated cells, while the co-culture group showed more rounded cells, similar to the control (+) group. The number of cells were quantified, and results are shown in Fig. 2b. Interestingly, at 24 h of culture, the number of cells significantly increased in all experimental groups compared to control(−) group, whereas at 72 h of culture, the number of cells significantly increased only in the co-culture group and control(+) group compared to the control(−) group. The number of cells in the co-culture group was similar to that in the control(+) group at both 24 h and 72 h of culture.
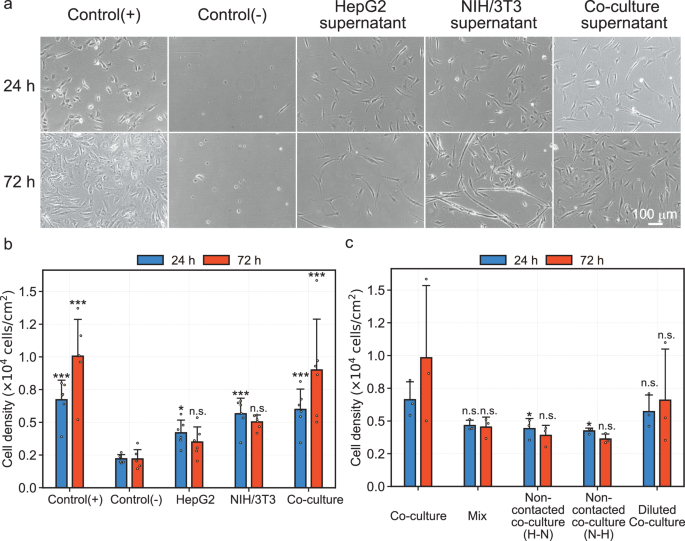
To control for biological variation, at least biological triplicates with different culture schedules were performed. Details on the replicates are described in the Methods section. a Representative phase-contrast microscopy images at 24 and 72 h of culture. b Bar graph representing cell density of samples cultured in each medium (n = 6, mean). Plotted dots indicate the respective biological replicated samples. Error bars indicate standard deviation. Blue and red bars represent samples at the 24 h and 72 h of culture, respectively. One-way ANOVA was performed, and the p-values at 24 and 72 h of culture were 5.79e-6 and 3.94e-6, respectively. For multiple comparisons, Dunnett’s test with two-sided testing was performed, with control (−) group at each time point as control (*p < 0.05, **p < 0.01, ***p < 0.001, n.s.: not significant). c Bar graph representing cell density of samples cultured in serum-free media using different fabricating approaches (n = 3, mean ± S.D.). Plotted dots indicate the respective biological replicated samples. Error bars indicate standard deviation. Blue bars represent samples at the 24 h of culture, and red bars represent samples at the 72 h of culture. Details of each approach were described in the Methods section and Fig. 1c. One-way ANOVA was performed, and the p-values at 24 and 72 h of culture were 0.0463 and 0.151, respectively. For multiple comparisons, Dunnett’s test with two-sided testing was performed, with co-culture group at each time point as control (*p < 0.05, **p < 0.01, ***p < 0.001, n.s.: not significant).
Figure 2c shows the quantitative result of the effect of different manufacturing methods on the serum-free co-culture medium. The number of cells in the non-contacted co-culture groups prepared using the non-contact co-culture method (Fig. 1c) were significantly decreased compared to the co-culture group prepared using the developed contact co-culture method. In addition, the number of cells in the non-contacted co-culture group and mix group, which was a simple mixture of HepG2 supernatant and NIH/3T3 supernatant, tended to decrease during the culture. On the other hand, the diluted co-culture group exhibited a trend similar to that observed in the co-culture group.
Developed medium tended to promote the expression of adhesion marker CD29 and proliferation marker Ki67 and suppress myogenic differentiation marker Desmin
To elucidate the effect of the developed serum-free co-culture supernatant on the cellular function of bovine myogenic cells, the expression of protein related to cell adhesion, proliferation and myogenic differentiation was evaluated using immunofluorescence and fluorescence staining.
To assess cell adhesion function, the expression of F-actin and CD29, which constitute the cytoskeleton and focal adhesion, respectively, was evaluated. Only the co-culture group maintained the similar expression level of CD29 as the control (+) group at 72 h of culture (Fig. 3a). Quantitative image analysis showed that the CD29 positive area ratio only in the control (+) and co-culture groups significantly increased compared to that in the control (−) group (Fig. 3b), even considering variations in cell numbers (Supplementary Fig. 1).
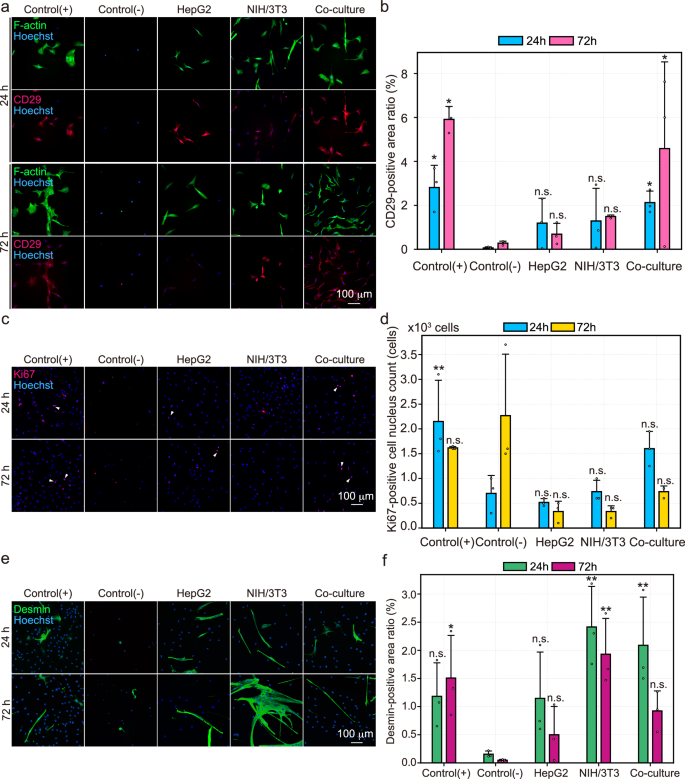
To control for biological variation, biological triplicates with different culture schedules were performed. Details on the replicates are described in the Methods section. a Representative images from fluorescence staining of F-actin and immunofluorescence staining of CD29. F-actin, CD29, and Hoechst are shown in green, red, and blue, respectively. The upper and lower panels show samples at the 24 h and 72 h of culture, respectively. b Bar graph of CD29-positive area ratio (n = 3, mean). Plotted dots indicate the respective biological replicated samples. Error bars indicate standard deviation. Blue and pink bars represent samples at the 24 h and 72 h of culture, respectively. One-way ANOVA was performed, and the p-values at 24 and 72 h of culture were 0.0534 and 0.0109, respectively. For multiple comparisons, Dunnett’s test with one-sided testing was performed, with control(−) group at each time point as control. c Representative images from immunofluorescence staining of Ki67. Ki67 is shown in red and Hoechst in blue. The upper and lower panel show samples at 24 h and 72 h of culture, respectively. White arrowheads indicate representative Ki67-positive cells. d Bar graph of Ki67-positive area ratio (n = 3, mean). Plotted dots indicate the respective biological replicated samples. Error bars indicate standard deviation. Blue and yellow bars represent samples at 24 h and 72 h of culture, respectively. One-way ANOVA was performed, and the p-values at 24 h and 72 h of culture were 4.89e-3 and 6.52e-3, respectively. For multiple comparisons, Dunnett’s test with one-sided testing was performed, with control(−) group at each time point as control. e Representative images from immunofluorescence staining of Desmin. Desmin is shown in green and Hoechst in blue. The upper and lower panel shows samples at 24 h and 72 h of culture, respectively. f Bar graph of Desmin-positive area ratio (n = 3, mean). Plotted dots indicate the respective biological replicated samples. Error bars indicate standard deviation. Green and purple bars represent samples at 24 h and 72 h of culture, respectively. One-way ANOVA was performed, and the p-values at 24 and 72 h of culture were 0.0159 and 8.43e-3, respectively. For multiple comparisons, Dunnett’s test with one-sided testing was performed, with control(-) group at each time point as control (*p < 0.05, **p < 0.01, ***p < 0.001, n.s.: not significant).
To assess cell proliferation function, the expression of Ki67, a prominent proliferation marker expressed in the cell cycles other than G0 phase, was evaluated. Only the co-culture group maintained a similar expression level of Ki67 as the control(+) group at 72 h of culture (Fig. 3c). Quantitative image analysis showed that the Ki67-positive area ratio in the co-culture group was higher than in the HepG2 and NIH/3T3 group (Fig. 3e), even considering variations in cell numbers (Supplementary Fig. 2).
To assess myogenic differentiation of the bovine myogenic cells, the expression of Desmin, an intermediate filament of the cytoskeleton and a muscle-specific marker, was evaluated. Interestingly, the co-culture and HepG2 groups maintained similar levels of Desmin expression as the control(+) group, although only the NIH/3T3 groups showed a marked increase in the expression level at 72 h of culture (Fig. 3e). Quantitative mage analysis showed that the Desmin-positive area ratio in the co-culture and HepG2 groups tended to decrease compared to that in the control(+) group at 72 h of culture, whereas that in the NIH/3T3 group tended to increase (Fig. 3f), even considering variations in cell numbers (Supplementary Fig. 3).
Co-culturing induced island-like self-organization of HepG2 and NIH/3T3 cells and contributed to stable culture
To characterize the developed medium, the morphological characteristics of the co-culturing system and the culturing stability of the co-culture medium were evaluated. The morphological structure of the co-culture systems was qualitatively evaluated using immunofluorescence staining for albumin or E-cadherin to visualize and distinguish HepG2 and NIH/3T3 cells, respectively. A passage culturing test was performed to evaluate whether bovine myogenic cells can be passaged using the developed serum-free co-culture medium.
Immunofluorescence staining images of albumin are shown in Fig. 4a. Interestingly, HepG2 cells in monoculture were located homogenously, whereas in co-culture, cell arrangement was localized. In addition, albumin secretion in the co-culture was increased compared to that in the monoculture. Figure 4b shows immunofluorescence staining images of E-cadherin in the co-culture system. Notably, the island-like structures were organized with the E-cadherin-positive cells. Taken together, these results indicated that the serum-free co-culture system using HepG2 and NIH/3T3 cells induced the island-like self-organization.
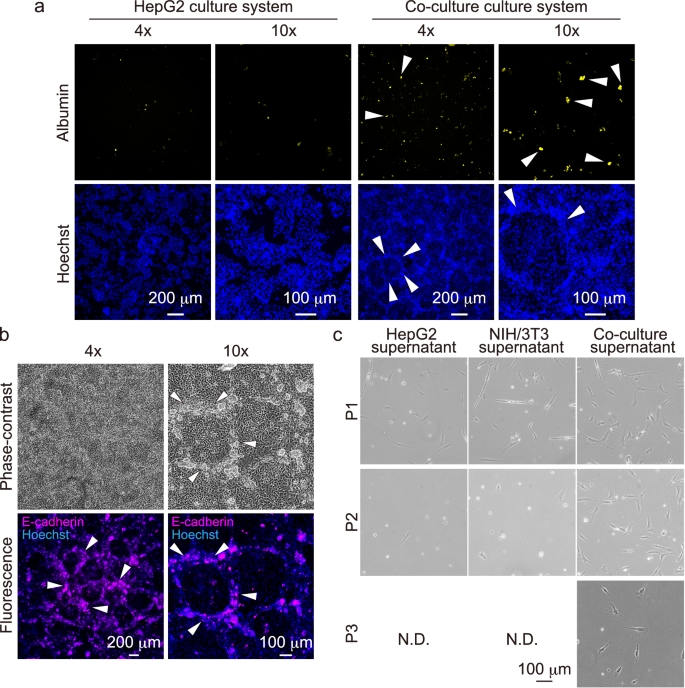
To control for biological variation, biological triplicates with different culture schedules were performed. Details on the replicates are described in the Methods section. a Representative image from immunofluorescence staining of albumin in monoculture of HepG2 cells and co-culture systems of HepG2 and NIH/3T3 cells. White arrowheads indicate characteristic cellular localization. b Representative phase-contrast microscopy images of the co-culture system and representative image from immunofluorescence staining of E-cadherin. White arrowheads indicate characteristic cellular localization. c Representative phase-contrast microscopy images of the passaging culturing test. The upper, middle, and lower panels show P1, P2, and P3, respectively. Samples in which most of the cells have died, and the passaging process can no longer be performed, are marked as N.D.
Figure 4c shows representative phase-contrast images of the passage culturing test. In the HepG2 and NIH/3T3 groups, almost all cells died after the first passage. On the other hand, the cells in the co-culture group could be cultured after passaging twice. The developed medium exhibited stable culture function.
Identification of the characteristic nutrients by component analysis of culture medium
To identify the characteristic nutrients in the developed serum-free co-culture medium, nutritional composition analysis was performed. For the composition analysis, hierarchical clustering and principal component analysis of the culture medium composition, volcano plotting of each component, and quantitative enrichment set analysis of metabolites were performed.
Figure 5a shows the clustering result of the metabolites. Interestingly, nutrient composition of the HepG2, NIH/3T3, and co-culture groups completely differed from that of the control(-) and control(+) groups. The results of principal component analysis are shown in Fig. 5b and Supplementary Fig. 4. The composition of the co-culture group was intermediate between the control(-) and control(+) groups on the first principal component axis, and between the HepG2 and NIH/3T3 groups on the second principal component axis.
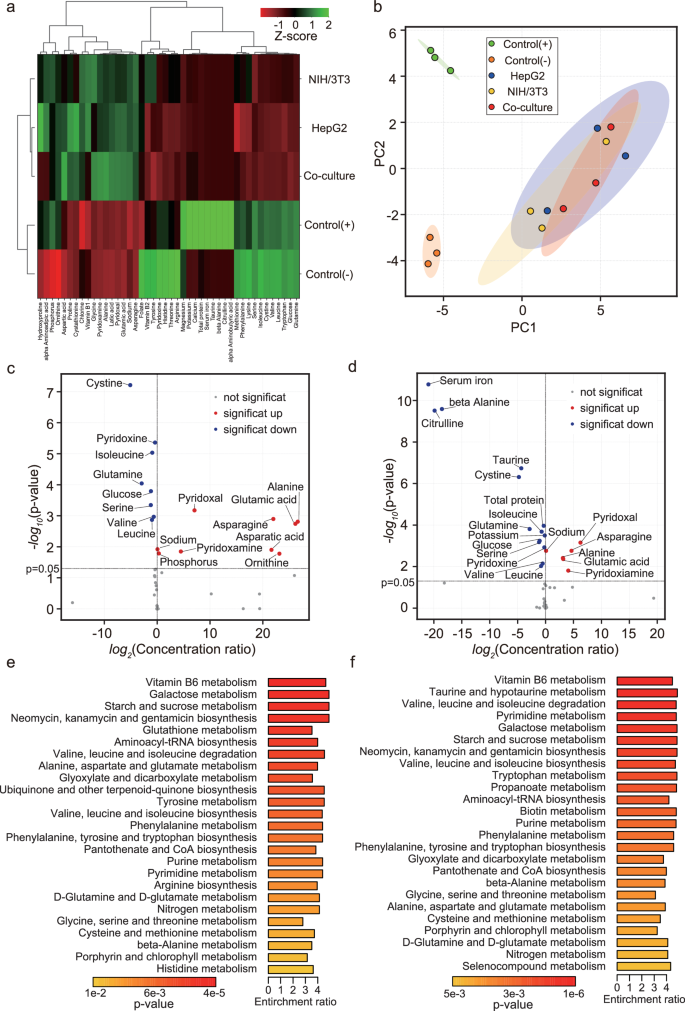
To control for biological variation, biological triplicates with different culture schedules were performed. Details on the replicates are described in the Methods section. a Cluster map of the culture medium composition. Red and green indicates low and high content, respectively. b Principal component analysis of the culture medium composition. Green, orange, blue, yellow, and red dots indicate control (+), control (−), HepG2, NIH/3T3, and co-culture group, respectively. Plotted dots in same color indicate the respective biological replicated samples in the same group. The ellipses drawn in the scatter plots represent the mean±2×standard deviation. c Logarithmic scatter plots of concentration ratios and p-values between control (−) and co-culture groups. d Logarithmic scatter plots of concentration ratios and p-values between control (+) and co-culture groups. Red, blue, and gray dots indicate components that are significantly increased, significantly decreased, and with no significant differences, respectively. The p-values were calculated by multiple comparison tests using the Tucky–Kramer method, and the probability of significance was set at 0.05. e Results of quantitative enrichment set analysis of metabolites between control (−) and co-culture groups (top25). f Results of quantitative enrichment set analysis of metabolites between control (+) and co-culture groups (top25). The gradient from orange to red indicates an increase in the p-value. Length of the bars indicates the enrichment ratio.
Scatter plots of the concentration ratios and p-values of the multiple comparison statistics are shown in Fig. 5c, d, and Supplementary Fig. 5. The results of multiple comparison tests showed that the developed serum-free co-culture medium contained alanine, asparagine, asparatic acid, glutamic acid, ornithine, phosphorus, pyridoxal, pyridoxamine, and sodium significantly more than in control(-) medium (Fig. 5c). In addition, the developed serum-free co-culture medium contained significantly more alanine, asparagine, glutamic acid, pyridoxal, pyridoxamine, and sodium than the control(+) medium, that is serum-containing culture medium (Fig. 5d).
The results of the enrichment analysis, which analyzed the component functions, are shown in Fig. 5e, f, and Supplementary Fig. 6. Compared to control(-) and control(+) medium, co-culture medium showed the most different function in relation to Vitamin B6 metabolism.
Evaluation of the culture function of the characteristic nutrients under serum-free culture of bovine myogenic cells
Component analysis and statistical analyses of the culture medium revealed that the developed serum-free co-culture medium had a different composition from that of the serum-containing culture medium and contained several characteristic components. We evaluated the culture function of the top seven nutrients (alanine, asparagine, asparatic acid, glutamic acid, ornithine, pyridoxal and pyridoxamine), which were present in significantly higher concentrations in the co-culture medium.
Figure 6 shows representative phase-contrast images of bovine myogenic cells in the serum-free culture medium to which each nutrient was added. The results showed that the six nutrients, except asparatic acid, contributed to the induction of cell adhesion under serum-free conditions on uncoated culture dishes at 24 h of culture. Surprisingly, asparagine, glutamic acid, and pyridoxamine induced cell proliferation at 72 h of culture. However, cell adhesion force in all sample was weak and cells were easily detached during washing for quantitatively evaluating the number of cells.
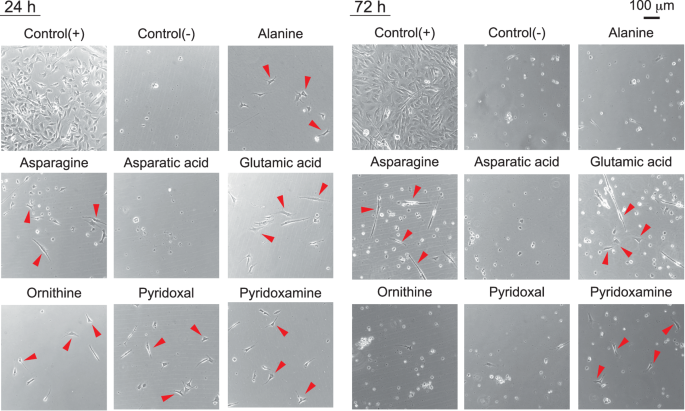
To control for biological variation, biological triplicates with different culture schedules were performed. Details on the replicates are described in the Methods section. The left and right columns show representative phase-contrast microscopy images at 24 and 72 h of culture, respectively. Supplemented nutrient names are shown above the microscope image. Red arrowheads indicate representative cells that could be cultured even under the serum deficiency condition on the uncoated culture dish.
Discussion
We successfully developed a serum-free co-culture medium conditioned by HepG2-NIH/3T3 cells, which can induce stable cell adhesion and proliferation of bovine myogenic cells on uncoated culture dishes comparable to serum-containing culture medium (Figs. 1, 2 and 4c). The co-culture medium promoted the expression of cell adhesion and proliferation markers, and suppressed the expression of myogenic differentiation markers as well as serum-containing culture media (Fig. 3). In addition, the self-organization of island-like structures was observed in the co-culture system (Fig. 4a, b). Importantly, the self-organization observed in Fig. 4a, b was not observed in the HepG2 system, but only in the co-culture system. Besides, the albumin secretion in the co-culture system was qualitatively higher than in the HepG2 system. These results suggest that the interaction between HepG2 and NIH/3T3 cells promoted self-organization, enhancing the liver-related functions of HepG2 cells. This is consistent with the findings of previous studies, which reported that the co-culture of HepG2 and NIH/3T3 cells promotes self-organization through cell-cell interactions and enhances hepatocyte functions such as albumin secretion17,18,19. Secretions from HepG2 cells tends to reflect those from the fetal liver16. Furthermore, Stefanius et al. found that human hepatocarcinoma cell exosomes act as initiators of NIH/3T3 cell transformation20. The transformation of NIH/3T3 cells by HepG2 secretions could promote the secretion of a fetal-like component by HepG2 cells thorough cell-cell interactions, leading to the secretion of serum-like components. Taken together, the results of the present and previous studies suggest that the island-like self-organization by contact cell-cell interactions between HepG2 and NIH/3T3 cells might promote the secretion of serum-like components, which contribute to cell adhesion, cell proliferation, and maintenance of the undifferentiated state of myogenic cells similar to those in serum-containing culture medium. Although further detailed verification is required, Fig. 3f suggested that the secretion of NIH/3T3 cells tended to promote the differentiation of bovine myogenic cells, and the secretion of HepG2 cells tended to suppress the differentiation of bovine myogenic cells. In light of these findings and previous researches showing that co-culture of NIH/3T3 cells and HepG2 cells enhances the liver-related functions of HepG2 cells17,18,19, it was suggested that the co-culture medium suppressed the differentiation of bovine myogenic cells by producing more secretions that inhibit differentiation of bovine myogenic cells due to the enhancement of liver-related functions of HepG2 cells, leading to suppression of the differentiation in the co-culture medium.
Interestingly, the component analysis of the culture medium revealed that the composition of co-culture medium was clearly different from that of the serum-containing culture medium (Fig. 5a, b). Supplementary Fig. 4 shows that the first principal component, with a contribution of ~52%, may represent factors involved in nitric oxide synthesis activity, such as taurine21, citrulline22, folate23 and arginine24. The second principal component, with a contribution of ~20%, may represent factors involved in antioxidant functions, such as pyridoxal25, glutamic acid26, valine27 and cystine28. Although the composition of the co-culture medium was completely different from that of the serum-containing culture medium, it may contribute to cell adhesion and proliferation by promoting nitric oxide synthesis functions and antioxidant functions.
Multiple comparison tests showed that the developed medium contained some nutrients significantly more than the serum-containing and serum-free culture medium (Fig. 5c, d). To evaluate the culture function of each identified nutrient, we assessed serum-free basal culture medium supplemented with each nutrient. The results showed that the supplementation of pyridoxamine, glutamic acid and asparagine promoted cell adhesion and proliferation of bovine myogenic cells on uncoated culture dishes, even without serum (Fig. 6). Pyridoxamine is a compound classified in Vitamin B6 and is known as a factor that can inhibit oxidative stress-induced damage29,30,31. Glutamic acid, a non-essential amino acid, can regulate their antioxidant effect26,32,33. Furthermore, asparagine acts a role as an amino acid exchange factor that is important for cell proliferation34 and can regulate glucose uptake under glutamine depletion35. Arparagine and glutamic acid activate the rapamycin target proteins mTOR26,33,34, which is known to be an important factor in regulating the muscle differentiation and remodeling36. Although the detailed mechanism is currently unknown, several previous studies have reported that mTOR is also involved in the expression of cellular adhesive proteins, such as integrins and filamin A37,38,39. Therefore, the protective function against oxidative stress by the pyridoxamine, the antioxidant effect by the glutamic acid, the uptake energy function by asparagine, and the regulation of cellular adhesion and differentiation status by glutamic acid and asparagine, may have contributed to cell adhesion and proliferation of bovine myogenic cells in serum-free culture on uncoated culture dishes. However, at the same time, these results suggested that our medium was not developed by only these candidate factors alone. In the future, further verification of the mechanism is required, considering the possibility that the culture medium is consisted by the higher-order interaction of candidate factors.
The advantage of this study is that our medium was manufactured only using a low-cost commercial medium and cell lines. Although some approaches have been challenging to achieve serum-free culture by using expensive biomolecules such as coating agents12,13,14 or recombinant proteins such as growth factors40, the cost of biomolecule and protein synthesis is directly related to the high cost of cultured meat41,42,43,44. The serum-free culture medium proposed in this study can reduce all the costs associated with these synthesizes. As back-of-the-envelope calculations on potential cost, our culture medium can reduce costs by ~93% compared to conventional methods (Supplementary Table 3). To the best of our knowledge, this is the first study to establish a serum-free culture method without any coating agent and additional recombinant protein. Therefore, the proposed method is expected to contribute to lower costs in the development of cultured meat. In addition, optimizing the experimental conditions such as co-culture conditioning period and cell density is expected to lead to the development of more efficient methods for producing the culture medium in the future.
On the other hand, the limitations of this study include that, compared to the control (+) group serum medium, glucose tended to be consumed, and lactic acid accumulated (Supplementary Fig. 8). The consumption of glucose and accumulation of lactic acid often negatively affect cell culture. Therefore, by adding a process to remove these components, the culture performance of our medium could be further improved. Although we utilized HepG2 cells, which previous research has shown to secrete abundant substances16, establishing a method to harvest bovine liver cells that balances both safety and the secretion of abundant substances would bring us closer to realizing a sustainable cultured meat industry.
In conclusion, we developed a serum-free co-culture medium conditioned by HepG2 and NIH/3T3 cells and demonstrated that the proposed culture medium could induce not only cell adhesion but also proliferation of bovine myogenic cells even on uncoated culture dishes as well as serum-containing culture medium. Furthermore, we revealed that pyridoxamine, asparagine, and glutamic acid highly contained in the co-culture medium may contribute to the cell adhesion and proliferation in a serum-free medium without any coating agents. The proposed serum-free culture method, which uses only a low-cost commercial medium and cell line, will contribute to a significant cost reduction in cultured meat production. In addition, the identification of some components for the cell adhesion and proliferation of bovine myogenic cells on uncoated culture dishes under the serum-free conditions could be an important step toward developing a completely animal-free and fully defined culture medium without using serum and any coating agents. Our proposed serum-free culture method is expected to contribute to the establishment of a sustainable production method for cultured meat derived from bovine muscle and potentially help to solve future food crises.
Materials and methods
Isolation of primary bovine myogenic cells
Primary bovine myogenic cells were isolated and cultured using previously reported methods by our group45. Briefly, bovine myogenic cells were isolated from cheek skeletal muscle tissues of Japanese Black cattle provided by Tokyo Shibaura Organ (Japan). The meat surface was disinfected with 0.5% chlorhexidine gluconate (5% Hibitane, Sumitomo Dainippon Pharma, Japan) and cut with a scalpel into blocks of ~3 × 4 × 0.5 cm. The samples were disinfected with a povidone-iodine solution (Meiji Seika Pharma, Japan) and ethanol (Yoshida Pharmaceutical, Japan), followed by Hanks’ balanced salt solution (HBSS) (FUJIFILM Wako Pure Chemical, Japan). The samples were then minced into 2 mm pieces using a scalpel and scissors. The minced sample 2 g was placed in a 50 mL centrifuge tube, and 10 mL HBSS with 1 mg/mL pronase (pronase from Streptomyces griseus, Sigma-Aldrich, USA) was added to the tube. After the centrifuge tubes containing the samples were treated with the enzyme by shaking in a 37 °C thermostatic bath for 1 h, 10 mL HBSS with 10% FBS was added. Cells were dispersed in solution by pipetting 10–20 times with a 25 mL pipette and 10–20 times with a 10 mL pipette. The suspension sample was filtered using a 40 μm cell strainer and centrifuged at 1000 × g for 10 min. After removing the supernatant, precipitated pellet was dissolved in 10 mL Dulbecco’s Modified Eagle Medium (DMEM, FUJIFILM Wako Pure Chemical Corporation, Japan) + 10% FBS + 1% penicillin-streptomycin (PS, FUJIFILM Wako Pure Chemical Corporation, Japan) with 10 ng/mL basic fibroblast growth factor (bFGF, KAKEN PHARMACEUTICAL, Japan). To exclude non-myogenic cells that initially adhered, such as fibroblasts, the cell suspension was incubated in an uncoated culture dish at 37 °C for 1 h, and then the supernatant was collected. The collected myogenic cells were seeded at a dilution ratio of 1:5 on a culture dish coated with recombinant laminin 511 E8 fragment (Easy iMatrix-511, Nippi Inc., Japan). When the primary bovine myogenic cells became confluent on day 6 or 7 after seeding, the cells were collected and frozen. For freezing, rapid cryopreservation at –80 °C was performed using CELLBANKER 1 (ZENOGEN PHARMA CO., LTD, Japan), and the cells were stored in the vapor phase of a liquid nitrogen tank overnight. In this study, the bovine myogenic cells (P1), which were primary cultured primary bovine myogenic cells and then passaged once, were used as cell samples.
Fabrication of serum-free co-culture medium conditioned by HepG2 and NIH/3T3 cells
Figure 1 shows the fabrication of serum-free co-culture medium conditioned by the human hepatocellular carcinoma-derived cell line HepG2 and the mouse embryonic fibroblast cell line NIH/3T3. HepG2 and NIH/3T3 cells were suspended in the adhesion medium described below and seeded at a density of 2.0 × 10⁵ cells/cm2 respectively (seed ratio to 1:1) in a ϕ 10 cm culture dish. The adhesion medium was prepared using DMEM + 10% FBS + 1% PS. The cells were incubated at 37 °C for 5 h, and then the adhesion medium was aspirated and discarded after initial cell adhesion was confirmed. The culture dishes were rinsed with 10 mL of D-PBS(-) (FUJIFILM Wako Pure Chemical Corporation, Japan) for three times.
After the washing treatments, serum-free culture medium DMEM + 1% PS 13 mL was added, and the cells were incubated at 37 °C for 3 days. The duration for a general conditioning culture medium is commonly set to within 1 day46,47 or 3 days48,49. However, the previous studies demonstrating that the co-culture of HepG2 and NIH/3T3 cells enhances the liver-associated function of HepG2 cells showed that albumin secretion levels continued to increase until day 11 of culture17,18. Taking these findings into consideration, we hypothesized that maximizing the co-culture duration of HepG2 and NIH/3T3 cells for conditioning the medium could lead to an increase in liver-associated secretions, and thus, we set the conditioning duration to 3 days.
After incubation, the supernatant was collected in a 15 mL centrifuge tube and centrifuged at 1500 rpm for 5 min. The supernatant of the centrifuge tube was collected as a serum-free co-culture medium conditioned by HepG2 and NIH/3T3 cells. For comparison, a culture medium conditioned only by HepG2 or NIH/3T3 cells was also prepared. These media were prepared by collecting the supernatants according to the protocol described above from the culture dish in which HepG2 or NIH/3T3 cells were seeded at a density of 2.0 × 10⁵ cells/cm2 in a ϕ 10 cm culture dish, respectively.
Evaluation of the cell adhesion and cell proliferation of bovine myogenic cells under the developed serum-free co-culture medium
Using the developed serum-free co-culture medium, bovine myogenic cells were seeded at a density of 2.0 × 10⁴ cells/cm2 on uncoated culture dishes (Greiner Bio-One, CELLSTAR 12 well plate, Austria). The effects on cell adhesion and proliferation of the bovine myogenic cells were evaluated by measuring the cell density at 24 and 72 h of culture, respectively. For quantitative cell counting, the cell nuclei were fluorescently stained with Hoechst 33342 (Thermo Fisher Scientific, H3570, U.S.A.). At the end of culture, the cells were fixed with 4% paraformaldehyde (Muto Pure Chemicals, 33111, Japan) for 15 min and washed three times with PBS. After washing, Hoechst 33342 solution diluted 1000-fold in PBS was added into the samples and the cells were allowed to stand for 15 min. The cells were then washed three times with PBS. Stained cell nuclei were observed using a fluorescence microscope BZ-X810 (Keyence, Japan). The fluorescence microscope comprised of a CCD camera and a 4X objective lens, and fluorescence-stained images of the entire well were captured by tiling imaging.
For quantitative cell counting, the number of cell nuclei was quantitatively measured from fluorescence microscope images using image analysis. Image preprocessing for noise reduction was performed using median and Gaussian filters, and Hoechst-positive region was extracted by binarization using the Otsu algorithm. After the extraction, segmentation was performed using the watershed method, and then the number of cell nuclei was counted. These image analysis algorithms were applied to whole tiled images repeatedly and then calculating the average cell density. For the image analysis, custom codes implemented in Python (version 3.10.9) using NumPy (version 1.23.5), SciPy (version 1.9.3), and scikit-image (version 0.19.3) were used.
To assess the culture function of the developed serum-free co-culture medium in detail, serum-containing culture medium DMEM + 10% FBS + 1% PS was prepared as the control (+) group, serum-free culture medium DMEM + 1% PS as the control (-) group, and serum-free culture medium conditioned by only HepG2 or NIH/3T3 cells as the HepG2 group and NIH/3T3 group, respectively. The developed serum-free co-culture medium conditioned by HepG2 and NIH/3T3 cells was designated as the co-culture group.
To evaluate the effect of the fabrication method of the serum-free co-culture medium on the cell adhesion and proliferation of bovine myogenic cells, the co-culture medium prepared by the contact co-culturing described above was used as a control group, and a non-contacted co-culture group using a Cell Culture Insert was established (Fig. 1c). HepG2 cells were seeded on the bottom of the insert and NIH/3T3 cells were seeded on the bottom of the well plates and prepared as the non-contacted coculture (H-N) group. NIH/3T3 cells were seeded on the bottom of the insert and HepG2 cells were seeded on the bottom of the well plates and prepared as the non-contacted coculture (N-H) group. In the non-contacted coculture groups, the ratio of the number of cells in the culture medium was adjusted to that in the control group. In addition, we also fabricated the samples that were prepared by mixing the HepG2 supernatant and NIH/3T3 supernatant as mix group, and by twofold diluting of the co-culture medium with DMEM + 1% PS as diluted co-culture group.
To control for technical variations, technical triplicates were performed using three wells for each culture condition, and the average cell density was calculated as the representative value for each culture condition. To control for biological variation, biological triplicates with three different culture schedules were performed.
Evaluation of cell function by immunofluorescence and fluorescence staining
To evaluate the function of the bovine myogenic cells in a serum-free co-culture medium, protein expression at 24 and 72 h of culture was evaluated by immunofluorescence and fluorescence staining. To provide sufficient cells to constitute cultured meat, it is necessary to achieve expanded culture by cell proliferation while maintaining an undifferentiated state. Ideally, the adhesive and proliferative functions of cells in the developed serum-free co-culture medium should be comparable to those in serum-containing culture media and the undifferentiated state should be maintained. In the present study, we evaluated cell adhesion, proliferation, and myogenic differentiation of the bovine myogenic cells. To assess the cell adhesion function, CD29 and F-actin, which constitute the focal adhesion and cytoskeleton respectively, were immuno-fluorescently and fluorescently labeled50,51. To assess cell proliferation function, Ki67, a prominent proliferation marker that is expressed in the cell cycles other than G0 phase, was immuno-fluorescently labeled21,52. To assess myogenic differentiation in the myotube formation of bovine myogenic cells, Desmin, an intermediate filament of the cytoskeleton and a muscle-specific marker, was immuno-fluorescently labeled in accordance with previous reports45,53,54,55. In all stains, the cell nuclei were fluorescently labeled with Hoechst 33342.
For fixation and permeabilization, all samples were fixed with 4% paraformaldehyde (Muto Pure Chemicals, 33111, Japan) for 15 min, washed three times with PBS, left to stand in PBS containing 0.5% Triton X-100 surfactant for 15 min, and then washed three times with PBS. To block the nonspecific binding of antibodies, 2% BSA solution, which was prepared using BSA powder (Sigma-Aldrich, A7906-50G, U.S.A) and PBS, were added to all samples, allowed to stand for 30 min, and then washed three times with PBS.
For the immunostaining of CD29, a mouse host CD29 monoclonal antibody solution (BioLagend, 303002, U.S.A.) diluted 100-fold with 0.1% BSA solution was prepared as the primary antibody solution. The primary antibody solutions were added, and then allowed to overnight (4 °C) on a shaker at 60 rpm. After washing three times with PBS, the CD29 immunolabeled samples were treated with Alexa Fluor 568 Goat anti-mouse IgG (H + L) antibody solution (Thermo Fisher Scientific, A11031, Polyclonal, U.S.A.) diluted 200-fold with 0.1% BSA solution, and then allowed to stand on a shaker at 60 rpm for 1 h (room temperature, shielded from light). After washing three times with PBS, the samples were treated with Phalloidin-iFluor 488 Reagent (Abcam, ab 176753, U.K.) diluted 1000-fold in 1% BSA solution was added for fluorescence staining of F-actin, and then allowed to stand on a shaker at 60 rpm for 90 min (room temperature, shielded from light). After washing three times with PBS, samples were treated with Hoechst 33342 solution (Thermo Fisher Scientific, H3570, U.S.A.) diluted 1000-fold in PBS for 5 min, and then washed three times with PBS.
For Ki67 immunostaining, a mouse host Ki67 monoclonal antibody (Exbio Praha, 11-155-C100, Czech Republic) diluted 500-fold with 0.1% BSA was used as the primary antibody solution. The primary antibody solutions were added, and then allowed to overnight (4 °C) on a shaker at 60 rpm. After washing three times with PBS, the Ki67 immunolabeled samples were treated with Alexa Fluor 488 Goat anti-mouse IgG (H + L) antibody solution (Thermo Fisher Scientific, A11029, Polyclonal, U.S.A.) diluted 200-fold with 0.1% BSA solution, and then allowed to stand on a shaker at 60 rpm for 1 h (room temperature, shielded from light). After washing three times with PBS, the samples were treated with the Hoechst 33342 solution diluted 1000-fold in PBS for 15 min and then washed three times with PBS.
For Desmin immunostaining, a mouse host Desmin monoclonal antibody (Thermo Fisher Scientific, MA5- 13259, U.S.A.) diluted 200-fold with 0.1% BSA was prepared as the primary antibody solution. After washing three times with PBS, the Desmin immunolabeled samples were treated with the Alexa Fluor 488 Goat anti-mouse IgG (H + L) antibody solution diluted 200-fold with 0.1% BSA solution and then allowed to stand on a shaker at 60 rpm for 1 h (room temperature, shielded from light). After washing three times with PBS, the samples were treated with the Hoechst 33342 solution diluted 1000-fold in PBS for 15 min and then washed three times with PBS.
To visualize F-actin and CD29, fluorescence microscopy images of F-actin and CD29 were captured using an ECLIPSE Ti2 fluorescence microscope (Nikon, Japan) equipped with a CMOS camera and a 20x objective lens. To visualize Ki67 and Desmin, fluorescence microscopy images of Ki67 and Desmin were captured using a BZ-X810 fluorescence microscope (Keyence, Japan) equipped with a CCD camera and a 10x objective lens. To suppress the variation in evaluation indices due to bias in the imaging position, fluorescence microscopy images were acquired at random positions 10 times (F-actin and CD29) or 40 times (Ki67 and Desmin). To suppress the measurement bias, the exposure time, analog gain, and other measurement conditions were consistently unified for all imaging conditions.
Quantitative image analysis of the fluorescence microscopy images was performed to quantitatively evaluate cell function. For the image analysis, custom codes implemented in Python (version 3.10.9) using NumPy (version 1.23.5), SciPy (version 1.9.3), and scikit-image (version 0.19.3) were used.
To quantify the cell adhesion function, the CD29-positive area ratio of the entire microscope image was evaluated. To quantify the CD29-positive area ratio, image preprocessing for noise reduction was performed using median and Gaussian filters. Background subtraction was performed using the Rolling-ball algorithm to improve the signal-to-noise ratio of the image. Subsequently, the CD29-positive regions were extracted by binarization using the Otsu algorithm. After extraction, segmentation processing was performed using the watershed method. To eliminate detection errors caused by image noise, only regions with an area of CD29-positive regions between 102 and 5.0 × 105 pixels were extracted. These exclusion criteria were determined by qualitative evaluation of the analysis results. Finally, the CD29-positive area ratio was calculated by dividing the summed areas of CD29-positive regions by the entire image area.
To quantify cell proliferation function, the Ki67-positive area ratio of the entire microscope image was evaluated. To quantify the Ki67-positive area ratio, image preprocessing for noise reduction was performed using median and Gaussian filters, and Ki67-positive regions were extracted by binarization using the Yen algorithm. After extraction, segmentation processing was performed using the watershed method. To eliminate detection errors caused by image noise, only the regions with an area of Ki67-positive regions between 101 and 102 pixels were extracted. These exclusion criteria were determined by qualitative evaluation of the analysis results. Finally, the Ki67-positive area ratio was calculated by dividing the summed areas of Ki67-positive regions by the entire image area.
To quantify the differentiation function of myogenic cells, the Desmin-positive area ratio of the entire microscope image was evaluated. To quantify the Desmin-positive area ratio, image preprocessing for noise reduction was performed using median and Gaussian filters, and the Desmin-positive regions were extracted by binarization using the Yen algorithm. After the extraction, segmentation processing was performed using the watershed method. To eliminate detection errors caused by image noise, only regions with Desmin-positive regions between 102 and 103 pixels were extracted. These exclusion criteria were determined by qualitative evaluation of the analysis results. Finally, the Desmin-positive area ratio was calculated by dividing the summed areas of the Desmin-positive regions by the entire image area.
These image analyses were repeated for all randomly sampled images, and the median value of the quantitative index was calculated to obtain a representative value for each biological sample. The experimental conditions were the same as those used to evaluate the performance of serum-free co-culture supernatants, and biological triplicates were performed to control for biological variations.
Characterization of the contact co-culture methods
To understand the mechanism of the stable culture effects similar to those of the serum-containing culture medium, we evaluated the characteristics of the contact co-culture method for generating a serum-free co-culture medium conditioned by HepG2 and NIH/3T3 cells. Specifically, we evaluated the morphological characteristics of the serum-free co-culture system and the culturing stability of the serum-free co-culture medium.
To evaluate morphological characteristics, immunofluorescent staining for albumin and E-cadherin was performed. After collecting supernatants from the co-culture system, all samples were fixed with 4% paraformaldehyde for 15 min, washed three times with PBS, left to stand in PBS added with 0.5% Triton X-100 surfactant for 15 min and then washed three times with PBS. After the washing, the samples were left to stand in 2% BSA solution for 30 min and then washed three times with PBS. For the immunostaining of albumin, rabbit host Albumin monoclonal antibody (Abcam, ab207327, U.K.) diluted 500-fold in 0.1% BSA was used as the primary antibody solution. The primary antibody solutions were added, and then allowed to overnight (4 °C) on a shaker at 60 rpm. After washing three times with PBS, the albumin immunolabeled samples were treated with Alexa Fluor 488 Goat anti-rabbit IgG (H + L) antibody solution (Thermo Fisher Scientific, A11034, Polyclonal, U.S.A.) diluted 200-fold with 0.1% BSA solution, and then allowed to stand on a shaker at 60 rpm for 1 h (room temperature, shielded from light). After washing three times with PBS, the samples were treated with the Hoechst 33342 solution diluted 1000-fold in PBS for 15 min, and then washed three times with PBS. For the immunostaining of E-cadherin, a mouse host E-cadherin monoclonal antibody (Abcam, ab231303, U.K.) diluted 1000-fold in 0.1% BSA was used as the primary antibody solution. The primary antibody solutions were added, and then allowed to overnight (4 °C) on a shaker at 60 rpm. After washing three times with PBS, E-cadherin-immunolabeled samples were treated with Alexa Fluor 488 Goat anti-mouse IgG (H + L) antibody solution (Thermo Fisher Scientific, A11029, Polyclonal, U.S.A.), diluted 200-fold with 0.1% BSA solution, and then allowed to stand on a shaker at 60 rpm for 1 h (room temperature, shielded from light). After washing three times with PBS, the samples were treated with the Hoechst 33342 solution diluted 1000-fold in PBS for 15 min, and then washed three times with PBS.
To evaluate the culturing stability of the serum-free co-culture medium, a passage culturing test to verify whether bovine myogenic cells could be cultured passingly was performed. In the passaging test bovine myogenic cells were seeded at a density of 2.0 × 10⁴ cells/cm2 on a uncoated ϕ 3,5 cm culture dishes with each culture medium. After 2 days of culture at 37 °C, the culture medium was removed, and the sample was washed with D-PBS(-) 2 mL. After the washing, samples were incubated with 0.25 w/v% trypsin-1mmol/L EDTA-4Na solution 500 μL (FUJIFILM Wako Pure Chemical Corporation, 209-16941, Japan) for 3 min at 37 °C, and then samples were tapped to detach cells from the culture dish. The cell suspension was collected and mixed with DMEM + 10% FBS + 1% PS 500 μL. The mixed cell suspension was collected in a 1.5 mL microtube and centrifuged at 6200 × rpm for 5 min. After discarding the supernatant from the tube, the precipitated cells were suspended in D-PBS(-) 1 mL. After suspension, the number of cells were counted using a hemocytometer. To passage, the cell suspension was centrifuged again at 6200 rpm for 5 min, the supernatant was removed, and the precipitated cells were resuspended in each culture medium, and reseeded in a new culture dish. This process was repeated twice, with the samples being cultured at 37 °C for 2 days and passaged.
Component analysis and metabolome analysis for identifying characteristic nutrients
To identify the characteristic nutrients in the developed serum-free co-culture medium, the nutritional composition analysis of the culture medium was performed. Our preliminary studies revealed that inorganic salts, amino acids and vitamins may contribute more to the cell proliferation of bovine myogenic cells than proteins such insulin recombinant full chain and AlbuMAX™ II in the absence of albumin (Supplementary Fig. 7). In addition, it was showed that the osmotic pressure was similar under all experimental conditions, and the total protein content of the HepG2, NIH/3T3 and co-culture groups was lower than that in the control(+) group (Supplementary Fig. 8). Based on these results, we studied the metabolites in the culture medium.
Analyses of the nutrient content and osmolality of the extracts were outsourced to the clinical laboratory company SRL Inc., in Japan. A list of the test contents is provided in Supplementary Table 1.
For the clustering analysis, we built a custom script using SciPy (version 1.9.3) and performed hierarchical clustering using the complete linkage method based on cosine similarity. For principal component analysis, we built a custom script using scikit-learn (version 1.2.0) and performed the analysis. In these analyses, the z-normalized values for each test component concentration were used. To identify the characteristic nutrients in each culture medium, multiple comparison tests were performed using the Tucky–Kramer method in R (version 4.0). P-value less than 0.01 was considered significant in the analysis. For the quantitative enrichment set analysis, MetaboAnalyst 5.056, a web-based metabolome analysis tool, and the KEGG database was used. In the analysis, all missing values were replaced with zeros.
Evaluation of the culture function of each characteristic nutrient
The culture functions of the identified characteristic nutrients (alanine, asparagine, asparatic acid, glutamic acid, ornithine, pyridoxal, and pyridoxamine) were evaluated using additive culture experiments.
The concentration of each component was set at five levels (Supplementary Table 2). These concentrations were determined to include the concentration in the developed co-culture medium and DMEM + 10% FBS + 1% PS. In this experiment, DMEM + 1% PS was used as the basal culture medium. Each nutrient was supplemented by filter sterilization using a sterile filter (Millex®-GV 0.22 μm PVDF, Merck & Co. Inc., U.S.A). The experimental conditions using bovine myogenic cells were the same as those used for the performance evaluation of the serum-free co-culture supernatant. Cell adhesion and proliferation were evaluated by capturing phase-contrast microscopy images at 24 and 72 h of culture. To control for biological variations, biological triplicates with three different culture schedules were performed.
Statistical analysis
In all experiments, at least three biological replicates were performed by repeating independent biological experiments conducted on different experimental dates. For each independent biological experiment, three samples from different test wells were prepared under the same conditions to obtain technical replicates. The average of the experimental values obtained in the technical replicates was used as the representative value for each biological sample in the independent biological experiments.
To visualize the experimental data, bar graphs representing the mean values were used. All sample points are plotted on the bar graphs, and the standard deviations of the samples are shown in the error bars.
Welch’s t-test was performed to test for the differences in means between the two groups. One-way ANOVA was performed for the analysis of variance. For multiple comparisons, Dunnett’s test was used to test the difference in the means of each sample group relative to the control group. The significance level was set at p < 0.05. Statistical analyses were performed using SciPy (version 1.11.4).

Responses