Confined and mined: anthropogenic river modification as a driver of flood risk change

Introduction
Rivers modify their topography by redistributing sediment. However, the role of sediment and geomorphic change is usually neglected when modelling flood risk1,2,3. In settings characterised by low rates of geomorphic change, the assumption of fixed topography in flood modelling is valid since topography exerts a first-order control on channel capacity. In settings where geomorphic change causes variation in topography, either from natural forcing and/or anthropogenic impacts, there are likely consequences for the magnitude and location of flooding4,5,6. However, the effects of two of the most common river management interventions, anthropogenic confinement and aggregate mining7,8 have not been quantified in terms of their implications for flooding.
Many of the world’s formerly multi-thread and planimetrically dynamic rivers have been confined using artificial levees and embankments that have disconnected these rivers from their floodplains and dampened their rates of morphological change9,10. Confining structures leave rivers strangled or locked in place8,11 preventing channel migration in response to floods12. In regions with high sediment yields per unit area, such as New Zealand13,14, river confinement has been associated with manufacturing future disasters8,13. Although anthropogenic confinement leads to higher bedload transport per unit width, aggradation often continues, potentially at an increased vertical rate due to the reduced area available for deposition15. Hence, riverbeds may become perched above their floodplains between erosion control structures that must be regularly increased in height to maintain their design standard16.
Coupled with anthropogenic confinement, many of the world’s rivers are also extensively and frequently exploited as a natural resource for aggregate; 32 and 50 billion (109) tonnes of gravel and sand, respectively, are extracted from rivers globally each year7,17,18. When undertaken at an industrial scale, aggregate mining often removes more material than a river can naturally replenish, creating a sediment deficit (e.g. ref. 19). This results in hungry rivers11 with increased power to erode, leading to steeper channel gradients due to planform simplification, and often deeper and wider channels as the river works to replenish the sediment loss11,20,21. Examples are widespread, including the Lower Mekong River where excessive riverbed scour has made the riverbanks more susceptible to collapse during monsoon floods22, the Ganges–Brahmaputra–Meghna catchment where the volume of sand extraction is estimated to be similar to the natural bedload flux resulting in challenges for delta replenishment23, the Hukou Waterway, China, where mining has created a deeper, wider channel with smaller mid-channel sand bars24 and the gravel-bed Shi-ting River, China, where aggregate mining has caused dramatic bed degradation25. Considering a simple sediment budget, the removal of sediment by aggregate mining could increase channel capacity and reduce flood extent, but since sediment removal is spatially variable it may also induce further morphological change and so alter flood routing. Moreover, since increased shear stresses often result in scour and/or lateral migration11,20, aggregate mining can result in the subsequent loss of productive farmland and increase risks to critical infrastructure including bridges, and globally prevalent flood and erosion control structures26.
In a world where rivers are increasingly exploited for aggregate27, and are anthropogenically confined to protect against flood and erosion risks, little is known about how the morphological impact of such dramatic modification impacts the magnitude and frequency of flood inundation, and the timescales across which changes in flood hazard may manifest. The fundamental challenge is the lack of repeat, catchment-scale high-resolution Digital Elevation Models (DEMs) from which three-dimensional geomorphic changes can be calculated28 and flood risk numerically modelled. Although regional-scale airborne LiDAR surveys are now becoming more prevalent, only a small portion of the Earth’s surface has been surveyed29. However, where pre-event surveys are available, post-event surveys can inform flood risk management decision-making through topographic change analysis and hydraulic modelling, as demonstrated following extensive ground subsidence in Christchurch, New Zealand, following the Canterbury earthquake sequence which caused increased fluvial flood vulnerability30,31.
Here, we quantify the effects of aggregate mining on channel morphology within a river that is extensively anthropogenically confined and test the hypothesis that morphological change associated with anthropogenic river modification alters flood inundation extent over an annual timescale. The analysis used system-scale high-resolution (0.5 m) repeat topographic surveys from 2019 and 2020 of the Bislak River, the Philippines, contextualised with survey data from 2014. High-resolution topographic surveys were used to quantify annual (2019–2020) and multi-year (2014–2019) morphology change and sediment budgets. The DEMs were also used as boundary conditions for two-dimensional hydraulic modelling to predict associated changes in flood inundation. The Bislak River is ideal for testing the hypothesis as, like many rivers globally, it has undergone extensive and intensive anthropogenic disturbance through aggregate mining and the construction of flood and bank erosion control structures. Furthermore, unlike many rivers, the Bislak River does not have any contemporary dams within its catchment that would disconnect longitudinal sediment flux from the mountain front.
Study area
The Bislak River, a catchment area ~586 km2, originates in the Luzon Central Cordillera Mountain Range where the single-thread active channel is laterally confined (<200 m). Further downstream, the active channel widens and becomes firstly partly- and then unconfined, through wandering and then braided river styles before discharging into the South China Sea32. The regional climate is tropical with distinct dry and wet seasons and, between June and September, multiple typhoons occur in a typical year32. Almost half the population of the settlements of Bacarra and Vintar, in total 31,690 people, reside on the Bislak River floodplains (Philippines Statistics Authority), in locations highly susceptible to flooding33. In attempts to mitigate the flood and erosion hazards, hard engineering structures have been installed along 46% of the riverbank length in the downstream partly confined and unconfined reaches (Fig. 1). The Bislak River is a gravel-bed river, with a median surface bed material grain size decreasing from 130 mm near Tamdagan bridge (upstream) to 57 mm close to the coast (Supplementary Information).

A Global distribution of aggregate production; note the concentration of aggregate mining activity in Southeast Asia27. B Location map of the Bislak River, North Luzon Island, the Philippines (C). The Bislak River’s headwaters originate in the Luzon Central Cordillera Mountain Range, where the Bislak is laterally confined and a single thread. As the Bislak transitions downstream the active channel widens and becomes wandering and then braided in style before it enters the South China Sea32. Flood depth displayed on the map represents a 1 in a 50-year return interval (RI) discharge modelled on the 2019 high-resolution DEM (“Methods” section). Gravel mining areas displayed were mapped from the 2019 and 2020 high-resolution DEMs. Topographic data from ESRI Living Atlas.
Methodological overview
System-scale, spatially continuous, 0.5 m horizontal resolution topographic models were produced by fusing together topographic models of wet and dry areas within the active channel and floodplain34. Dry topography was surveyed using airborne LiDAR. Shallow areas of wet topography were modelled using a spectrally based depth retrieval method35, using the Optical River Bathymetry Toolkit [ORByT; 36], and water depth and bed elevation measurements acquired along wet channels from Real-Time Kinematic Global Navigation Satellite System (RTK-GNSS) positioned echo-sounding and survey pole observations. Deep areas of wet topography were modelled using RTK-GNSS positioned echo sounding. Topographic change was quantified for 2019–2020 using a probabilistic thresholding approach28, using Geomorphic Change Detection software37, a confidence interval of 95% and independent topographic survey checkpoint data to quantify vertical error for each wet and dry component of each DEM. The system-scale sediment budget was longitudinally segmented every 3 km to assess downstream changes in net flux. Patterns of channel change detected topographically and through the interpretation of aerial imagery, were interpreted to identify regions of aggregate mining activities, using an interpretation of aerial imagery and topographic change signatures. Topographic change for 2014–2019 was assessed using the same method as for 2019–2020; results were used to contextualise the annual sediment budget. To investigate whether geomorphic change causes variation in flood routing and inundation, the 2019 and 2020 DEMs were used to provide boundary conditions for two-dimensional HEC-RAS38,39 hydraulic modelling. Floodplain topography did not change between simulations, to ensure that predicted flow variation was only a consequence of change within the active channel. The model was calibrated by varying Manning’s roughness coefficient to maximise the congruent fit between the observed and predicted observations of Tyhoon Ineng (23 August 2019). Subsequently, the calibrated model was used to predict 10-, 50-, and 100-year return period events.
Results
River morphology change
The 2019–2020 DEM of Difference (DoD) reveals both natural and anthropogenic morphology change (Fig. 2B–D). Natural morphodynamic signatures28 include evidence of bank erosion, bar trimming, lateral growth of gravel bars and thin layers of gravel deposition on bars. Anthropogenic modification is evident from patches of channel change that are typically polygonal or ‘pitted’ in shape and have a more spatially consistent vertical dimension of topographic change than natural changes (Figs. 2B–D, 3). Aggregate extraction activities produce patches of deposition where gravel pits visible in the 2019 DEM were filled with sediment during the 2019 wet season (Fig. 3A). Conversely, patches of erosion represent aggregate mining activities which took place after the 2019 wet season that were recorded in the 2020 DEM (Fig. 3A). Aggregate extraction activities are generally concentrated in active channel regions that have good access for vehicles from the river to the local road network.
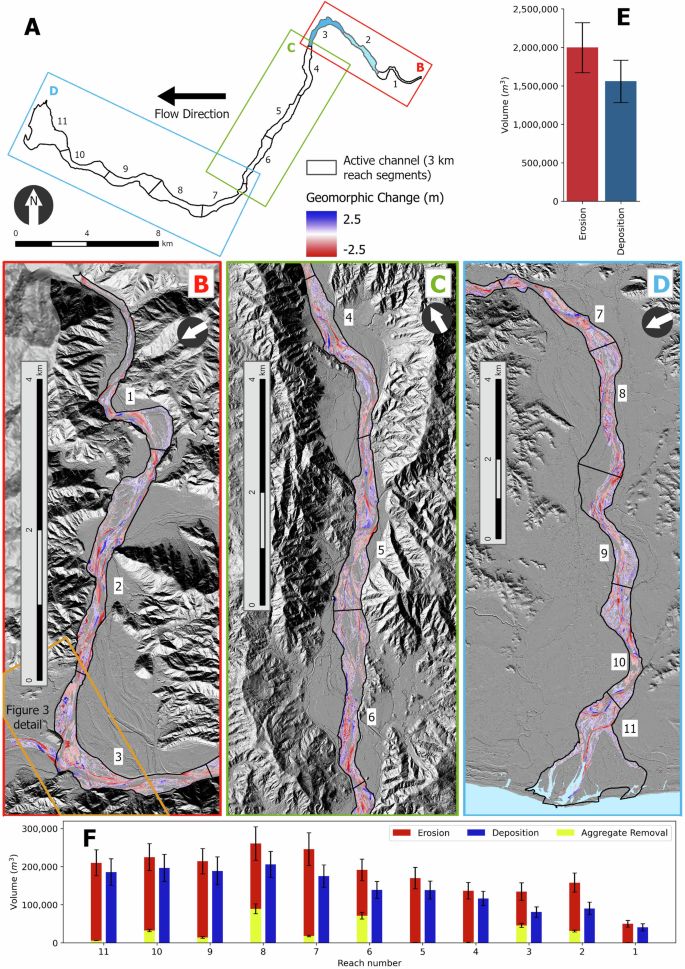
A Active channel area with associated 3 km segments overlayed by three panels (B–D). Active channel area identification and assignment are described in the “Methods” section. Segments 2 and 3 are highlighted and correspond to the detailed area shown in Fig. 3B–D. Geomorphic change between 2019 and 2020. E Total sediment budgets for 2019–2020. F. Longitudinally segmented sediment budgets for 2019–2020. Note how every segment of the Bislak River is sediment deficient (i.e., more erosion than deposition has occurred). Aggregate mining-related sediment loss varies downstream. Segments 3, 6, and 8 experience the most aggregate mining relative to the amount of total eroded sediment where 34%, 37% and 34% of the gravel removed in these segments is attributed to aggregate mining, respectively. Errors displayed in (E and F) represent calculated propagated errors37.
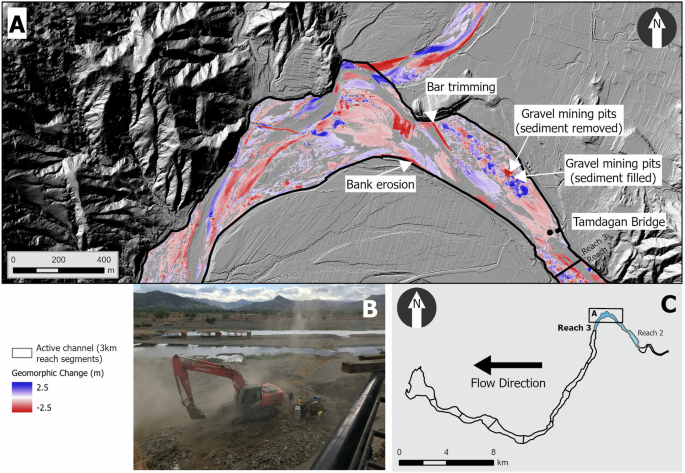
The DoD reveals evidence of bank erosion, bar trimming, lateral growth of gravel bars and thin layers of gravel deposition on bars. Anthropogenic modification is evident from patches of channel change that are typically polygonal or ‘pitted’ in shape. Aggregate extraction activities produce patches of deposition (blue) where gravel pits visible in the 2019 DEM were filled with sediment during the 2019 wet season. Conversely, patches of erosion (red) represent gravel mining activities which took place after the 2019 wet season that were recorded in the 2020 DEM. B Image of gravel mining activity along the Bislak River. Note water-filled aggregate pits in the background. C Active channel segments of the Bislak River displaying the location of (A).
The total sediment budget derived from the 2019–2020 DoD suggests that the sediment deficit was −438,492 ± 427,289 m3 (Fig. 2E) (Supplementary Information, Supplementary Table 5). Interpretation of natural and anthropogenic morphodynamic signatures revealed that a quarter of this deficit (103,000 ± 46,882 m3) can be attributed to aggregate mining within the active channel regions (Supplementary Information, Supplementary Table 9). This volume is consistent with an aggregate extraction volume of 77,000 m3 provided by the Philippines Mines and Geosciences Bureau, based on licensed aggregate extraction activities between 2019 and 2020. The DoD for the five-year period (2014–2019) produces a sediment deficit of −2,426,879 ± 1,068,019 m3, equivalent to ~−485,375 ± 213,603 m3 annual sediment loss (Supplementary Table 13, Supplementary Fig. 2). This mean annual deficit is consistent with that measured for 2019–2020.
The full 33 km stretch of the Bislak River was divided into eleven 3 km segments (Fig. 2B–D). The sediment budget for these segments from the 2019–2020 DoD reveals a consistent pattern of sediment loss from all eleven 3 km segments, with erosion exceeding deposition by 11.5–43% (Fig. 2F). The proportion of sediment loss due to aggregate mining varies between segments: the greatest proportions are in segments 3, 6, and 8 where mining contributes 34%, 37% and 34%, respectively, of the total sediment deficit (Fig. 2F). All three of these segments are also partially anthropogenically confined (Fig. 1C).
Two-dimensional flood modelling
Flood model predictions suggest that vertical topographic change (i.e. erosion and deposition) between the 2019 and 2020 surveys caused flood inundation of the surrounding floodplain to decrease for each of the 100-, 50-, and 10-year return interval (RI) flood events (Fig. 4A–C; Supplementary Table 16, Supplementary Fig. S4). For the 100-year event, total flood inundation decreased by 3.2%, ranging between −12% and +0.3% for the eleven segments. The greatest changes were observed in segments 2 (−7%), 3 (−7%), 4 (−11.8%), and 6 (−10.3%) (Fig. 4A–C; Supplementary Table 19, Fig. 5). Similar results were found for the 50- and 10-year events, with the total inundation extent decreasing by 5.1% (range −12.5 to +0.9%) for the 50-year event, and −4.6% (range −14 to −2%) for the 10-year event. For the 50-year flood, the greatest changes are predicted for segments 3 (−9.2%), 6 (−12.5%), 7 (−6.9%), and 8 (−6.7%), whereas for the 10-year flood event, the greatest changes are in segments 3 (−14%), 6 (−7.1%), 8 (−6.4%), and 10 (−6.2%). Note that the spatial pattern of inundation change (%) between the 11 segments shows some variation between the three return intervals (Fig. 5A–C; Supplementary Table 19, Supplementary Fig. 4A, B).
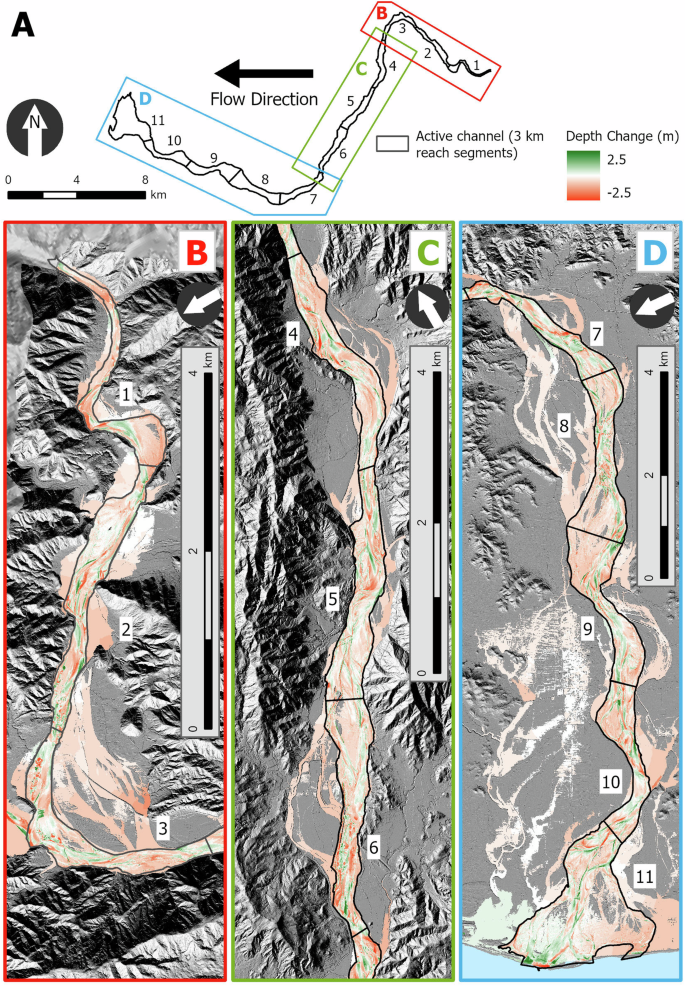
A Active channel area with associated 3 km segments overlayed by three panels (B–D). Segments 9–11 experience notable flood depth change from left to right bank floodplains, with the right bank floodplain experiencing an increase in flood inundation depth and the left bank floodplain experiencing a decrease in flood inundation depth.
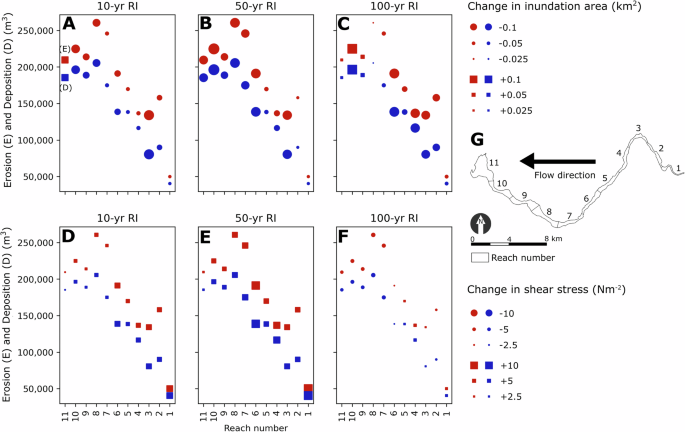
Changes in inundation area (A–C) and shear stress (D–F) between 2019 and 2020, illustrated by the volume of erosion and deposition that occurred in each reach (G), for 10-, 50- and 100-year Return Intervals (RI). Scaled circles show the magnitude of reductions in inundation area or shear stress. Scaled squares show the magnitude of increases in inundation area or shear stress. During different flood return intervals, the variation in inundation area and shear stress pattern changes, with different segments exhibiting changes in flood inundation extent and shear stress.
Maps of modelled water depth changes between 2019 and 2020 show that topographic change caused variation in flood routing in the channel and widespread changes in inundation depth on adjacent floodplains (Fig. 4B–D). For all three return period flood simulations, segments 9–11 experience notable floodplain flood depth change, with increased inundation depths on the right bank floodplain and a decrease on the left bank floodplain (Fig. 4B).
Shear stress
Model results show that the topographic change that occurred between 2019 and 2020 resulted in an overall increase in mean shear stress for the 50-year (+16%) and 10-year (+7%) flood events, but a decrease (−7%) for the 100-year event (Fig. 5D–F; Supplementary Tables 20–22, Supplementary Fig. 4C, D). The shear stress change in each segment for the 100-year flood event ranged from −12.5% to +2.5%, with the greatest changes observed in segments 8 (−11%), 9 (−9%), 10 (−12.5%), and 11 (−12%). For the 50-year flood event, all segments show increases in shear stress from 4.5%–31%, with the greatest changes in segments 6 (31%), 7 (17%), 8 (21%), and 10 (23%). For the 10-year event the changes in each segment range from –3% to +18%, with the greatest increases observed in segments 3 (18%), 6 (14%), 8 (8%), and 10 (10%). As for inundation change, changes in mean shear stress between the individual segments do not appear to be consistent between the three return periods considered (10-, 50-, 100-year) (Fig. 5D–F; Supplementary Tables 20–22, Supplementary Fig. 4C, D).
Relationship between changes in morphology and flood inundation area
Plots of the relationship between changes in sediment volume (erosion or deposition) and inundation area change suggest that increased morphological change is correlated with decreased flood inundation extent between 2019 and 2020 for both 10- and 50-year events (Fig. 5A, B). For the 100-year flood event, there does not appear to be a decrease in inundation extent with increasing morphological change between 2019 and 2020 (Fig. 5C). In general, the segments which experience the most aggregate mining activity display the greatest decreases in inundation change on the surrounding floodplain. This is particularly the case for segments 3, 6, and 8, noted above as the segments where aggregate mining makes the greatest contributions (34–37%) to sediment loss.
Discussion
Does anthropogenic river modification change flood risk?
Flood model predictions for 10- and 50-year events suggest that morphological change over a single year (2019–2020) resulted in a decrease in flood inundation extent on the floodplain (Fig. 5), and an increase in mean shear stress within the channel (except for segment 11 Figs. 5A and 4D and segments 9–11, Fig. 5C, F). For the 100-year event, morphological change had a limited impact on flood routing and therefore flood inundation extent, as there were considerable floodplain flows in both 2019 and 2020 which also caused a decrease in overall bed shear stress within the active channel (Fig. 5C, F). Although hydraulic model simulations for all discharge return intervals resulted in a decrease in overall flood inundation extent between 2019 and 2020, variation in inundation patterns is observed between the three return periods (Fig. 4). This suggests that morphological change alters the distribution of flow between anabranches, some of which disproportionately convey greater proportions of flood water; this changing distribution consequently causes variation in the routing of water onto floodplains for different magnitude discharge events (e.g., Fig. 5B).
The overall pattern of decreases in flood inundation extent and increased shear stress within the active channel (for 10- and 50-year events) can be attributed to net degradation, creating an overall deeper active channel with greater conveyance capacity (Fig. 6). Flood inundation predictions also suggest that those segments of the river which were partially anthropogenically confined and exhibited the most extensive mining activity (especially segments 3, 6, and 8; Fig. 2F) generally experienced the greatest decrease in flood inundation extent on the adjacent floodplains. The Bislak River, like many rivers globally, is confined by lateral embankments which inhibit floodplain-channel sediment exchange and reworking [e.g. ref. 40]. Floodplain-channel sediment exchange can account for a large portion of the total sediment input to fluvial systems, as observed in other Philippine rivers41,42. Similar observations have also been made along the Karnali River, Western Nepal, where floodplain recycling is evident through elevated levels of suspended sediment concentrations during the monsoon due to extensive riverbank collapse and high channel migration rates43. The Liwu River, Taiwan, which is similar in size and morphology to the Bislak River, stores up to 95% of its sediment in the unconfined valley portion of the catchment44, suggesting a long history of floodplain recycling and storage. Satellite imagery and the DoD maps of the Bislak River indicate incremental channel migration in regions where the river is less constrained by lateral flood embankments (Fig. 2B–D). At the multiple-decadal scale, aerial imagery from 1947 demonstrates the engineered reduction in active channel area over the past 70 years (Supplementary Fig. 1), showing that the Bislak migrated across its floodplain before the erection of embankments. Although the structures installed along large stretches of the Bislak River have been successful in reducing river mobility and preventing bank erosion, a consequence of such structures is the loss of sediment supply from floodplain reworking, starving the Bislak River of a major source of sediment and so exacerbating the impact of sediment loss through the aggregate mining activity.
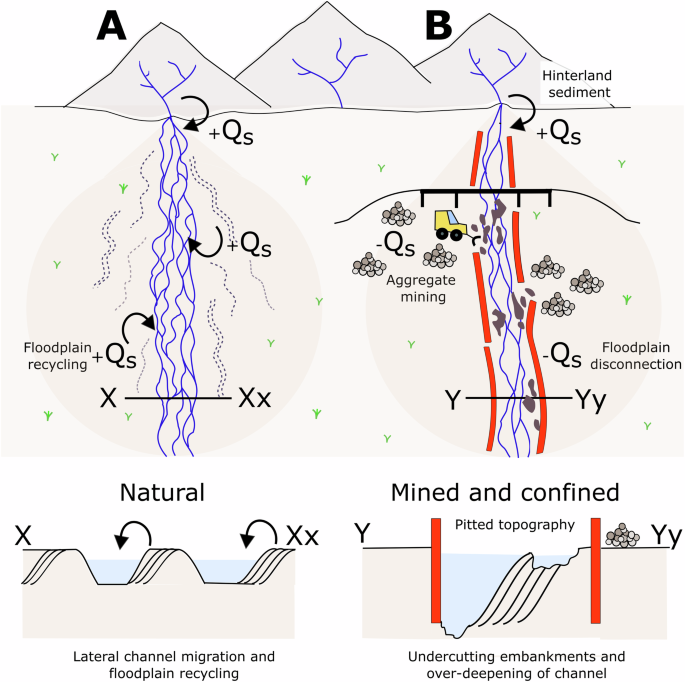
A A natural river with no flood embankments or aggregate mining activity. B A ‘confined and mined’ river which has extensive flood and bank erosion protection structures along the channel banks. Flood embankments prevent lateral channel erosion and migration, depriving the river of a main source of sediment (i.e., floodplain recycling). Aggregate mining in the active channel combined with a sediment deficiency from floodplain disconnection results in river incision and an overdeepening of the channel which can lead to increased bed shear stress and the scouring of critical infrastructure foundations.
Alternative hypotheses for a degrading river could be regional tectonics or changes in water and/or sediment fluxes. Although basin tectonics are poorly constrained in the study area, proximity to the Manila Trench West of Luzon Island45 implies subsidence in the Bislak basin. Subsidence leads to increasing accommodation space and so is associated with fluvial deposition, contrary to the observed degradation that is observed in the Bislak. Sediment replenishment in the Bislak River likely results from sporadic rainfall- and earthquake-induced headwater slope failures, and recycling of terrace and floodplain deposits. Catchment averaged precipitation data spanning the past 20 years (Supplementary Information, Supplementary Fig. 5) shows that the pattern of rainfall during the 2014–2020 data acquisition period was typical for this region, so we consider that sediment delivered to the river over this period is representative of longer-term behaviour. Hence, the presence of a non-anthropogenically controlled sediment deficit, and the absence of general surface lowering, suggests that the incision along the Bislak is controlled by the ongoing sediment deficit, which we associate with anthropogenic confinement preventing bank erosion and with aggregate mining.
Implications of rapid geomorphic change altering flood risk
Although the ongoing sediment deficit in the Bislak River (−485,000 m3 of sediment per year, 2014–2019) has resulted in the overall decrease in flood inundation and therefore flood risk along the surrounding floodplain (Fig. 4), the sediment deficit itself poses risks due to localised degradation (Fig. 6). When the annual sediment loss of -485,000 m3 over the past 5 years is averaged across the whole active channel, this equates to ~30 mm per year of bed lowering; scaling to ~1 m of incision over 30 years. This incision will likely be concentrated in deeper channels and geomorphologically sensitive areas such as along either naturally or anthropogenically confined reaches near bridge foundations [e.g. ref. 42]. Incision of this magnitude poses a threat to bridges, banks and flood protection structures, putting communities who live alongside the river at increased risk46. Similar observations have been made along channels in the Mekong delta where sand mining has been attributed as the cause of 2.5 m channel lowering since 199847, and in many rivers where dams reduce sediment input from upstream48.
Across the tropics and in many other regions, climate change is expected to increase the frequency and/or intensity of major rainstorms and typhoons49 and demand for aggregate is also set to rise27. This combination of pressures could further exacerbate river incision in anthropogenically confined river systems that have reduced longitudinal and lateral sediment connectivity due to bank erosion protection structures and/or dam impoundments, which further contribute to sediment deficits. Reduced sediment transfer could arise from material becoming trapped upstream in mining pits and/or removed from the system before it has a chance to transfer to the downstream unconfined reaches that are typically the nexus of population, high-value agricultural land, industrial development, and urban centres. Some investigations have suggested that climate change will create higher sediment fluxes [e.g. ref. 50] which could counteract the impacts of aggregate mining and channel confinement but these fluxes can be offset by sustained aggregate mining and dam construction51. However, when intense aggregate mining activity ceases, a degraded, narrow, incised river can recover to its former morphology within a few decades if it is given the room to erode its floodplain and replenish its sediment loss [e.g. ref. 21]. With ongoing, prevalent structural confinement as a river management intervention and demands for aggregate set to increase52, there is a need for raising awareness of how annual-scale geomorphological change can alter flood risk and the risk of manufacturing infrastructure hazards associated with scour.
Methods
Repeat topographic surveys
Repeat topographic surveys of the Bislak River were collected in 2014, 2019 and 2020 (Supplementary Information, Repeat Topographic Surveys). Airborne LiDAR surveyed dry topography, with near-vertical aerial imagery also collected. Field measurements of water depth and bed elevation were made at selected locations along the wet channels, using a Global Navigation Satellite System (GNSS) and echo sounding (Supplementary Fig. 1). A spectrally based depth retrieval method35 using the Optical River Bathymetry Toolkit, ORByT36 was then applied to model river bathymetry in shallow areas of the wetted channel (“OEM” Supplementary Information, Supplementary Fig. 1). The topography of deeper areas of the wetted channel was directly mapped from RTK-GNSS positioned echo sounding. High-resolution digital elevation models were generated by fusing data from the different survey techniques to obtain a continuous topographic representation34 (Supplementary Information, Data Processing and Fusion).
Geomorphic Change Detection (GCD)
GCD software37 was used to subtract two DEMs with consistent projections and datums to produce a DEM of Difference (DoD28). The DoD is a cell-by-cell subtraction that records changes in surface elevation i.e. surface lowering (erosion) and surfacing rising (deposition). To investigate geomorphic change for the Bislak River over a single (2019–2020) and multiple (2014–2019) years, the high-resolution (0.5 m) Bislak DEMs (2014, 2019, and 2020) were clipped to the active channel area. The active channel area was identified by scrutinising the 2014, 2019 and 2020 DEMs alongside high-resolution corresponding satellite imagery (for 2014) and aerial imagery acquired at the same time as LiDAR (for 2019 and 2020). Anabranches which appeared ‘active’ (i.e. containing flow) and regions of the channel and floodplain which appeared reworked or recently inundated with flood water were incorporated into the active channel region. The Bislak DEMs were formed from a fusion of topographic data collected from different survey techniques (e.g. LiDAR, echo sounding and spectrally based depth mapping). Each survey technique has its own associated errors, which are often spatially autocorrelated. Errors in the different data sets may not be independent. Hence, propagating errors to determine the overall uncertainty in the DoD requires careful consideration, especially since the magnitudes of geomorphic change and survey uncertainties are often similar (e.g. ref. 53). For each DEM, an error mask was defined for each survey technique, and appropriate vertical errors were assigned from GNSS checkpoint observations (see Supplementary Information). Geomorphic change detection was calculated using a probabilistic thresholding approach, which removed systematic bias through filtering elevation changes based on the confidence that the detected change is real (e.g. similar changes in elevation are observed in nearby cells)28. We calculated sediment budgets using a confidence interval of 95% but also undertook sensitivity experiments at confidence intervals of 80, 85, and 90% (Supplementary Information, Geomorphic change detection).
From the resulting DoD, vertical topographic change was summed in GCD software to calculate a system-scale sediment budget. The sediment budget was calculated for successive 3 km segments (Fig. 2B–D) to enable the assessment of downstream changes in net fluxes. The 3 km long segments, in the region of 6–10 active channel widths, record systematic changes in the sediment budget, for example, due to the locations of tributary inputs and changes in channel confinement, but are sufficiently long to smooth out local (bar-scale) features.
An additional sediment budget was calculated for regions of the channel that experienced high levels of aggregate mining (2019–2020) to estimate how much gravel had been removed by aggregate mining activities. These regions were identified through visual inspection of the 2019 and 2020 DEMs and aerial imagery acquired during the LiDAR surveys. Once identified, the 2019 and 2020 DEMs were cropped to the heavily mined regions and ran through GCD with the same parameters (i.e. error masks, probabilistic thresholding, segmentation, etc.) as the whole 2014, 2019 and 2020 Bislak DEMs.
Two-dimensional flood modelling
To investigate whether geomorphic change within the Bislak River influences flood routing and inundation, widely used (e.g. refs. 54,55) HEC-RAS 2D software38 was used to predict inundation patterns. The 2019 and 2020 DEMs both featured identical floodplain topography (from 2019) but different active channel DEMs. A consistent floodplain DEM was used to ensure that observed changes in flood inundation resulted from geomorphic change within the active channel and not from any anthropogenically caused topographic changes on the floodplain.
To represent the topographic complexity of the model domain, a 2D grid cell size of 3 m was used in the active channel, with 5 m cells on the floodplain (Supplementary Information, Two-dimensional flood calibration; Supplementary Fig. 3, Supplementary Table 17). Manning’s roughness was uniformly set to 0.05 based on calibration with an observed flood event (Typhoon Ineng). Hydrographs were specified as the input boundary condition, with the downstream boundary set to the normal depth. For 2D modelling of gradually varied flows, the full St Venant shallow water equations were used. The unsteady flow function in HEC-RAS was applied to simulate a hydrograph that was ramped up to the desired discharge over 10 h of simulation time and then run for a further 14 h at a constant discharge to achieve a steady state. Flood events with return intervals of 10-, 50- and 100-years were simulated across both the 2019 and 2020 Bislak DEMs. Water depth (>100 mm), velocity, and shear stress predictions were exported for analysis.


Responses