COVID-19, school closures, and student learning outcomes. New global evidence from PISA
Introduction
Schools throughout the world closed in response to COVID-19 beginning in 2020. In some cases, they quickly reopened in 2021, but in some countries, they remained closed longer1. Globally, schools were closed for an average of 5.5 months (22 weeks) since the onset of the pandemic, but with considerable variation across region and even across countries within a region2. Early on, the school closures were expected to contribute to what was already described as a learning crisis3,4.
Country studies show large losses5,6,7,8,9,10,11. However, country studies are based on different samples, time frames, ages, sample sizes, subjects and so on, making it difficult to make comparisons. Measuring learning loss in a single country could hide many differences. This would tend to compound common limitations of learning loss studies. There is a measurement effect meaning that learning losses could be over-estimated when measured immediately after a break from learning12,13. Even after a break from schooling or school closure, there are differential impacts. For example, summer break is more detrimental for math than for reading, and middle-class students appeared to gain on grade-level equivalent reading recognition tests over summer while lower-class students lost on them14. Also, during a long break from schooling, such as the COVID-19 pandemic induced closures, testing may have different effects. For example, remote testing is less controlled than in-school testing. This affects engagement. It has been shown that disengagement increases across grade level15. All this suggests that individual national studies should be used with caution when trying to assess learning loss beyond the study population. Nevertheless, there are several systematic reviews and meta-analyses, and these suggest an average learning loss attributable to COVID-19 school closures of 0.17 of a standard deviation—that is, at least one-third of a year’s worth of learning16,17,18,19,20. Distance learning during the school closures does not seem to have helped much21,22; only the duration of school closures led to variations. Most studies observe increases in inequality where certain demographics of students experienced learning losses that were more significant than others. These learning losses could translate to earnings losses and could cost this generation of students trillions of dollars23.
Also, global studies—that is, studies using data from international assessments where students in many countries take the same tests and under the same conditions, thus, making them comparable across country and time—document significant learning losses24,25. International reading scores declined by an average of 33 percent of a standard deviation, equivalent to more than a year of schooling. Losses are greater for disadvantaged students, those struggling before the pandemic, and by duration. However, until now, there has only been one international student assessment. It covered only fourth grade students in just 55 countries.
In this paper we examine the impact of schooling disruptions on student mathematics, science, and reading scores using large-scale, internationally comparable student achievement tests from the OECD’s Program for International Student Assessment (PISA) study. These assessments have been conducted every three years since 2000, with the latest implementation in 2022 collecting student results after the school closures caused by the COVID-19 pandemic. Overall, the data explored in this study represent 175 million 15-year-old students in 72 countries. By combining data from previous rounds and the post-COVID round for countries that have over-time data, we can see the evolution of mathematics and science scores before and after COVID-19. We model the effect of closures on achievement by predicting the deviation of the most recent results from a linear trend in mathematics. While we focus on mathematics as it is the most reliable achievement measure in PISA 2022, we provide similar results for science and reading.
To compare countries with shorter and longer school closures, we use information from students and principals on how long their schools were closed during the pandemic. We also use UNESCO data on school closures (full closures and full or partial closures). All measures of the length of closures were recoded into the number of weeks. We compare results on these four measures to check robustness of the findings to the definition of school closure and data source.
We model the effect of the pandemic on student achievement by predicting the deviation of the most recent 2022 results from an estimated linear trend in mathematics, reading, and science achievement using comparable data from all PISA rounds, using the model estimated using PIRLS24. We estimate each country’s linear trend separately and include country-level fixed effects to control for unobserved time-invariant country characteristics. In addition, we control for individual student gender, socioeconomic status, immigrant background, and we also control for country-averages of these indicators to exclude any potential biases arising from changing student samples. We perform multiple robustness checks to see if our results hold depending on regression specifications and data selection. We also run placebo tests to see if our regression model identifies similar effects assuming false-treatment in other years.
The pandemic could affect students in different ways. Disruptions could affect health, economic, and social well-being. Thus, after estimating the overall effect of the pandemic on achievement, we use information on the number of weeks of school closures to show how achievement differs from the time trend depending on the country-average school closure duration. In this case, we capture the departure of achievement in 2022 from country-specific time trends assuming no school closures, and separately the difference in achievement change per week of closures. We also test for differences in the impact of the pandemic on boys with girls as a baseline, immigrant students with natives as a baseline, or students with different socioeconomic backgrounds. Finally, we investigate heterogeneity in the impact of school closures by achievement level using unconditional quantile regressions.
Results
Learning loss in mathematics
The overall learning loss estimates are presented in Supplementary Table 3 (column 1), along with estimates depending on weeks of closures for four different measures of the length of school closures (columns 2–5). The overall decline in mathematics associated with pandemic-era school closures is 12 points. In 2022, the average within-country SD of mathematics is 86.2. Thus, the decline in achievement is equal to 14.2% of a SD. Considering that one year of learning is equivalent to roughly 20 points on the PISA scale26, this means that on average across around 70 countries students lost an equivalent of more than 7 months of learning.
Results in columns (2) to (5) show that one week of school closures is associated with an additional decline in student achievement. The estimates per week of closures vary across the measures of the length of closures and are not directly comparable as they reflect different definitions of closures. The clearest definition is the full closure defined by UNESCO; thus, this parameter (−0.44) will be used further to estimate the global welfare losses. We compare results calculating the learning loss for different percentiles of each measure of the length of closures. Figure 1 compares the estimated learning loss for the countries with the shortest (10th percentile of the length of closures in each of the four measures), short (25th), average (50th), long (75th) and the longest school closures (90th).
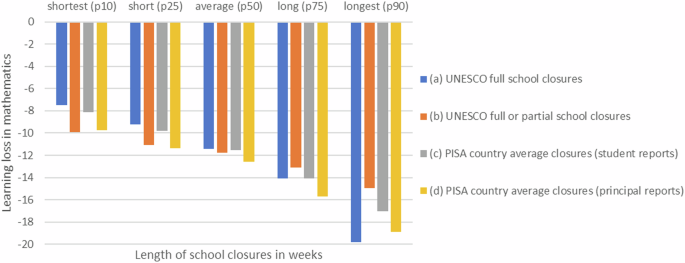
The length of school closures is associated with the estimated learning loss. The regression estimates are presented for the four models with different variables measuring school closures using UNESCO data on (a) full, b full plus partial closures, and the PISA data from (c) students and d principals. The results are consistent across the four definitions of school closures, showing that students in countries with the shortest closures (10th percentile of all participating countries) lost around 8–10 points or 9–12% SD. Students in countries with average closures lost around 12 points (13–14% SD), while students in countries with the longest closures (90th percentile) lost 15 points or more (17–23% SD).
Two things are worth noting when looking at the estimates in Fig. 1. First, the learning losses increase with the length of school closures. This shows that the achievement decline is associated with school closures and not only the overall impact of the pandemic on students. Second, the four measures provide similar results when comparing relative standing of countries in terms of the length of school closures. Countries with the shortest closures experienced relatively small losses, 9–12% of a SD, or 4–6 months of learning. Countries with average length of school closures experienced losses of 13–14% SD, or 7 months of learning. Countries with the longest closures, experienced losses of 17–23% SD, or 9–12 months of learning.
Learning loss by gender, immigrant background, and achievement level
The pandemic and school closures could affect students of different backgrounds differently. For example, differences in self-regulation, motivation, home and school support, gender, immigrant background, socioeconomic status, and achievement level, could lead to differences in how students learned during the pandemic. We re-estimate the main models with separate time trends for groups of students and test whether the departure from the linear time trend in 2022 and the effects of the length of school closures significantly vary between groups.
While boys and immigrant students experienced a lower learning loss compared to girls and natives, nevertheless, longer school closures had a more negative effect on both groups (see Supplementary Table 4). Depending on the closure length measure, each week of school closures was associated with 0.17 or 0.15 points of additional decline in achievement for boys. At around 40 weeks of full school closures, the overall learning loss for boys is the same as for girls and increases for longer closures. Students with an immigrant background lost 0.33 points with every week of full school closures and while in countries with shorter closures their learning loss was smaller, for countries with around 25 weeks of closures their learning loss is equal to that for natives, but it increases for longer closures.
After the pandemic, the relationship between achievement and student socioeconomic background became slightly stronger. The slope of the ESCS index measuring socioeconomic status in PISA increased by 2.62 points. In PISA 2012, the last time mathematics was the main domain before the pandemic, the OECD average slope was around 39 points. Thus, the pandemic increased socioeconomic inequality as measured by the ESCS regression slope by around 7%. On the other hand, every week of full school closures diminished this increase by 0.12 points. It means that socioeconomic disparities increased only in countries with relatively short closures, below 22 weeks, and for countries with longer closures the pandemic decreased the relationship between socioeconomic background and mathematics achievement.
Additional analyses using unconditional quantile regressions reveal significant differences in the learning losses between countries with different lengths of school closures. OECD reports that direct comparisons between PISA 2012 and 2022 results show that, on average across countries, declines are similar across the mathematics achievement spectrum27. Our quantile regression estimates in Supplementary Fig. 1 show this is true only for countries with relatively short closures. For countries with more prolonged closures, the declines are more significant among the lowest-achieving students, while in all countries, the best-achieving students lost around 8–9 points. For the average student, the loss ranges from around 14 points in the countries with the shortest closures but increases to 24 in countries with the most prolonged closures. For the lowest achieving students, the loss ranges from 8 points in the countries with the shortest closures to 33 points in countries with the most prolonged closures. In other words, the learning loss increases with the length of school closures for the average- and the lowest-achieving students but is similar across countries for the best students.
Results for reading and science
Reading and science, as defined by the PISA assessment framework, are also complex domains in which students’ achievement develops over time as students build knowledge but also develop skills related to reading comprehension or scientific inquiry. Previous studies show that in reading, for example, students’ progress between primary and secondary education differs significantly and is related to system structure and quality of teaching28. Thus, one could expect similar changes caused by the pandemic in these two domains, not only in mathematics.
In reading, the overall impact of the pandemic is similar to that for mathematics (Supplementary Table 5). Also, the effects associated with school closures tend to be similar. In science, the overall effect of the pandemic is insignificant. The results for reading and science should be interpreted with caution. The negative trends in student achievement started before the pandemic. Thus, our identification strategy, which relies on stable long-term trends, cannot be applied without doubts to reading and science. Our robustness checks for reading and science results confirm that indeed in these two domains the time trends are not linear, and one cannot distinguish between the effects of the pandemic and the long-term decline in achievement. What causes these long-term declines is beyond the scope of this paper. We can only note that both reading and science were minor domains in PISA 2022, meaning the measurement of student achievement was less precise than in mathematics.
Robustness checks
We check the robustness of our results in several ways. First, we run placebo tests by re-estimating the main regression model with a dummy variable capturing the departure from linear trends for every PISA cycle. These placebo effects should be insignificantly different from zero if our assumption of stable trends over time is valid. Figure 2 shows that although estimates for different years vary, representing small variation in results of different PISA rounds, only the departure in 2022 is substantial. This confirms two things. First, PISA results in mathematics were relatively stable before the pandemic. Second, the results in 2022 are distinct as they do not follow the average results from previous rounds.
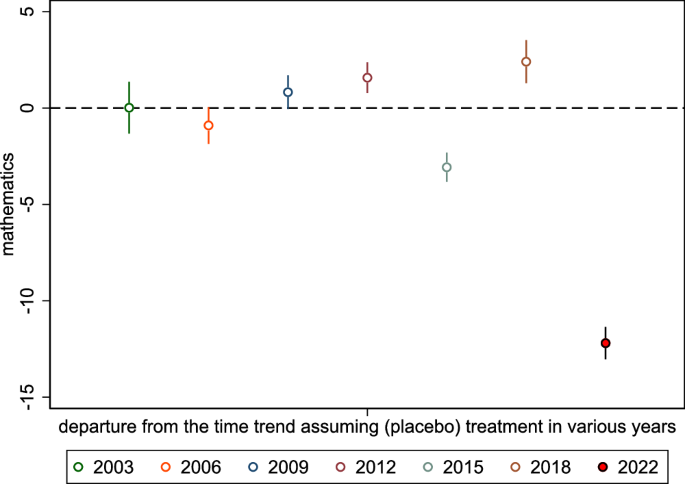
The placebo test checks the robustness of results by estimating similar regression models for a time trend departure for every year before the pandemic. The figure shows estimates for each year with 95% confidence intervals. Only the departure in 2022 is substantial. This indicates that PISA mathematics results were stable before the pandemic and that the decline in 2022 was not accidental.
To further test the robustness of our results, we use different regression specifications, controlling or not for individual and country-average effects. The results were nearly identical, demonstrating that the control variables included help to explain achievement variation but are not driving our results. Moreover, we estimated models with quadratic time trends, allowing for non-linear trends in achievement, and with different years dropped from the analyses. In both cases the results for mathematics did not change substantially. Finally, we re-estimated results with original survey weights representing the target populations of 15-year-olds in every country. These results show learning loss estimates for the global population represented by the PISA sample rather than for the average across countries. Again, the results were almost identical to those presented above using senate weights that give equal weight to every country (see Supplementary Table 6). For brevity, we present the main estimates only and descriptions of the regression model applied. Full results are available upon request from the authors.
Global economic impact and the need for learning recovery
Our model predicts that every week of full school shutdown will result in a 0.44-point achievement decrease. Using the UNESCO database, we estimate that the average learning loss across all educational systems is approximately 9 points. The literature offers several estimates on how PISA scores translate to economic growth. Although the range of estimates available in the literature vary depending on the set of countries, estimation methods, and control variables, we used the coefficient of 1.7429. The average loss of 9 points (9% of a SD) for 199 education systems (recognized by the UNESCO school closure database) translates to an average of 0.15 percentage points of GDP growth losses, ranging from zero (if schools remained open) up to 0.57 points. This enormous GDP loss in nominal values using World Bank GDP 2021 data equals $17 trillion of economic loss. These estimates are similar to other studies23,30,31.
To avert some of these losses, then learning recovery is needed. There is some evidence of recovery in some countries, but the evidence is mixed9, there are even cases of further losses32. During the school closures, online tutoring programs were shown to reduce learning loss significantly in several randomized controlled trials33,34 but the evidence base is limited. A large-scale randomized trial testing low-technology interventions—SMS messages and phone calls—with parents to support their child in Botswana improved learning by 0.12 standard deviations35 but this would not be enough to reverse the total losses and it has only been tested in a few low- and middle-income environments36, and the effects are limited when not implemented well and, in any case, would require additional inputs37. High-dosage and one-to-one tutoring was shown to be effective before the pandemic38; online tutoring variants might be effective and much less costly39 but more research is needed. Given the limitations of learning loss studies and what we know about summer learning loss, it would make sense to target resources to low performing students with appropriate and high-quality enrichment opportunities22,40. Designs of recovery programs will also have to deal with social impacts. There is much higher absenteeism today in schools, making recovery efforts challenging, especially for reaching low-performing students from disadvantaged backgrounds41. Also, where there has been some recover, we do not yet know which factors are responsible for this progress42.
Comparisons
There are only two other international comparisons using global achievement data, both using PIRLS24,25. For PIRLS, losses are about a year’s worth of learning. But using PISA, we find seven months’ worth of losses. This could be because more time has passed since the pandemic: PIRLS compared results over time to 2021, while PISA looked at results up to 2022. Also, PISA students are much older: 15 years compared to an average age of 10 for PIRLS. Studies investigating student self-regulation skills have shown that in general older students are better able to seek assistance, set goals, plan, monitor, and organize their learning. Hence, it may be that younger students and boys may be more strongly impacted by the school closures compared to older students43.
Interestingly, our results are similar to what systematic reviews are finding learning16,17,18,19,20,44,45. A causal estimate of the impact of duration of school closures finds that for every week that schools were closed, learning levels declined by almost 1% of a standard deviation1.
Discussion
We estimate the global impact of COVID-19 on student learning on standardized tests over time. We model the effect of closures on achievement by predicting the deviation of the most recent results from a linear trend in mathematics and science achievement using data from all rounds.
COVID-19-induced school closures led to significant student learning losses. Math scores declined from 2018 to 2022 by an average of 12 points, or 14% of a standard deviation (SD), roughly equivalent to 7 months of learning. Larger declines are recorded for students in schools that faced relatively longer closures and for lower-achieving students. Countries with the shortest closures experienced relatively small losses, while countries with the longest closures experienced losses of around 20% of a SD, or up to 12 months of learning. Depending on the closure length measure, each week of school closures was associated with 0.15–0.17 points or around 0.2% of a SD of additional decline in achievement for boys. At around 40 weeks of full school closures, the overall learning loss for boys is the same as for girls and increases for longer closures. Students with an immigrant background lost 0.33 points or 0.4% of a SD with every week of full school closures and while in countries with shorter closures their learning loss was smaller, for countries with around 25 weeks of closures their learning loss is like the learning loss for natives, and it increases for longer closures.
Distributional analyses reveal significant differences in the learning losses between students at different achievement levels in countries with the most prolonged school closures. For countries with below-average lengths of school closures, the learning loss is similar for low-, average-, and high-achieving students. However, in countries with lengthy closures, the learning loss is more extensive among the average students and even more considerable among the lowest achievers.
Methods
PISA data
Internationally comparable achievement data in mathematics and science come from the OECD’s Program for International Student Assessment (PISA). Since 2000, PISA was implemented every three years, with only a longer four-years break between 2018 and 2022 due to the pandemic. Databases include results of 15-year-olds coming from eight cycles of testing, including data from 100 countries and economies. We use data from 72 countries with results available at least from 2022 and one round of assessment before the pandemic. Our sample includes more than 3 million students participating in all rounds.
PISA data include plausible values measuring mathematics achievement comparably across all rounds since 2003. For reading, the results can be compared across all PISA cycles since 2000. For science, achievement scores are comparable since 2006. Every PISA cycle has its main domain, which in practice means that student answers many more questions in this domain and their scores are more reliable than in other domains. The most recent round in 2022 focused on mathematics. Mathematics was also the main domain in 2003 and in 2012, providing us with reliable data on long-term achievement trends in this domain. Thus, in our paper we focus on mathematics results, while we also discuss results for reading and science. Moreover, the pandemic had a larger impact on math scores for students residing in high poverty areas46.
Summary statistics for student achievement and sample size across 2000 and 2022 are presented in Supplementary Table 1. These data differ from those presented in official PISA reports as we included only countries for which trends could be estimated. While scores in all domains tend to decline, these are not directly comparable since different countries participated in each round. The sample sizes also vary across domains as in different years results for some countries were withdrawn in single domains due to technical issues. Thus, the results cannot be simply compared across time to analyze achievement trends, and we propose a regression framework adjusting for time-invariant country characteristics and for country-specific time trends.
PISA data also include detailed characteristics of students and their schools. We use information on gender, socioeconomic status, and immigrant background to explain differences in achievement scores, but also to control for possible changes in student samples across time. The PISA measure of socioeconomic status (ESCS) is an index measuring student family economic, social, and cultural status. We use scores that were equated to 2015 to make them comparable across cycles. In the regressions, we use student-level variables as typical control variables but also country averages for every cycle to adjust for sample and population changes over time.
The paper relies on anonymized datasets on the OECD websites, including individual student results and background information. The data are collected nationally following PISA Technical Standards and privacy and data security regulations in each country. The International PISA Consortium and the OECD only receive anonymized data. In most countries, student or guardian permission is required to participate in the study. Moreover, all national centers need to follow OECD Personal Data Protection Rules, which allow individuals to refuse participation in the study or withdraw their data after collection. The details are provided in the OECD’s Data Protection Notice available at https://www.oecd.org/content/dam/oecd/en/about/programmes/edu/pisa/pisa-research-documentation/OECD_PISA_2022_Data_Protection_Notice.pdf.
Data on school closures
Finally, we use information from students and principals to estimate length of school closures and to analyze policies and practices implemented during remote education. In 2022, students and principals were asked for how long their schools were closed due to COVID-19. We recoded their responses to the number of weeks of school closures.
We also merge PISA data with information from UNESCO47 on the total number of weeks schools were closed fully or partially. Since the pandemic began, UNESCO monitored school closures and modalities for delivery around the globe daily. Schools were considered fully closed in case of “government-mandated closures of educational institutions affecting most or all of the student population.” On the other hand, schools were considered partially open when: (a) open in certain regions and closed in others; and/or (b) open for some grades, levels, or age groups and closed for others; and/or (c) open with reduced in-person class time, combined with distance learning48.
Descriptive statistics for the four measures of the length of school closures caused by COVID-19 are provided in Supplementary Table 2. All four measures are reported in weeks. All measures are correlated (from 0.6 to 0.8), but as the definitions and data collection modes vary, the actual numbers are different. None of the measures is perfect and can be taken as preferred over others. The length of full closures as reported by UNESCO is probably the best objective measure, but it limits comparisons to closures of all schools in the whole country, while many countries relatively quickly decided to close schools only when necessary. Also, it does not differentiate between levels of education even if in some countries decisions were different for primary and secondary education. The second measure from UNESCO includes partial closures but does not differentiate between weeks when only one school was closed in a country and weeks when, for example, most schools were closed. PISA-provided data reflect the intensity of closures in every country as they are calculated as the average across students and schools. However, these data are self-reported relying on people’s memory and their understanding of what school closure means. Finally, while principals report closures for their schools, many students taking PISA in 2022 where in different schools during the pandemic, for example, in primary schools that could experience different closures.
To make the results comparable across different measures of the length of school closures, we calculate the learning losses for the 10th, 25th, median, 75th, and 90th percentile of each school closure measure. Thus, the results are reported for countries with very short, short, average, long, and very long school closures relatively in each of the four measures. Comparing estimates across school closure measures assures that our results are not driven by data sources or definitions (Table 1).
Empirical strategy
We model the effect of the pandemic on student achievement by predicting the deviation of the most recent 2022 results from an estimated linear trend in mathematics, reading, and science achievement using comparable data from all PISA rounds, using a similar model as estimated earlier with PIRLS data24. We estimate each country’s linear trend separately and include country-level fixed effects to control for unobserved time-invariant country characteristics. The linear regression model is:
where i denotes students, j schools, and k countries with n equal to the number of countries. In this case, D equals 1 for 2022 data collected after the pandemic and zero for previous years; (beta) captures the country-specific time trend in student achievement and ({X}_{i}) is a vector of socio-demographic variables at a student and country level (gender, socioeconomic status, immigrant background). In this case, (tau) is our estimate of interest capturing the average departure of achievement in 2022 from the long-term trends in different countries.
Identification of the impact of the pandemic on achievement depends on the estimation of achievement trends before the pandemic and the dependency of results on regression specifications. Thus, we perform multiple robustness checks. We first estimate Eq. (1) on the pooled data from all rounds of PISA with comparable achievement data (8 rounds for reading, 7 for mathematics, and 6 for science). Next, we test for non-linear trends using quadratic terms for time. Then, we re-estimate it for shorter periods deleting data from 2000, then from 2003 and 2006, and so on, leaving at the end the 2018–2022 comparison only. Moreover, we estimate results for the OECD countries only, and we use different weighting methods: one estimating results for the whole population of 15-year-olds in participating countries and then using the so-called senate weights which weight each country equally, which is a standard approach in OECD reports49. Finally, we try different regression specifications, including additional control variables. We compare these results to see if the main estimates of the learning loss are robust to different regression and sample specifications.
The pandemic could affect students in different ways. Disruptions could affect health, economic, and social well-being. Thus, after estimating the overall effect of the pandemic on achievement, we use information on the number of weeks of school closures to show how achievement differs from the time trend depending on the country-average school closure duration. We estimate the following regression model:
The model is specified as before, but the interaction term between a dummy denoting 2022 data and a measure of the length of school closure in weeks provides an estimate of how the departure in 2022 depends on the length of closures. In this case, (tau) captures the departure of achievement in 2022 from country-specific time trends assuming no school closures. In a sense, it captures the impact of other factors than school closures that affected students during the pandemic. We focus here on (pi), which captures the difference in achievement change per week of closures.
As discussed in the data section, we use four measures of the length of school closures: (1) UNESCO full closures; (2) UNESCO full and partial closures; (3) PISA student reported closures; and (4) PISA principal reported closures. All are expressed in terms of weeks of school closures. We use (tau) and (pi) to calculate the learning loss for countries with shorter or longer school closures, comparing results at the percentiles of each school closure measure reported.
This model can be further expanded to test for differences in the impact of the pandemic on boys with girls as a baseline, immigrant students with natives as a baseline, or students with different socioeconomic background. To achieve this, we add interaction terms between all variables in the regression model above and individual student characteristics. In this case, the estimated coefficient for the interaction between ({D}_{2022}) and a dummy for boys, for example, shows the differential impact of the pandemic on boys, after controlling for separate time trends by gender in each country. Moreover, the interaction term between a dummy for boys and ({D}_{2022}* {{weeks}}_{k}) shows how boys were differently affected by weeks of school closures.
We also use this model to test if actions taken during the pandemic alleviated the impact of school closures. In this case, we interact with ({D}_{2022}) and ({D}_{2022}* {{weeks}}_{k}) with several PISA indicators capturing school and student support and action during the COVID-19 pandemic. As these indices are reported on different scales, we categorize them into low, average, and high values. The low category is always the baseline, and we estimate whether the learning losses were greater or smaller in average and high categories compared to this baseline.
Finally, we investigate heterogeneity in the impact of school closures by achievement level. Some country studies reported more significant losses among low-achieving students, while others showed similar losses across the achievement spectrum. To check how globally learning losses vary among students of different proficiency, we re-estimate the main models using unconditional quantile RIF regressions, fitting regressions with the same specifications as in Eq. (2) to explain achievement trends for students at different percentiles of PISA scores50.
PISA data are collected through a complex stratified survey with schools sampled as primary sampling units and students sampled at the second stage. We use the sets of replicate balanced repeated replication (BRR) weights provided in the data to obtain sampling errors. In addition, we estimate measurement errors by estimating variation among point estimates obtained for different plausible values. As up to PISA 2018 databases contain only five plausible values and 10 since 2018, we use only the first five for 2018 and 2022 data. The final standard errors are obtained by the so-called Rubin’s formula, the same way as in the official OECD publication27.


Responses