Cross-species transcriptomics translation reveals a role for the unfolded protein response in Mycobacterium tuberculosis infection

Introduction
For infectious diseases, as with all pathophysiologies, animal studies continue to be considered valuable toward understanding mechanisms involved in the human context. However, translation of biological insights from animal experiments to human conditions remains severely limited, with important consequences including a significantly lower-than-desired probability of success in clinical trials1,2,3. A major reason for this problem is that, while mechanistic pathways and processes involved in disease are generally believed to be broadly conserved among at least mammalian species4,5, their quantitative—even if only in relative terms—contributions to the phenotype of interest will likely be disparate between two given species. Figure 1a illustrates this scenario in which the foremost mechanistic processes/pathways influencing a disease state for one species versus another often differ in their relative importance. Consequently, if scientists focus on the mechanism most prominent in the animal studies, there will be a substantial probability that—while that mechanism likely contributes to disease in the human context—it will not be decisively vital for understanding the human disease phenotype. Accordingly, putative clinical treatments based on the “tip of the iceberg” animal finding may exhibit disappointing failure. Even if the animal model and human disease share the most significantly contributing pathway or process, resistance mechanisms are common in complex disease, and these will be disparate between the preclinical model and the clinical reality. In order to address this critical challenge, we and others have begun to pursue new approaches to enhancing translation proficiency centered on a systems biology perspective6,7,8,9,10,11.

a Schematic comparing the ideal (top) and realistic (bottom) relationships between disease-associated biology in an animal model and human disease. b Single sample GSEA where each gene set is one of 49 published TB gene signatures, containing at least 10 genes, for discriminating between active and latent human TB disease. The median enrichment of the gene set in each phenotype (i.e., active or latent) is plotted as one data point. A line connects paired data points relating to the same gene set. P values and statistical significance are calculated using Wilcoxon signed-rank test.
As an important current example of this problem, tuberculosis (TB) continues to be a major world-wide threat to human health as one of the leading causes of death from an infectious agent, second only to COVID-19 in 202212. Exposure to the causative agent, Mycobacterium tuberculosis (Mtb), results in a spectrum of outcomes ranging from bacterial clearance to chronic asymptomatic infection and progressive disease of the lung or other anatomical sites13. Despite this heterogeneity, Mtb infection outcome is often categorized in a binary fashion. Those that remain asymptomatic are classified as having latent TB infection (LTBI), whereas those with disease are considered to have active TB (ATB). This dichotomous framework is clinically useful but ignores the heterogeneity within each group which likely represents a variety of diverse and transient biological states14. Genetic and epidemiological studies have revealed that Mtb infection outcome is influenced by genetic composition of both the host and pathogen, as well as a variety of nutritional and other environmental factors15. This diversity in both risk factors and disease phenotypes implies multiple underlying mechanisms14,16, some of which remain unclear.
Further complicating the study of human TB and development of effective vaccines and therapeutics, there are many phenotypic and physiological differences observed in preclinical animal models of TB and human disease17,18. While several studies have successfully identified transcriptional similarities and disparities between Mtb-infected mammals and human cohorts19,20,21, to our knowledge, no study has explored whether there are any subdominant pathways in existing TB preclinical models that may be highly indicative of human TB disease state.
We recently developed a systems modeling framework known as Translatable Components Regression (TransComp-R) that is designed to account for biological heterogeneity by identifying multiple orthogonal axes of variation in one species that are correlative with disease biology and phenotypes observed in another species6. Applying this framework in the context of inflammatory bowel disease (IBD), the study demonstrated that previously unappreciated mouse proteomic features could provide insights relating to human transcriptomic expression, allowing for better classification of patient responses to IBD treatment and identification of novel pathways implicated in therapy resistance. TransComp-R has since been applied, and extended to translate gene pathway analyses, with success in the realm of neuropathologies but has yet to be applied in the context of infectious disease22,23.
Here, we adapt TransComp-R to identify biological pathways in a murine TB model that distinguish human LTBI from ATB. To do so, we utilize data from a study by Moreira-Teixeira et al.19 which illustrated that a transcriptional signature prominently found in humans with ATB, reported by Singhania et al.24, could also be found in a cohort of mice designed to reflect different degrees of disease via the inclusion of two mouse strains, with differing susceptibility to infection, and two Mtb isolates administered at different doses. Instead of focusing on whether similar signatures are dominant in both humans and mice, our approach is aimed at discerning which transcriptional responses in the mouse model best predict human TB phenotype. Consequently, some of the pathways identified may not be traditionally anticipated as hallmark, or “tip of the iceberg”, TB disease-associated pathways in previous mouse studies. We demonstrate that a linear mathematical model built on the mouse blood transcriptomic data can accurately predict human disease state and consequently allow us to identify murine features highly correlative of human TB phenotype that may have less significance in a mouse-specific Mtb infection model. We identified a diverse range of TB-associated pathways, in addition to the commonly identified IFN and neutrophil signatures. Prominent among these predictive pathways is protein translation, which we show is a feature of the Mtb infection-induced Unfolded Protein Response (UPR) in macrophages. We demonstrate that this cellular stress pathway controls a variety of immune-related functions in Mtb-infected mouse macrophages, suggesting a possible causative role during the development of TB disease. Overall, we illustrate how translational cross-species modeling allows us to hypothesize previously unappreciated biological mechanisms contributing to TB disease and identify potential therapeutic targets.
Results
Direct comparison of gene expression across species reveals molecular discrepancies between preclinical models and human TB disease
Aiming to learn more about the relationship between the transcriptional response in TB animal models and human TB patients, we utilized mouse and human bulk blood transcriptomics datasets previously published in studies by Moreira-Teixeira et al.19 and Singhania et al., respectively. The murine TB model used in this study contrasted C57BL/6J with the relatively sensitive C3HeB/FeJ mouse strain to reflect differing degrees of disease (Supplementary Table 1). To further increase heterogeneity in disease presentation, Moreira-Teixeira et al. also incorporated two different Mtb strains, given at two different doses to different cohorts of mice. Due to the excessive pathology in some groups, the blood sample for transcriptomic analysis was collected at different time points for different mice, always at least 26 days after infection with Mtb. As was done by Moreira-Teixeira et al. we compared this murine cohort to human transcriptomic data from the Singhania et al. study, focusing our study on the London and South Africa cohorts (Supplementary Table 2).
As there have been major efforts towards identifying small gene signatures that differentiate human ATB and LTBI transcriptional responses in the past25,26,27,28,29,30,31, we sought to determine how well these gene sets discriminate the two mouse strains, C57BL/6J and C3HeB/FeJ, which are commonly utilized in unison to reflect a spectrum of human TB phenotypes. We compared the enrichment of 49 different published TB gene sets, each identified from human cohorts, in humans to that in the mouse model, separated by Mtb strain (Fig. 1b). While these signatures distinctly distinguished human phenotypes, we observed weaker differentiation between mouse strains when infected with the H37Rv Mtb strain. Furthermore, while most of the gene signatures were more highly enriched in the human ATB patients relative to the LTBI patients, the directionality of enrichment between mouse strains was inconsistent across gene sets, highlighting incongruent biology in the mouse model relative to observations in human disease. This was even more evident in the mice infected with the clinical Mtb isolate, HN878, as there were no statistically significant differences in gene set enrichment between mouse strains. These strain- and species-specific differences emphasize the differences in disease-associated biology across systems (Fig. 1a) and, consequently, the gap in our ability to translate between species solely using direct comparison of the expression of homologous genes and pathways.
TransComp-R model identifies murine transcriptomics signatures relevant to human TB disease phenotypes
Rather than comparing individual genes or pathways on a one-to-one basis between species, we sought to construct a cross-species model that identifies transcriptomics-derived axes of variation in the mouse TB model that correlate with human TB phenotypes and may allow us to discover novel mechanisms driving disease that are typically overshadowed by IFN and neutrophil signatures. To do so, we leveraged our previously established TransComp-R framework. TransComp-R utilizes both human and animal data to develop a better understanding of the relationship between animal models and human biological mechanisms, ultimately allowing us to develop further understanding of the human disease pathology, progression, and/or prevention. Briefly, dimensionality reduction is first applied to the mouse model to generate a small number of latent variables, here also known as principal components, that capture the majority of the variation in the mouse data (Fig. 2). Then, using the feature (e.g., gene) loadings for each mouse principal component (mPC), the human homologs are projected into the mouse latent variable space. In other words, the human data is transformed based on the relative importance of each mouse homolog such that the human data can be described in terms of distribution across mPCs. Since there is no guarantee that mPCs that describe the most variation in the mouse data will capture differences in the human phenotype of interest (e.g., LTBI vs. ATB), the mPCs with the greatest univariate effect size between LTBI and ATB samples were selected to be included in the final logistic regression model. Regressing the human phenotypic classifications onto the selected mPCs validates the importance of the selected mPCs, and thus the relative importance of each mouse gene, in discerning between human disease states. From here, gene set enrichment analyses can be performed to garner understanding of the potentially sub-dominant biological pathways in mice that prominently correlate with active or latent TB in humans.
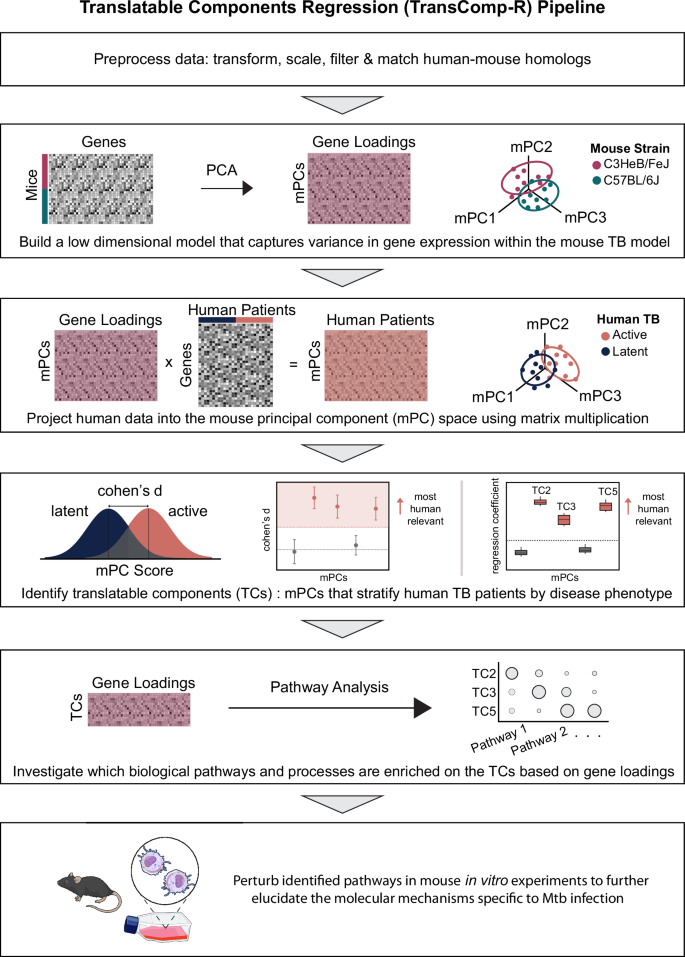
Each box outlines a step in constructing, interpreting or validating the cross-species model. Abbreviations: mouse principal components (mPCs), tuberculosis (TB), translatable components (TCs), Mycobacterium tuberculosis (Mtb). The final box includes illustrations from NIAID NIH BIOART Source (bioart.niaid.nih.gov/bioart/279; bioart.niaid.nih.gov/bioart/313; bioart.niaid.nih.gov/bioart/303).
To minimize random noise, we chose to build the foundations of our model on genes that were differentially expressed (DEGs) in our human cohorts, and their mouse homologs (Supplementary Fig. 1). As detailed above, we built the foundations of our cross-species model by performing principal component analysis (PCA) on the 3201 DEG homologs in the different mouse cohorts (Fig. 3a). Separation between the two mouse strains is noticeable on the first two mPCs, with statistically significant univariate distribution between strains along each mPC. This did not come as a surprise based on existing literature on the distinct susceptibility and disease pathologies observed in C57BL/6 and C3HeB/FeJ mice. The mouse data had several known sources of variation beyond mouse strain; specifically, Mtb strain, Mtb dose and days post-infection for sample acquisition also varied between samples. To distinguish which, if any, mPCs these variables influenced, regression models were built to regress each covariate onto the scores of each mPC, individually (Fig. 3b). This analysis revealed that most of these sources of variation significantly correlate with the distribution of scores on various principal components, especially mPC1. We can also see this visually when we color the scores plot by each covariate (Supplementary Fig. 2). Each of these sources of variability (mouse strain, Mtb strain, dose, and time point) could reflect different aspects of human disease. We continued our study with all the mouse data to include the greatest possible extent of molecular variation in the data structure of our model, with hopes of most effectively translating these highly controlled mouse data to naturally heterogenous human populations. The first 20 mPCs explain 75% of the variance across the murine data and, thus, were included in the next step of the model (Fig. 3c).
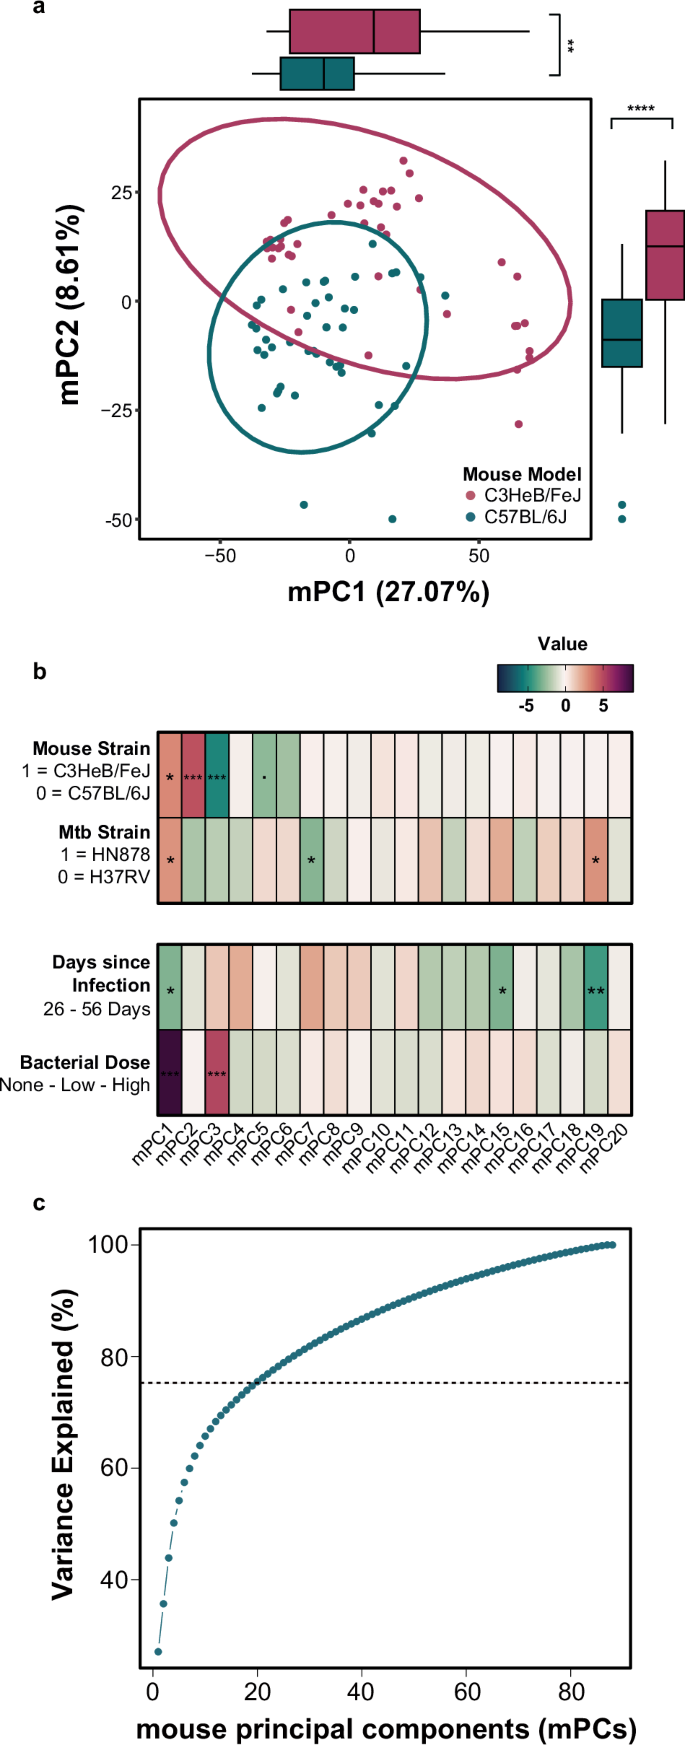
a Principal component analysis on mouse homologs of the human differentially expressed genes in latent vs. active tuberculosis. Each data point represents a mouse sample, and the colored ellipses represent the 95% confidence interval for each strain’s distribution in the PC1 vs. PC2 space. Boxplots on the x- and y-axes illustrate the distribution of the C3HeBFeJ (pink) and C57Bl6 (blue) mouse strain samples on each axis, respectively. Wilcoxon rank sum tests were performed on the scores of each mouse strain for each principal component to determine if the univariate distributions were statistically significantly different. **p < 0.01; ****p < 0.0001 (b) Regression model results from individual mouse principal components regressed onto mouse strain, Mtb strain, days post-infection, and bacterial dose. The Mtb strain and days since infection models do not include uninfected controls. Z values are shown for the logistic regression models (mouse and Mtb strain). T values are shown for the linear regression models (days post-infection and bacterial dose). Positive values (magenta) correspond with the C3HeBFeJ mouse strain, HN878 Mtb strain, longer time post-infection, and higher bacterial dose. ‘.’ indicates p < 0.1, * indicates p < 0.05, ** indicates p < 0.01 and *** indicates p < 0.001 after Benjamini-Hochberg multiple hypothesis correction. c Plot of variance explained across mouse principal components for the mouse PCA analysis. The first 20 PCs explain 75% of the variance and, thus, were kept for the TransComp-R model.
Next, data from the human TB cohorts were projected into our mPC space, resulting in human sample scores along the mPC axes. The projected samples showed substantial separation by TB disease status (LTBI versus ATB) on mPC1 vs mPC2, with 45% of the total variance captured by these two mPCs (Fig. 4a). This indicates that the mouse molecular data structure possesses information relevant to distinguishing between human TB phenotypes across multiple mPCs. The contributions to mouse data variance decrease as the order of the mPC increases, as expected, while the contributions to human data variance do not necessarily follow the same order monotonically (Fig. 4b). This suggests that common biological pathways explain different degrees of variation in the two species. Consequently, while 20 mPCs are required to explain 75% of the variation in the mouse transcriptional response to Mtb, 75% of the variation in the projected human transcriptomics is described over just 7 mPCs (Fig. 4b and Supplementary Fig. 3A). Thus, only the first 7 mPCs were included in the following steps of the model. The only human covariate, other than disease phenotype, that appeared to significantly correlate with any of the selected mPCs was the patient’s sex (Supplementary Fig. 3B). For comparison, PCA was also performed on the human data directly (Supplementary Fig. 4A). Interestingly, while significant separation between ATB and LTBI was observed on the first human PC, the distribution of samples on the second human principal component was not statistically significant (Supplementary Fig. 4A, B). In other words, there are more distinct axes of transcriptional variation in the mouse model that correlate with distinction of human ATB and LTBI than there are in the model constructed directly from the human transcriptomics data. It is plausible this phenomenon occurred because human PC1 alone can describe the majority of the disease status-specific variation as the model was built on human DEGs with significant differences between ATB and LTBI phenotypes. Alternatively, in the human data, the signal from genes involved in pathways classically activated by Mtb infection, such as IFN response, may shroud more subtle signals relating to pathways only activated in a subset of human TB patients.
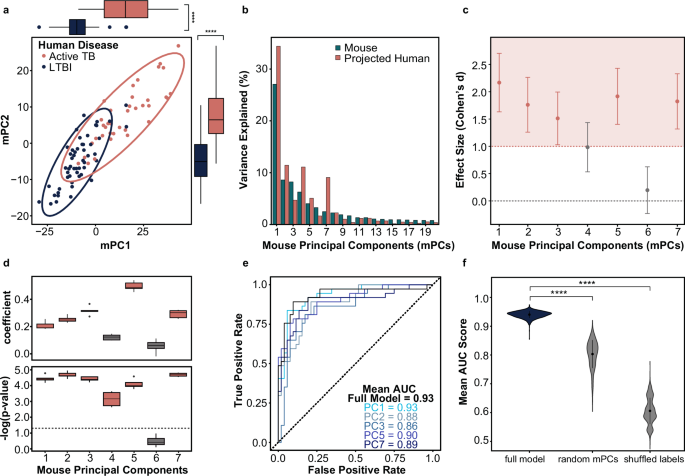
a Human latent vs. active tuberculosis samples projected into the mouse PC1 and PC2 latent variable space. Each data point represents a human sample, and the colored ellipses represent the 95% confidence interval for each disease group’s distribution in the PC1 vs. PC2 space. Boxplots on the x- and y-axes illustrate the distribution of the active tuberculosis (salmon) and LTBI (navy) samples on each axis, respectively. Wilcoxon rank sum tests were performed on the scores of each human phenotype for each principal component to determine if the univariate distributions were statistically significantly different. b Percent variance explained by each mouse principal component for the human and mouse data. c Plot comparing the univariate effect size observed between the ATB and LTBI human samples projected into each individual mPC. Effect sizes, measured by Cohen’s d coefficient, with a magnitude greater than one are shaded pink. Confidence intervals for each Cohen’s d coefficient are indicated by error bars. d The top boxplot shows the regression coefficient for each mPC when individually regressed on human outcome (ATB vs. LTBI). The bottom plot illustrates the corresponding p values, adjusted with Benjamini-Hochberg multiple hypothesis correction. The dotted line indicates a p value of 0.05. In both plots, the whiskers represent the IQR across 5-folds of cross validation (CV). e Mean ROC curves for 100 trials of 5-fold logistic regression on human disease phenotypes using projected human data onto mPC1, mPC2, mPC3, mPC5, and mPC7 individually and together (full model). f Mean area under the ROC curve (AUC) of 100 trials of 5-fold CV on the full TransComp-R model compared to null models with five randomly selected mPCs and null models with mPC1, mPC2, mPC3, mPC5, and mPC7 with shuffled phenotype labels. P values were calculated from pairwise Wilcoxon rank sum tests comparing the full model to the null distributions. **** indicates p < 0.0001.
Toward our goal of finding biological insights in the mouse data pertinent to human disease presentation, we then used the distribution of scores from the projected human data to calculate univariate effect size between phenotypes on each mPC individually (Fig. 4c). From this analysis, the magnitude of effect size along 5 mPCs stood out among the first 7 mPCs: mPC1, mPC2, mPC3, mPC5, and mPC7. When ATB and LTBI phenotypes were regressed onto these selected mPCs individually, we observed similar predictive capabilities (Fig. 4d, e). While regression of mPC4 had statistical significance (p < 0.05), we excluded it from subsequent analyses as both the effect size and regression coefficient of mPC4 was lower than the other 5 statistically significant mPCs. The mPC with the largest magnitude regression coefficient was not mPC1, but rather mPC5, highlighting the importance of including multiple mPCs in our analysis. The top five mPCs (mPC1, mPC2, mPC3, mPC5, and mPC7) were capable of predicting human ATB versus LTBI phenotype labels with high classification accuracy in logistic regression models of individual mPCs and together in one full model (Fig. 4e). Furthermore, the full model had significantly higher accuracy than null models with random mPCs or shuffled phenotype labels. These results suggest that our identification of five axes of variation (mPCs) in the mouse model that significantly correlate with human ATB and LTBI disease phenotypes was not due to random chance (Fig. 4f). Furthermore, while mPC1 may possess the most information relevant to variation in the mouse TB model, the other four mPCs appear to contain distinct yet pertinent information relevant to differentiating human TB phenotypes as well. Based on the proportion of human variance explained by each axis and their subsequent performance in classifying human TB disease states, mPC1, mPC2, mPC3, mPC5, and mPC7 were deemed to be the “Translatable Components” (TCs) of this model.
Translatable components reveal diverse biological pathways including protein translation
Due to the orthogonal nature of TCs, we expected that each would reflect distinct cellular processes. To investigate this potential heterogeneity, we used Ingenuity Pathway Analysis (IPA) to identify the functional pathways most associated with each TC and subsequently examined the association of each pathway with each TC (Fig. 5a, Supplementary Data 1). As anticipated, each TC associated with unique combinations of functional pathways. TC1 strongly associated with established disease-related pathways, specifically those related to neutrophil activity and interferon signaling. TC2 gene loadings demonstrated comparable alignment with interferon related gene sets but was not associated with neutrophil signaling. Notably, the gene loadings for the later TCs (TC2, TC3, TC5, and TC7) all reflect significant, though variable, associations with translation pathways, alongside different immunological pathways that define their unique identities, e.g., mPC3 also aligns with interferon gamma signaling and natural killer cell activity.
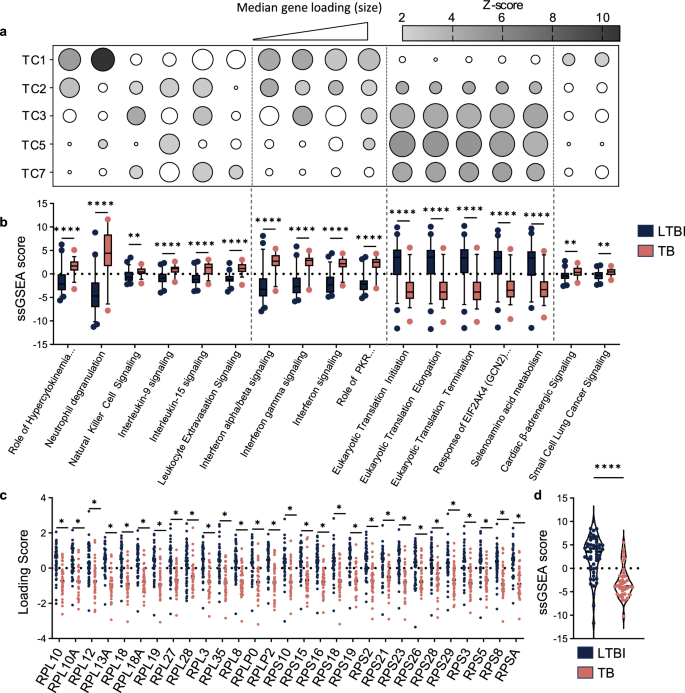
Pathways most associated with individual TCs were identified using IPA and categorized by function. a Dot plot heatmap illustrating association of all TCs with selected pathways. Shading represents absolute value of z-score, with unshaded circles indicating nonsignificant z-scores. Dot size corresponds to the absolute value of the median loading score for leading-edge genes. To align gene expression data with pathway activity, the sign of inversely correlated genes was reversed prior to calculating the median. b Comparison of ssGSEA signature scores for each selected pathway between patients categorized as LTBI or ATB. Box plots depict median and 5–95 percentiles. Statistical analysis was performed using multiple unpaired t-tests with Holm-Šídák multiple comparisons test. Leading-edge genes across the translation-associated pathways were compared to generate a common gene set. c Comparison of loading scores for individual translation genes within the human cohort. Significance was determined by multiple unpaired t-tests with Holm-Šídák multiple comparison correction. d Composite analysis of the translation gene set using ssGSEA across the human cohort. Statistical analysis was performed using unpaired t-test. *p < 0.05, **p < 0.01, ****p < 0.0001.
To affirm the disease-relevance of these pathways, we evaluated the strength of association between TC-aligned pathways and human TB disease state. Using ssGSEA, signature scores were calculated for each individual in the human cohort and compared between patients categorized as LTBI or ATB (Fig. 5b). We found that each pathway was differentially enriched in these two groups. As expected, signature scores for established disease pathways, e.g., those relating to neutrophils or interferon signaling, effectively differentiate between latent and active TB. Translation pathways were found to exhibit comparable differential enrichment between these groups.
Our analyses suggested that altered expression of translation-related genes is an important translatable feature of TB disease. To better understand this association, we compared the leading-edge genes across the translation pathways to identify common elements, revealing a shared gene set that is comprised of ribosomal components. For the shared gene set, we compared the expression of the individual genes across the human cohort (Fig. 5c), finding that each of the 29 genes was relatively repressed in the ATB group. Composite analysis of the gene set using ssGSEA similarly revealed significant differential expression between LTBI and ATB groups (Fig. 5d). Notably, when we look at the enrichment of this same gene set in the murine transcriptomic data in isolation, there is no difference observed between the two mouse strains, regardless of Mtb strain (Supplementary Fig. 5). Together, these results reveal that decreased ribosomal gene expression is a cross-species translatable feature of TB disease despite its lack of association with categorical determinants of disease severity in the mouse model.
Ribosomal mRNA repression is a feature of Mtb infection of macrophages and depends on the unfolded protein response (UPR)
Translational inhibition is a hallmark of the UPR, a cellular stress response triggered by proteotoxic stress in the endoplasmic reticulum or mitochondrion32,33. The response can be induced upon infection with intracellular bacterial pathogens34,35, and markers of UPR activation have been reported in human TB lesions36. Based on these observations, we hypothesized the regulation of ribosomal mRNAs associated with TC3, TC5, and TC7 may be linked to UPR activity in infected cells. UPR signaling is propagated by three distinct pathways initiated by the inositol-requiring enzyme 1 (IRE1α)37,38, activating transcription factor 6 (ATF6)39 or protein kinase R-like endoplasmic reticulum kinase (PERK)40. Each of these pathways contributes to the ultimate effects of UPR activation, which can include induction of chaperones, translational inhibition, and the potentiation of pro-inflammatory signaling32,41. To understand the influence of the UPR during Mtb infection, we assessed the impact of inhibition of the three canonical UPR pathways on the macrophage transcriptional response to the pathogen.
Mouse bone marrow-derived macrophages (BMDMs) were infected with Mtb in the presence or absence of chemical inhibitors targeting IRE1α (4 μ8c)42, ATF6 (Ceapin-A7)43, and PERK (GSK2606414)44,45 and mRNAs were quantified by RNAseq. We confirmed the inhibitors to be efficacious in BMDMs by assessing mRNA levels of known targets during tunicamycin-induced ER stress and found that these compounds did not affect the intracellular uptake of Mtb or the growth of the bacterium for the duration of the experiment (Supplementary Fig. 6A, B). Cluster analysis of the transcriptomic results revealed distinct expression patterns corresponding to the inhibition of each UPR pathway during infection (Fig. 6a, Supplementary Data 2). Using IPA, we found that each cluster is associated with pathways corresponding to different cellular functions. These clusters were primarily related to gene sets representing the following functions: cluster 1– cell cycle, cluster 2– interferon and other cytokine production/signaling, cluster 3– translation, 4– various signaling pathways, 5– ubiquitination, and 6– extracellular matrix. To assess the impact of infection and UPR inhibition on the pathways identified using TransComp-R, we used IPA to calculate enrichment scores for the major TC-associated pathways (Fig. 6b, Supplementary Data 3) in the BMDM data. Infection of BMDMs produced a transcriptional response that includes many of the human TB-associated pathways identified in our TC analysis, e.g., interferon signaling and translation pathways. UPR inhibition limited the infection-induced changes in expression of these same pathways to different extents. All three inhibitors influenced pathways related to cytokine production, although inhibition of PERK exhibited a more muted effect. Inhibition of ATF6 and IRE1α, but not PERK, limited interferon signaling. Translation associated pathways were only significantly associated with ATF6 inhibition. These effects inferred from pathway enrichment scores were also evident by the differential expression of leading-edge genes from the TC analysis in three of the major pathways. In particular, ATF6 inhibition completely reversed the Mtb infection-induced repression of the consensus protein translation gene set. (Fig. 6c). These data suggest that significant aspects of the cross-species translatable features of Mtb infection could be attributable to UPR activation.
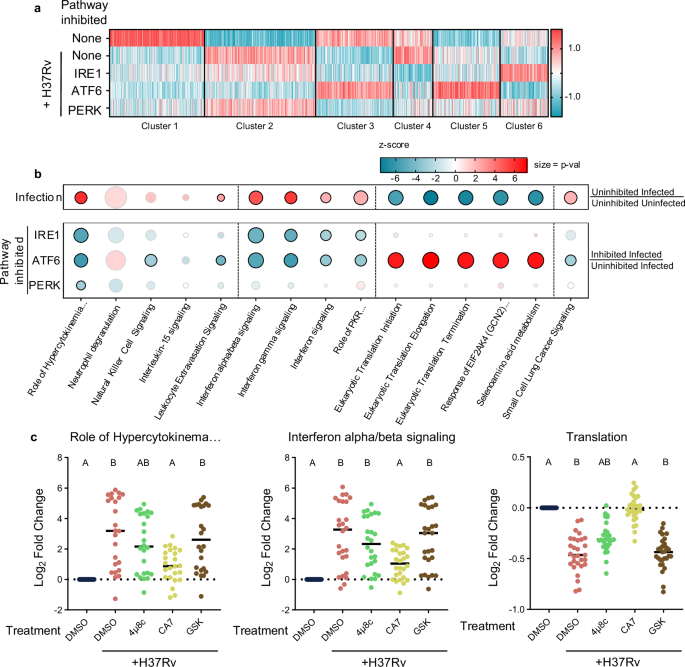
BMDMs were infected with H37Rv Mtb in the presence or absence of UPR inhibition or left uninfected. Following infection, mRNAs were quantified via RNAseq. Normalized counts were averaged and K-means clustering was applied to group genes based on differential expression patterns. a Heatmap showing results of clustering. b Dot plot heatmap showing associations with Mtb infection (top) and UPR inhibition during infection (bottom). Color is indicative of z-score while size represents p value. Pathways with significant enrichment are outlined in black. Major-TC pathways with no significant association (p value) under any condition were excluded. c Expression of leading-edge genes from TC analysis for indicated pathways. Log2 fold change relative to uninfected BMDMs is shown. To align gene expression data with pathway activity, the sign of genes whose expression was inversely correlated with pathway activity were reversed. Statistical comparisons were made using nonparametric Friedman test with Dunn’s multiple comparison’s test. A = p < 0.05 when compared to infected uninhibited condition. B = p < 0.05 when compared to uninfected condition.
Discussion
The assumption that animal model biology translates directly to human disease has led to a number of failures in TB therapeutic development, as well for many other human diseases1,46. A systems biology perspective suggests that this problem generally arises because multiple mechanistic pathways and processes are involved in pathophysiology47,48 such that, although they may be largely conserved across mammalian species, their relative quantitative importance for disease (and correspondingly treatment) phenotypes can be disparate between two species (Fig. 1a). Our lab has developed a cross-species modeling framework, TransComp-R, to overcome animal model limitations by identifying axes of molecular variation in preclinical models that correlate with the observed human disease pathologies, while acknowledging that each individual pathway may be variably important between individuals or species6. The application of this translational modeling framework in other disease contexts identified novel disease-relevant biological pathways, which were not apparent when only the commonly dominant features across both species were considered6,22,23. Here we have applied TransComp-R in the context of TB in efforts to untangle the heterogeneity underlying human TB disease presentation and identify multiple diverse disease-associated biological processes or pathway axes shared by humans and mice. As we hypothesized, the relative importance of many of these pathways is distinct between species. These differences can be seen explicitly in Fig. 4b and Fig. 5a, each of which shows that the associations of transcriptomic signatures found in the mouse study here are quite diverse in how strongly they contribute to human phenotype in contrast to mouse phenotype.
Similar to gene expression signatures defined directly in human cohorts, our mouse PC model effectively discriminated human LTBI from ATB. By projecting human clinical data into our murine transcriptomics model, we were able to identify biological pathways enriched in mice that correlate with human phenotypes, but can be overshadowed by more canonical molecular responses, such as type I IFNs. While our model still captured previously published biological mechanisms in response to Mtb infection, it also provided additional insight into the relationship between the two species and identified novel pathways potentially involved in human TB pathogenesis. TC1 of our model explains approximately a third of the variance in both human and mouse datasets and is associated with known markers of TB disease in both humans and mice, such as neutrophil functions and the interferon response. In addition to these expected pathways, TC1 was also significantly associated with pathways representing more diverse biological functions, such as multiple non-redundant gene sets related to extracellular matrix remodeling (e.g., “Collogen degradation”, “Inhibition of Matrix Metalloproteases”, and “Glycosaminoglycan Metabolism”). This finding suggests that this canonical response to infection may be more diverse that previously appreciated. TC1 was predominantly associated with the bacterial dose that the mouse was exposed to, suggesting that the gene expression features corresponding to both TC1 and many existing signatures represent a quantitatively dominant response to bacterial burden. This inference is supported by the sensitivity of TB diagnostic gene expression signatures to antimicrobial therapy49.
In contrast to cross-species approaches that compare the dominant features found in both species, TransComp-R is designed to identify both dominant and subdominant features reflective of heterogeneous biology that may be more prominently associated to human disease than is observed in the animal model. The model we present quantifies the importance of these subdominant features, identifying 4 mouse-derived PCs that together explain approximately the same amount of variance in the human dataset as mPC1. These axes serve to connect distinct infection-related stimuli with corresponding gene expression responses. Whereas TC1 was associated with bacterial burden and canonical TB-related pathways, TC2, TC5, and TC7 were associated with the mouse strain and/or Mtb strain differences and reflected distinct gene sets. Some of the related pathways have been previously implicated in TB pathogenesis (e.g., Natural Killer Cell Signaling” and “PPARα RXRα activation”)50,51. Others reflected more diverse and/or unexpected functions, such as cellular metabolism (“NAD Signaling Pathway”, “Stearate Biosynthesis”, and “Fatty Acid β-oxidation”) and signaling pathways controlled by acetylcholine receptor, ephrin receptor, and the Rab family of G proteins. In sum, these observations support a conceptual model in which heterogeneity in gene expression can be assigned to functionally orthogonal axes, which are predominantly influenced by either antigenic burden or genetic variation in the host or pathogen. Importantly, each of these distinct axes is individually predictive of TB disease state and can represent biological features that were not previously recognized in comparative studies using single species.
The pathways most commonly associated with the subdominant TCs (TC2, TC3, TC5, and TC7) were those related to protein translation. The expression of these ribosomal mRNAs differentiated the predetermined categorial TB phenotypes in humans, but not mice. This simple observation could have been interpreted to indicate that ribosomal repression is a human-specific response. However, TransComp-R was able to link UPR associated mouse PCs to the most relevant human phenotypes. We suspect that the importance of this pathway was not immediately evident in mice because of quantitative differences in pathway expression and/or a failure to appropriately categorize the animals to reflect human biology. This observation demonstrates the advantage of using unsupervised modeling and comprehensively interrogating shared features between species.
In both human blood and mouse BMDMs protein translation-related genes were repressed by ATB or Mtb infection, respectively, and this response depended upon the UPR. The ATF6 branch of the UPR was primarily involved in this response, with a more modest contribution of IRE1α. This cross-species translatable response to Mtb infection supports a likely role for UPR activation in both situations. Previous work demonstrating UPR-related gene expression in human TB lesions further supports this model36. We acknowledge that the anatomical and cellular context was different in our mouse and human datasets. Repression of ribosome gene expression by Mtb infection is also observed in human alveolar macrophages, indicating that UPR activation likely occurs at the site of infection52. However, direct infection of macrophages is unlikely to account for transcriptional signatures in human blood where diverse cell types are present and viable Mtb is quite rare. As a result, we speculate that UPR activation is not only a feature of directly infected macrophages but is also more generally related to immune stimulation. UPR activation has been observed in response to cell stimulation by diverse ligands, including TLR2 agonists53, and systemic administration of inflammatory cytokines can produce UPR activation in tissues54. While the specific cell(s) responsible for UPR-related gene expression in human blood remains unclear, our data suggest a mechanistic basis for an important component of diagnostic signatures that discriminate LTBI from ATB.
Inhibition of translation is a canonical function of the UPR, though transcriptional repression of ribosomal gene expression has not been described in mechanistic detail. Our data suggest that ATF6 is necessary for this effect, though we cannot differentiate between direct and indirect effects of this transcription factor. In addition to the canonical effects on translation and chaperone function, UPR activation has been implicated in a wide variety of cellular immune responses, including NF-κB activation, type I interferon production, and antigen presentation41,53,55,56,57. Our BMDM data support an important role for the UPR in shaping the myeloid transcriptional response to Mtb infection and demonstrate that the different branches of the UPR have distinct effects. While ATF6 has the strongest effect on translation, IRE1a and ATF6 both repress a cluster of genes related to IFN and other cytokines, and these two branches have opposite effects on ECM-related genes. The UPR-related effects that we identified are likely distinct from the previous observation that the related Integrated Stress Response (ISR) potentiates disease in C3HeB/FeJ mice58. The common component between the ISR and UPR is PERK, and inhibition of this kinase had a relatively modest effect on ribosomal gene expression and cytokine indication. Together these data suggest a specific role for UPR activation, not only generating predictive mRNA signatures, but also in shaping the immune response to Mtb infection.
While follow-up studies will be necessary to determine whether molecular components of the UPR could serve as a potential TB therapeutic target, this study highlights the utility of translational cross-species modeling as it has the potential to increase the value of preclinical data. Here, our TransComp-R model was constructed on a classic TB mouse model with two strains each of mice and Mtb but future applications could include an animal model with more diversity, such as the collaborative cross mouse strains. Whereas many studies aim to minimize variability, our model is best suited for heterogenous datasets and may find unexpected axes in a diverse animal model that provide insights into distinct aspects of human disease. The computational framework itself is generalizable across various species and data modalities, with the constraint of requiring analogous features across species. Overall, as we have shown, integrative cross-species models, such as TransComp-R, have the potential to expand our understanding of the human immune response to Mtb infection and accelerate the development of effective interventions.
Methods
Cohorts
As in the Moreira-Teixeira et al. study19, we made use of human transcriptomic datasets from the study by Singhania et al.24, which comprised cohorts from London (n = 21 LTBI, n = 21 ATB), and South Africa (n = 31 LTB, n = 16 ATB). We excluded the Leicester tuberculosis progressor cohort from our analysis as progression between disease phenotypes was outside of the scope of our study. We aggregated these into one large human cohort with total n = 89. We also utilized the mouse dataset from Moreira-Teixeira et al. comprised of C57BL/6 mice infected with either the H37Rv laboratory Mtb strain (n = 5 uninfected, n = 5 low-dose infected, n = 5 high-dose infected) or the HN878 clinical Mtb isolate (n = 10 uninfected, n = 10 low-dose infected, n = 10 high-dose infected) and C3HeB/FeJ mice infected with the H37Rv Mtb strain (n = 5 uninfected, n = 4 low-dose infected, n = 5 high-dose infected) or the HN878 Mtb strain isolated (n = 10 uninfected, n = 9 low-dose infected, n = 10 high-dose infected). As with the human data, we aggregated these cohorts into one mouse dataset with total n = 88. The cohorts are described schematically in Supplementary Table 1, 2.
Processing of human blood sequencing data
The human FASTQ raw blood sequencing TB data were obtained from GEO under accession numbers GSE107991 (London cohort) and GSE107992 (South Africa cohort). STAR (version 2.7.1a) was used to align the reads to the Hg38 human reference genome after which RSEM (version 1.3.1) was used to generate BAM files with gene and isoform expression level estimates from paired-end reads. The R package Tximport (version 1.16.1) was then used to generate count matrices from the gene expression level outputs from RSEM. Differential expression analysis was then performed using DESeq2 (version 1.28.1) with Benjamini-Hochberg FDR correction. Differentially expressed genes (DEGs) were identified using a significance threshold of FDR < 0.1 and abs(log2FoldChange) > 0.5 to identify DEGs between latently and actively infected TB patients in either the London or South Africa cohorts (Supplementary Fig. 1). DEGs were pooled across cohorts to create a single list of DEGs used to filter the human count matrices. The DESeq2 variance-stabilizing transformation was applied to the count matrices for each geographic cohort separately, followed by z-score normalization. The normalized and filtered count matrices were then aggregated to generate a single human dataset. This aggregated human dataset was filtered for one-to-one mouse-human gene homologs identified by the Bioconductor tools biomaRt and homologene (versions 2.44.0 and 1.4.68.19.3.27). Genes where more than one gene paired to a single gene of the opposite species were removed.
Processing of mouse sequencing data
Mouse FASTQ raw blood sequencing TB data was obtained from GEO under accession number GSE137092 and processed similarly to the human data, performing STAR alignment to the Mm10 mouse reference genome. Likewise, we then executed RSEM generation of gene and isoform expression level estimates from paired-end reads and Tximport generation of one count matrix for the whole mouse study cohort. Then, DESeq2 variance-stabilizing transformation and z-score normalization was applied to the count matrix. The normalized dataset was filtered for mouse orthologs of the human DEGs (Supplementary Fig. 1). Differential expression analysis was not performed directly on mouse data, but rather differential expression in humans was used as a global filtering step for both datasets.
Comparative enrichment of previously published TB gene signature
To compare the enrichment of previously published TB gene signatures in different phenotypic subsets of each species (Fig. 1b), we utilized the TBSignatureProfiler package (version 1.8.0). We performed single sample GSEA using the curated list of published TB signature gene sets containing 10 or more genes within the package. Wilcoxon rank sum tests were performed on phenotype pairs (i.e., human ATB vs. LTBI; C3HeB/FeJ H37RV vs. HN878; C57/BL6 H37RV vs. HN878) to determine statistical significance.
Regression of principal component scores onto covariates
Univariate regressions were performed to identify covariates that explain variation in score distributions on specific mPCs (Fig. 3b, Supplementary Fig. 3B). For binary covariates (mouse: mouse strain, Mtb strain; human: disease state, gender, cohort, BCG vaccination status), logistic regressions were performed and z-values were reported. For covariates that are continuous or 3+ ordinal categories (mouse: days since infection, bacterial dose; human: age), linear regressions were performed and t values were reported. Benjamini-Hochberg multiple hypothesis correction was applied to the results for each species separately.
Translatable components regression (TransComp-R)
PCA was performed on the normalized mouse data using the stats package (version 3.6.2) to obtain the mouse sample scores and gene loadings on each mPC. The first twenty mPCs explained 75% of variance in the mouse data and thus were kept for the next step of the analysis (Fig. 3c). Human samples were projected into this twenty mPC space by multiplying the normalized human transcriptomic data matrix by the mouse loadings matrix, resulting in a matrix of human scores in the mPC space. For ease of comparison, the sign on mPC loadings was standardized such that positive values were associated with ATB. The variance of the human scores along all mPCs was totaled and used to normalize the amount of variance in the projected human data explained by each individual mPC. Down-selection of mPCs occurred in the following manner: (1) the first 7 mPCs were first selected as they explain 75% of the projected human variance and then (2) only mPCs with human ATB-LTBI effect size (including the full 95% confidence interval) above one were kept for the final logistic regression model. Univariate effect size, here parameterized by the Cohen’s d coefficient, was calculated for each mPC using the effsize R package (version 0.8.1). The projected human sample scores along these selected mPCs were then inputted into a logistic regression model using an 80:20 train-test split and 5-fold repeated cross validation with 10 repetitions. This model was trained for predicting human infection status (i.e., ATB vs LTBI) based on the human transcriptomic data projected into the mPCs.
TransComp-R model validation
To test the likelihood of constructing a TransComp-R model with accuracy in predicting human TB outcomes similar to our final model, we compared our 5 mPC TransComp-R model to a series of null models with either 5 random mPCs or shuffled human phenotype labels. For the random mPC models, 5 mPCs between mPC1 and mPC88 were selected for a logistic regression model where projected human sample scores were regressed onto ATB and LTBI labels. This selection process of 5 random mPCs occurred 1000 times and the distribution of accuracy scores from 5-fold cross-validation was plotted. For the null models with shuffled human phenotypic labels, the projected human samples on the five mPCs included in our final model (mPC1, mPC2, mPC3, mPC5, and mPC7) were regressed onto randomly shuffled ATB and LTBI labels. This was repeated 1000 times with newly shuffled labels each round and the distribution of accuracy scores from 5-fold cross-validation was plotted. Both distributions of null models were statistically compared to the distribution of accuracy scores from the final TransComp-R logistic regression model using an 80:20 train-test split and 5-fold repeated cross-validation with 10 repetitions.
Bone-marrow derived macrophage production and culture conditions
C57BL/6J mice were purchased from Jackson Labs. Housing and experimentation were in accordance with the guidelines set forth by the Department of Animal Medicine of University of Massachusetts Medical School and Institutional Animal Care and Use Committee. Animals were anesthetized via isoflurane inhalation followed by cervical dislocation. BMDMs were generated from femur bone marrow via culture in DMEM containing 100 µM sodium pyruvate, 10 mM HEPES, 10% heat-inactivated FBS, and 20% conditioned media from L929 cells in non-treated tissue culture dishes for a total of 8 days. Additional media was added on day 3, and plates were washed with DPBS and received fresh media on day 5. Following differentiation, cells were harvested by rinsing plates with room temperature DPBS and then scraping the cells in cold DBPS. Collected cells were pelleted at 500 × g for 5 min, resuspended in appropriate media, counted, and plated for treatments and infections. Following differentiation, cells were cultured in DMEM containing 100 µM sodium pyruvate, 10 mM HEPES, and 10% heat-inactivated FBS (cDMEM).
UPR inhibition
For UPR inhibition studies, the following inhibitors and concentrations were used: 4 µ8c (50 µM), Ceapin-A7 (10 µM), and GSK2606414 (1 µM). BMDMs were pre-treated with inhibitors or DMSO control for ~2 h prior to infection or tunicamycin treatment. For infection studies, pre-treatments were carried out at 1.5× desired concentration, subsequently adjusted to 1× upon addition of bacteria-containing media to wells. Inhibitors were maintained in media throughout the duration of the experiments.
Mtb strains, culturing, and macrophage infection
Wildtype Mtb H37Rv was used for macrophage infection studies, with the exception of the bacterial uptake experiments which utilized H37Rv::pmCherry. Bacteria was cultured in Middlebrook 7h9 media with 0.2% glycerol, 0.05% Tween80, and 10% oleic acid-albumin-dextrose-catalase (OADC, BD). Prior to macrophage infections, bacteria were grown to mid-log phase (OD600 0.5–0.8). Bacteria was then collected, pelleted at 4000 RPM, resuspended in 30 ml cDMEM, pelleted at 4000 RPM, resuspended in 10 ml cDMEM, and spun at 700 RPM to pellet clumped bacteria. The supernatant was transferred to a new tube, and OD600 was measured to determine the dilutions required to achieve the desired multiplicity of infection (MOI). Bacteria were added to cells at desired MOI (9 unless otherwise stated) and plates were spun at 500 × g for 10 min. Cells were then returned to the incubator and infections allowed to proceed for 4 h. Cells were then washed to remove extracellular bacteria and fresh media containing appropriate inhibitors added. For RNAseq experiments, infections were allowed to proceed for 24 h before cells were lysed in TRIzol.
RNA purification, transcriptional profiling, and quantitative PCR
For transcriptional profiling experiments, samples lysed in TRIzol (Thermo Fisher) were mixed with chloroform (5:1), incubated on shaker for at least 15 min, and were spun at 13,000 RPM at 4 for 15 min. Aqueous phase was then transferred to a fresh tube and an equal volume of 100% ethanol added. RNA was then isolated from solution using Direct-zol RNA Miniprep kit (Zymo Research) per manufacturer’s instructions. For each experimental condition, a total of 4 biological replicates were sequenced. Non-stranded library preparation with poly(A) enrichment and RNA sequencing was performed to recover >20,000,000 reads per sample. For qPCR experiments, cells were treated with tunicamycin (10 µM) ± UPR inhibition for 4 h before media was removed and cells were lysed with TRIzol. Lysed samples were added directly to Direct-zol RNA miniprep columns and isolated per manufacturer’s instructions. Reverse transcription was then performed using the iScript cDNA synthesis kit (Bio-Rad Laboratories). Quantitative PCR was performed with Luna Universal qPCR Master Mix (New England BioLabs) using an Applied Biosystems ViiA 7 Real-Time PCR system. Relative transcript abundance was calculated using the ΔΔCT method with target genes normalized against transcript levels of unspliced XBP1, for spliced XBP1, or β-actin, for HSPA5 and Trib3. The following primer sequences were used: spliced XBP1 F, 5′-ggtctgctgagtccgcagcagg-3′, R, 5′-gaaagggaggctggtaaggaac-3′59; unspliced XBP1 F, 5′-cagactatgtgcacctctgc-3′, R, 5′-cagggtccaacttgtccagaat-3′60; HSPA5 F, 5′- acttggggaccacctattcct-3′, R, 5′- atcgccaatcagacgctcc-3′61; Trib3 F, 5′- gcaaagcggctgatgtctg-3′, R, 5′-agagtcgtggaatgggtatctg-3′62,63,64; β-actin F, 5′- cgcagccactgtcgagtc-3′, R, 5′-ccttctgacccattcccacc-3′65.
Mtb internalization
BMDMs were plated to 96-well plates and infected with H37Rv::pmCherry at indicated MOIs alongside UPR inhibitors or vehicle control (detailed above). Infection was allowed to proceed for 4 h before cells were washed with cDMEM and fresh media containing DMSO or UPR inhibitors was added to wells. Fluorescence was measured at 24 and 48 h post infection using a Synergy H4 Hybrid Microplate Reader (BioTek). To account for background fluorescence, the mean signal from uninfected wells was subtracted from the other readings.
RNAseq analysis
Sequencing file quality was verified using FastQC66 version 0.11.5. Reads were trimmed using Cutadapt67 version 4.1, then mapped to the mouse Ensembl GRCm38 genome68 using STAR69 version 2.5.2b. Transcripts were quantified using RSEM70 version 1.3.3. Subsequent analysis was completed in R version 4.1.2. Files were imported using the Bioconductor package tximport71 version 1.22.0. Genes with a TPM greater than or equal to 0.5 in at least 15 libraries were included. Differential expression analysis was performed using the Bioconductor package DESeq272 version 1.34.0. Pairwise comparisons between conditions were made using the Wald test. K-means clustering was performed on scaled, averaged normalized counts from 4 biological replicates/condition using Morpheus73.
Ingenuity pathway analysis and presentation
Pathway analyses was performed using IPA (Qiagen) software. For all analyses, pathways with a −log(p-value) > 1.3 and a z-score > 2 or <−2 were considered significantly enriched. TCs were analyzed using the Core Analysis function with a stringent filter limiting relationships to those occurring in immune cells. Major TC-associated pathways were identified as the 2 pathways with the highest and lowest z-scores, along with a significant p-value, for each TC. For K-means clustered data, IPA core analysis was used with default settings to discern the pathways most associated with each group. For associating BMDM RNAseq data with major TC pathways, core analysis was performed on genes showing significant (Benjamini-Hochberg FDR corrected p-adj < 0.05) differential expression relative to the infected, uninhibited condition for each experimental group. Analysis was performed with a stringent filter limiting output to relationships occurring in murine cells.
Programming
All analyses were done in R. R version 4.2.1 was used for preprocessing of the previously published human and mouse model RNASeq data and the TransComp-R modeling. R version 4.1.2 was used for BMDM RNASeq analyses.
Study approval
Animal housing and study protocols were in accordance with the guidelines set forth by the Department of Animal Medicine of Umass Chan Medical School and Institutional Animal Care and Use Committee.
Responses