Current-use pesticides in vegetation, topsoil and water reveal contaminated landscapes of the Upper Rhine Valley, Germany

Introduction
Pesticides are known to make comprehensive contributions to the decline of several groups of organisms and biodiversity1,2,3. The air in agricultural intense landscapes is particularly loaded with the Current Use Pesticides (CUPs)4, and CUPs can be transported over long distances5. Thus, CUPs have been detected not only in crop fields6,7,8 but also in non-target areas9,10,11,12,13 or even in insects in nature conservation areas14. CUPs from agricultural landscapes are able to enter local food webs, potentially magnifying with increasing trophic level15. Although a relationship between CUP contamination and short-distance distribution from crop fields has been demonstrated, we just begin to understand CUP contamination at the landscape-scale and the potential exposure of organisms16.
The complexity of CUP transport processes makes it difficult to predict the exposure of different environmental matrices and non-target organisms, although realistic data on exposure are urgently needed in view of the rapidly advancing biodiversity declines in terrestrial habitats17,18. One way to thoroughly evaluate realistic scenarios is to conduct large-scale, long-term monitoring studies to determine the presence of CUPs in the environment. The United Nations Environment Programme calls for additional post-registration monitoring of pesticides and their transformation products in the environment19, especially in areas where there is high use intensity. Long-term monitoring is already conducted for European surface waters20, but, in contrast, only a few local and short-term soil and vegetation CUP measurements exist9,16,21,22, despite the recognized terrestrial biodiversity losses. To assess realistic terrestrial pesticide contamination on a landscape-scale, we conducted extensive sampling across various environmental matrices on a large spatial scale in the Upper Rhine Valley in Central Europe.
The study area is characterized by intensive agriculture, with cropping areas covering 23.4% of the total study region. A diverse range of crops is cultivated, including vegetables (3.4%), cereals (12.2%), vineyards (3.8%) and fruit orchards (2.2%) with some areas exhibiting a high density of cultivated land (Fig. 1, Supplementary Table 1, see methods for details). In the agricultural core of the valley, agriculture and human population are concentrated, where approximately 19.6% of the land is urban and 37.3% is cropping area. The agricultural valley is embraced by the two bordering mountain regions: the Black Forest and Palatinate Forest with low agricultural activity (9.0% cropping area). There are non-target areas of conservation concern in the mountain regions as well as in the valley, e.g. nature conservation areas with red-listed plant and animal species. In addition, the Upper Rhine Valley has an alluvial plain and is lying on one of Europe’s largest groundwater resources which is under profound pressure due to intensive agriculture23 and source of drinking water for more than seven million people24. Non-target areas outside cropping fields were sampled in the agricultural valley and forested mountain regions utilizing a standardized methodology9,25, and vegetation, topsoil and surface water were analysed for 93 CUPs. Samples were also taken in the Black Forest National Park, the UNESCO Palatinate Forest-North Vosges Biosphere Reserve and Black Forest Biosphere Reserve.

A Aerial view with the 78 sample sites (white dots) and six transects (T1-T6). Sample sites were located on line transects T1 – T6 (north to south) with west/east orientation and categorized into mountain and valley depending their location regarding the mountain foot. B Land-use (C) Measured cumulative number of CUPs in topsoil and vegetation per transect. Water was excluded in (C), due to the availability at only 30 sites. Vegetation and topsoil were sampled between June 15th and July 11th 2022. Digital Elevation Model and forest/urban land cover from European Environment Agency (EEA) (2016); remaining land use categories from Blickensdörfer et al. (2021) of the year 2019. Aerial view: © 2025 Google, TerraMetrics.
We assumed that due to the prominent SW wind direction, the Palatinate Forest is less contaminated by CUPs than the Black Forest (Fig. 1) and that CUP residues are detected in higher numbers and concentrations next to agricultural fields and only occasionally further away from the application areas. CUP measurements and land-use data were used to create landscape-scale contamination prediction maps with an area of 10,976 km², that can be used to assess the extent of environmental exposure in non-target areas. We specifically addressed the potential contamination of nature conservation areas in the Upper Rhine Valley.
Results & discussion
CUP residues detected
CUP detections in topsoil, vegetation and surface water
In total, 63 of 93 analysed CUPs consisting of 29 fungicides (F), 19 herbicides (H) and 15 insecticides (I) were detected in topsoil, vegetation and surface water samples from the 78 non-target, off-field sites along the six line transects (Fig. 1A). More specifically, 50 CUPs (24 F, 16 H and 10 I) were detected in topsoil and 43 CUPs (23 F, 8 H and 12 I) were detected in vegetation. In surface water samples taken from rivers, small streams, ponds or puddles, depending on the availability at the non-target sample sites, 44 CUPs (21F, 14 H and 9 I) were detected (Supplementary Table 2). Our total number of 63 CUP detections doubles the recent findings of 27 different CUPs (10 insecticides, 11 fungicides, and 6 herbicides) in the Vinschgau valley in South Tyrol (Italy), which is the largest apple growing area in Europe16. One explanation for the higher number of CUPs in the Upper Rhine Valley could be the high crop variability consisting of cereals, vegetables, grape, fruit and other crops (Fig. 1B), requiring different pesticide applications sequences during the season. In addition, the high crop diversity (Supplementary Table 1), as well as the presence of viticulture, could explain the higher number of herbicides and fungicides compared to the Vinschgau Valley. With the Vinschgau Valley’s focus on apple growing, pesticide use is both frequent and intensive: on average 38 pesticide applications were conducted from March to September in 2017, with up to 9 different pesticides in one application26. The very specific application sequence in apple growing could explain the smaller number of CUPs found in total and different ratios of fungicides, herbicides and insecticides compared to the Rhine Valley. Herbicides have a high sale volume of 48,269 tons (formulation) in Germany, followed by fungicides with 30,072 tonnes (formulation) in 202227. Geographically, Europe is the dominant market for fungicide use in the production of fruits, vegetables, wheat and grape28, which could explain our frequent detection of fungicides in the Upper Rhine Valley. The most frequently detected CUPs in topsoil in our study were the fungicides fluopyram (94% of all samples), boscalid (42%), spiroxamine (37%), and pyraclostrobin (22%). In vegetation, the most commonly recorded CUPs were the fungicides fluopyram (92%), spiroxamine (55%), cyflufenamid (41%), and boscalid (38%). In surface water, the predominant detections included the fungicide fluopyram (77%), the insecticide pirimicarb (67%), the herbicide metazachlor (63%), and the insecticide tebufenozide (63%). Each of these frequently detected CUPs is categorized as “High alert” or “Moderate alert” by the Pesticides Properties Database29 in at least one of the three categories “Environmental fate”, “Ecotoxicity” and “Human health” (Supplementary Table 3). Of all 63 detected CUPs, 35% are categorized as “High alert” in “Environmental fate”, 43% as “High alert” in “Ecotoxicity” and 40% as “High alert” in “Human health”.
The majority, 74% of all 1195 detected individual CUP concentrations, were <5 ng g−1 (37 CUPs in topsoil, 21 CUPs in vegetation and 42 CUPs in surface water were only detected with concentrations <5 ng g−1). Nonetheless, even individual CUP concentrations can reach comparatively high values in non-target areas as they were detected for fluopyram and boscalid in topsoil (44.25 ng g−1 and 51.86 ng g−1 both at T1_7) and vegetation (877.61 ng g−1 at T2_6 and 380.57 ng g−1 at T5_6), due to the distance of <10 m to the nearest agricultural field (Supplementary Table 4) where pesticide exposure is generally higher30.
Some of the frequent detections could be related to the sales volume in 2022 and their persistence in the environment: metazachlor (H) had a relatively large volume of 517 metric tons of active ingredient (t a.i.), while spiroxamine (F) had 287 t a.i., pyraclostrobin (F) 151 t a.i. fluopyram (F) 113 t a.i. and boscalid (F) 86 t a.i27. Moreover, fluopyram and boscalid are highly persistent substances with a typical DT50 (half-life) in soil of 309 days and 484 days, respectively, resulting in a risk to accumulate29. Fluopyram and cyflufenamid are categorized as Per- and Polyfluoroalkyl Substances (PFAS), also known as “forever chemicals”, and are part of the 37 authorised PFAS pesticides in the European Union31. Persistent and widely occurring substances must be considered critically, especially if there is evidence of effects on organisms. Fluopyram, which was detected nearly everywhere (73 of 78 topsoil samples, 72 of 78 vegetation samples 23 of 30 surface water samples), is used as a fungicide but also registered as a nematicide in tropical crops and shows strong effects on target- and non-target nematode communities in topsoils32. Fluopyram also poses ecological risks by inducing behavioural alterations in fish and increasing muscle lipid content, with potential involvement of neurotoxic mechanisms33. Additionally, growth anomalies in grapevine, caused by a fluopyram metabolite were reported34. Fluopyram was detected in 69% of French soils10 but only on one site in the apple-growing Vinschgau Valley16, possibly because it is not recommended for integrated apple production there35. In addition, Fluopyram and other PFAS degrade into trifluoroacetate (TFA), a highly persistent and mobile contaminant that threatens water resources36. With current chemical assessments failing to address its long-term accumulation, mixture toxicity, and persistent environmental risks37 we underline the risk of widespread fluopyram presence in the Upper Rhine Valley with its groundwater reservoir.
In the case of boscalid, we detected a contamination of 42% of all sampling sites in topsoils (max. 51.86 ng g−1), 38% (max. 380.75 ng g−1) in vegetation and no contamination in surface water. French soils showed a contamination of 85% of their sampling locations with levels up to 1,211 ng g−1 in a cereal field12, whereas in the Vinschgau Valley boscalid was detected in 11% of the soil samples16. The fungicide boscalid can decrease the reproductive quality of honey bee queens and is one of the most common pesticides detected in beehives38. In addition, boscalid can induce a mitochondrial dysfunction in human cells, suggesting that it is not selective for fungi targets39. The fungicide spiroxamine, detected in more than every second vegetation sample and every third topsoil sample, can increase the mortality of the beneficial parasitical insects Anagyrus vladimiri and Trichogramma evanescens in viticulture40, indicating the possible impact of CUP contamination on non-target organisms and the reduction of biological pest control potential. Our results show that there can be regional differences (Rhine Valley vs. Vinschgau Valley) but also similarities in terms of pesticide contamination (Rhine Valley vs. France), which results in a need of individual environmental pesticide exposure evaluation. Although the EU National Action Plans ask for the implementation of integrated pest management, which should be adapted to local conditions and crop types, this strategy has not been effective since pesticide use has not decreased in the EU so far41,42.
CUP residue mixtures in topsoil, vegetation and surface water
CUPs were detected in 97% of all vegetation and 97% of all topsoil samples (76 of 78 samples each). Surface water was available for sampling at 30 of the 78 sample sites, and CUPs were detected in 83% of the samples (25 of 30). Of the total 63 detected CUPs, 27 CUPs (43%) were recorded in all three matrices (vegetation, topsoil and water), 20 CUPs (32%) were detected in at least two of the three matrices and 16 CUPs (25%) were detected in only one of the three matrices (Supplementary Table 5). The detections in almost all combinations of the three matrices and the spatially distributed sample sites with potentially specific habitat conditions, ranging from intensive agriculture in the valley to remote locations in the mountains, show a high probability of pesticide exposure at both patch (site) and landscape (transect) scales (Fig. 2). In total, 140 unique mixtures with ≥2 components were recorded. Of the soil, vegetation and surface water samples, 76%, 87% and 80% contained mixtures, respectively. Samples from non-target, off-field habitats in the agricultural valley showed 90 unique mixtures, whereas 54 unique mixtures were recorded in forested mountain regions. The most often detected mixture contained the fungicides fluopyram + spiroxamine, but this specific mixture occurred only 6 times, indicating the high variability of mixture composition. All other mixtures occurred once (95.7%), twice (2.9%) or threefold (0.7%), demonstrating that there was site-specific contamination. We detected a maximum of 26 CUPs in topsoil, 21 in vegetation and 39 in surface water samples in the agricultural valley (T1_3, T3_4 and T1_3, respectively). Fungicide-intensive viticulture on slopes bordering mixed crops with vegetables, fruit orchards and cereals is typical of this area in Southern Palatinate. Sites without CUP residues in vegetation, soil or surface water were measured only in remote mountain regions (T1, T2, T6 mountain sites 8–13, Fig. 2). However, there was no site where all matrices were uncontaminated. This is in line with a study from the Italian alps, where none of the non-target sites were without CUP detections in soil and vegetation16. This CUP exposure could initially have a direct effect on non-target organisms, in case of herbicides directly affecting non-target plants outside of cultivated areas. In addition, herbicides can affect not only plants but various other non-target organisms including humans43. Cases of direct acute bee mortality and sub-lethal impairment of their normal biological behaviour have been documented for herbicides, and fungicides and synergistic effects when in mixture with other agricultural chemicals44. Traces of insecticides threaten numerous non-target organisms by affecting traits of the individual, including development, physiology, behaviour and communication45. In a recent study involving over 1000 pesticides, exposure to sublethal doses (reflecting typical field application and low environmental concentrations) in Drosophila melanogaster revealed that 57% of the studied pesticides significantly altered larval behaviour after short-term exposure46. Key traits, such as egg-laying rates, reducing reproduction and in the end leading to population decline, were reduced by some pesticides even at concentrations several orders of magnitude below sublethal levels46. In addition, nonlinear interactions between many combinations of highly prevalent pesticides suggested widespread synergistic interactions46. It can therefore be expected that sublethal effects can also occur at low environmental concentrations, similar to those measured in this study. Our detected high variability of mixtures indicates the difficulty of generalizing CUP exposure and resulting potential effects. The risk of environmentally occurring CUP mixtures is not assessed for the regulation of pesticides in the EU, where only single substances or a few pesticides that are prepared in a single formulation are addressed. CUPs are only tested in the laboratory and in field experiments with a small number of model organisms (Commission Regulation (EU) No 284/2013, 2013) and unexpected consequences due to interactions of different substances (e.g. additive or synergistic effects) or sublethal effects and indirect effects on other organisms are not investigated47,48,49. A realistic assessment of CUP mixture exposure and its associated risks to biodiversity would be extremely challenging, given a large number of different mixtures recorded. The mean number of CUP detections differed between area and matrices: On average, 6.3 CUPs were found in vegetation (9.2 in the valley and 3.2 in mountain regions), 5.4 CUPs were found in topsoil (8.2 in the valley and 2.3 in mountain regions) and 9.6 CUPs were found in surface water (16.7 in the valley and 3.3 in mountain regions). An analysis of the European soil database, focusing on 76 target CUPs, with an analytical sensitivity of >10 ng g−1 (LOQ) for LC-MS/MS compounds and >5 ng g−1 (LOQ) for GC-HRMS compounds, showed a mean of 2.7 (median = 3) pesticides in European agricultural soils and 2.4 (median = 1) in Germany8. Their mean number of detected CUPs in non-target area topsoils is up to two times lower, compared to our measurements with 93 target CUPs. We included measurements in the number of CUP detections when they reached individual LOD levels and included measurements in site sum concentrations when individual LOQ levels, up to 1000 times lower (topsoil LOQ: 19.11–0.008 ng g−1, vegetation LOQ: 21.5–0.01 ng g−1, water LOQ: 0.01–0.0006 ng g−1, Supplementary Table 6) compared to the previously mentioned study, were reached. Differences in extraction, analytical methods as well as detection limits and number of target CUPs make comparisons difficult, however the analytical sensitivity of our study showed a higher CUP number in non-target areas compared to the target in-field samples of the EU study. Additionally, the EU study was an in-field measurement whereas we sampled in the non-target off-field area. Since 281 different CUPs are currently authorised in Germany27 and 440 in Europe50, the number of CUPs and sum concentration is even higher than our results show as only 93 CUPS were included in our analysis. In 2021, a study with the same analytical method was conducted close to the transects T1, T2, T3 but also with samples from cropping areas22. The results show that the number of CUPs decreases with distance to the target site but crop type and season play a critical role in contamination prediction11,22. It can therefore be concluded that there is an even higher number and sum concentration of CUPs present in fields, vineyards and orchards close to our non-target areas.
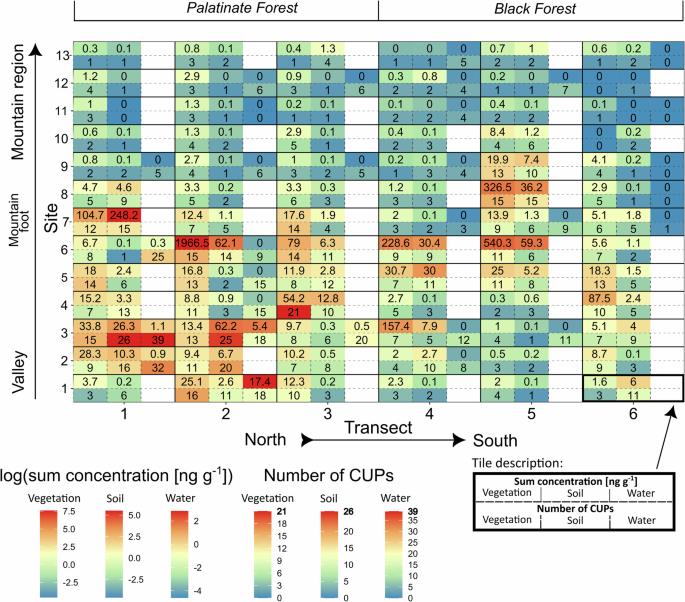
Explicit results of the 78 sampling sites for the number and sum concentration of CUPs. Each of the six line transects consisted of 13 sample sites. In each tile, vegetation (bottom left), topsoil (bottom middle) and water (bottom right) and their corresponding sum concentration in ng g−1 in the cells above is mentioned (see tile description). Regions defined as valley and mountain region, Palatinate Forest and Black Forest and North and South. Site 1 was always closest to the Rhine in the valley, site 7 at the mountain foot and site 13 most remote in the mountain region. For details on the location of the transects see Fig. 1.
We demonstrate a widespread contamination with CUP residues across different environmental matrices and a high variability in mixture compositions. The presence of unique and site-specific mixtures underscores the complexity of CUP exposure in non-target areas, raising concerns about unassessed ecological impacts from diverse, co-occurring residues.
CUP sum concentration in topsoil
Summing up the concentrations of recorded individual CUPs, we detected a mean CUP sum concentration of 8.48 ng g−1 in all topsoils, ranging from no detections to a maximum value of 248.23 ng g−1 (T1_7, <10 m to vineyards). This is in the same CUP sum concentration range as recently measured in topsoils of the Vinschgau Valley with a mean of 4.15 ng g−1 16. When split into valley and mountain regions, the valley topsoil showed a 26-fold higher mean concentration (15.97 ng g−1) in comparison to mountain region topsoil (0.60 ng g−1). A recent study in France revealed 0.1 to 76 ng g−1 with a mean value of 30.4 ng g−1 in French grassland topsoils and <2 ng g−1 in forest topsoils (only >LOQ, 110 target substances)10 which is comparable to our detections in valley and mountain regions, respectively. A comparison of sum concentrations is difficult due to the lack of comparative studies and the dependence of the method and detection limits (see above). A 15-fold higher mean was detected in French grassland compared to French forest topsoil10 which is also comparable to our valley (26 times higher) versus mountain region detections. The top ten topsoil CUP sum concentrations (248.23 ng g−1 to 10.34 ng g−1) were measured in the valley (Supplementary Table 4).
CUP sum concentration in vegetation
In vegetation, a mean value of 51.21 ng g−1 was detected (max: 1966.51 ng g−1 at T2_6, <10 m to vineyards), which is slightly lower than the recorded mean CUP sum concentration of 64.5 ng g−1 in playground grass and 104.48 ng g−1 in vegetation in valleys in South Tyrol16,51 The study area in these studies is dominated by apple orchards in the valley whereas in our case vineyards are concentrated at the mountain foot and fruit cultivation is more diffuse in the Upper Rhine Valley. One exception is the fruit cultivation area at the mountain foot close to T4_6 and T5_6, possibly explaining the higher sum concentration detected there (Fig. 2). Another explanation for our slightly lower mean sum concentration in vegetation could be the large number of sites with greater distance to the next agricultural activity (mean distance of 650 m). The vegetation of the valley in the whole study area showed a 40-fold higher mean CUP sum concentration (97.55 ng g−1) in comparison to mountain region vegetation (2.43 ng g−1). The top ten vegetation sum concentrations (1,966.51 ng g−1 to 33.85 ng g−1) were measured in the valley (Supplementary Table 4). The highest concentration of 1,966.51 ng g−1 was mainly driven by the fungicides fluopyram and tebuconazole with 877.61 ng g−1 and 777.46 ng g−1 respectively, detected together with 13 other CUPs at this sample site (T2_6 distance of <10 m to the nearest vineyard), making contamination by drift from viticulture likely. Three-dimensional application in viticulture results in greater pesticide drift compared to arable applications and greater exposure of near non-target areas22,30.
CUP sum concentration in surface water
In surface water, a mean CUP sum concentration of 0.86 ng ml−1 (max: 17.41 ng ml −1 at T 2_1, puddle <10 m to the next field) was detected and the top ten maximum water sum concentrations (17.41 ng ml −1 to 0.01 ng ml−1) were all measured in the valley (T1-4). Of the 30 surface water samples (Supplementary Table 7), six were taken from puddles with the highest measured sum concentrations (top six) of 17.41 ng ml−1 to 0.30 ng ml−1 and 39 to 18 different CUP detections. It can be assumed that the CUPs are concentrated by desiccation, which turns puddles in agricultural areas into toxic soups. Puddles in human modified landscapes are a an important drinking water source for birds52 and honey bees actively forage in “dirty” water sources for minerals that may be lacking in their floral diet53. We emphasize the critical exposure pathway for birds and mammals as well as other vertebrates and invertebrates through water uptake, especially when contaminated puddles are the only source of water in hot seasons or during increasingly frequent droughts. Realistic puddle exposure needs to be addressed as a critical source for affecting biodiversity, and in-field puddle exposure is expected to be even higher. The 19 sampled small streams showed sum concentrations up to 0.03 ng ml−1 (Supplementary Table 7) whereby small streams in the valley as well as in the mountain regions were contaminated (15 of total 19 small streams). A study of 124 monitoring stream sections across Germany found that pesticides in agricultural streams were the dominant driver in reducing vulnerable insect populations in aquatic invertebrate communities and event-driven sampling was used to additionally record surface rainfall-induced short-term peak concentrations54. In addition to effects in the aquatic environment, terrestrial food webs in the riparian zone may be impacted via reduced insect emergence55. The neonicotinoids acetamiprid and thiacloprid, detected in two small streams (T4_3 and T5_7), were the most frequently detected pesticides in 90–100% of emerging insect samples in a study in the same region and were shown to biomagnify in riparian spiders25. We just begin to understand the complexity of the aquatic-terrestrial meta-ecosystem55 and CUP contamination studies which integrate both, aquatic and terrestrial matrices, could support biodiversity conservation efforts by indicating relevant effect pathways. Water sources are quite diverse, and substance transport can vary significantly between small streams and other sources, such as ponds or puddles.
CUP residue gradient and wind effects
Across all matrices, a higher number of CUPs and sum concentration was detected in the valley (mean number of CUPS = 9.6 CUPS, mean sum concentration = 46.7 ng g−1) compared to the mountain region (mean number of CUPS = 2.9 CUPS, mean sum concentration = 1.4 ng g−1. Matrix specific, there was a significant higher number of CUPs in valley topsoil (z76 = 10.51, p < 0.001), vegetation (z76 = 10.08, p < 0.001) and surface water (z28 = 10.64, p < 0.001) as well as a higher sum concentration in valley topsoil (t76 = 6.18, p < 0.001), vegetation (t76 = 7.03, p < 0.001) and surface water (t28 = 3.95, p < 0.001, Supplementary Table 8). The number of CUPs in vegetation and topsoil decreased from the valley to the mountain regions, only increasing by approximately two more CUPs at the mountain foot (Fig. 3A). Despite the decreasing CUP numbers a tenfold increase in the CUP sum concentration in vegetation and topsoil could be observed at the mountain foot compared to the valley (Fig. 3B). This suggests that a detailed representation of landscape contamination can only be obtained with both values. Our results indicate, that CUPs can travel multiple hundred metres from the agricultural valley into forested mountain regions and that the contamination is related to the distance to the mountain foot in both directions. As the mountain foot of the Upper Rhine Valley is widely covered with vineyards and interspersed with fruit cultivation, the observed increase in CUP numbers and especially sum concentrations could be related to the 3-dimensional application required in both crop types and resulting drift. In addition, vineyard site conditions like a high air temperature and wind velocity, enhance pesticide volatilization from target plants and soils56 which could favour atmospheric transfer.
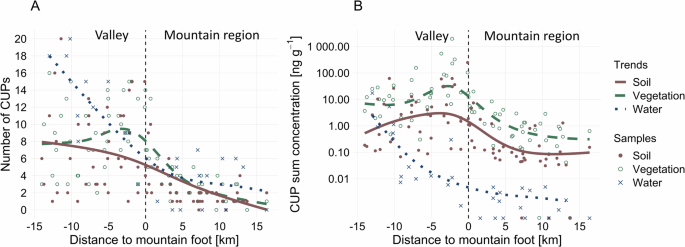
A Number of detected CUPs in vegetation (circles), topsoil (dot) and surface water (cross). B CUP sum concentrations in ng g−1 in vegetation, topsoil and surface water. Loess smooth trendlines indicate the gradient from the valley (-15 km to 0 km) to the mountain regions (0 km to 15 km). 0 corresponds to the foot of the mountain that defines the Rhine Valley by sudden altitude and land use changes.
To test the effect of the main wind direction on the number of CUPs in mountain regions, a Welch Two Sample t-test was applied for all CUP detection numbers in soil and vegetation in mountain areas (n = 38). With a main wind direction from southwest to northeast, the mountain areas in T1, T2, T3 would be contaminated upwind and T4, T5 and T6 would be affected downwind, if a connection between wind and CUP transport is assumed. No significant effect could be found for the number of CUPs in vegetation (t32.63 = 0.47, p-value = 0.640) and the sum concentration in vegetation (t33.86 = −0.411, p-value = 0.683). However, there was an average trend of 1.51 more CUPs (t30.20 = −1.79, p-value = 0.084) and 0.699 ng g−1 higher sum concentration (t22.14 = −1.72, p-value = 0.099) in topsoil of the Black Forest mountain regions (T4, T5, T6) which would be contaminated with the main wind direction. Wind can have a direct influence on the direction, transport distance and concentration of pesticides as well as on the transported droplets deposition place57. The fact that pesticides are found in ambient air underlines this possible distribution path4,58,59. The number of pesticides in air was shown to increase with higher air temperature and decrease with less precipitation4. Pesticides have been found in rainwater60, demonstrating just another aspect in complex meteorological systems accountable for non-target site contamination. Semi-volatile pesticides can get adsorbed on atmospheric aerosol particles which leads to high persistence and long-range transport (>1000 km) in the atmosphere61. Nonetheless, it has been shown that long-range CUPs come from different chemical classes with very different physicochemical properties, resulting in the assumption that the assessment of these properties cannot fully explain their distribution62. The occurrence of CUPs in remote mountain regions of the Upper Rhine Valley through medium-range transport (1–1000 km) questions current pesticide regulation. Medium-range transport, which results in landscape scale CUP contamination, is hardly addressed in current regulation where the main concern lies on short-range transport (drift) and long-range transport, for example to Arctic regions5.
There is also some agricultural activity in the remote mountain regions which could contribute to CUP occurrence (Supplementary Table 1). The maximum distance from a transect site to agricultural cropping areas (including cereals, fruits, vegetables, grape, other crops) was 4.4 km (T1_10). This site showed contamination of fluopyram and spiroxamine in vegetation and fluopyram in soil. The contamination in the mountain regions with 2–3 pesticides (calculated mean over all matrices = 2.9) can be considered as a ubiquitously present background contamination. As mentioned before, this number will be even higher in reality, as not all approved CUPs were included in our analytical procedure. In summary, pesticides in the Rhine Valley occur not only in the immediate agricultural landscape in the valley itself, but also with a decreasing gradient in the surrounding mountain regions, which are therefore not exempt from CUP contamination, although their sensitive ecosystems could be less adapted to agricultural influence.
Prediction
With the categorized and spatially weighed land use data, the number of CUPs and sum concentrations of off-field topsoil and vegetation during the spraying season was predicted for the area of the Upper Rhine Valley with a resolution of 1 × 1 km (see Supplementary Information for further details). The generalized linear model with a Poisson distribution for the number of CUPs in topsoil and vegetation had multiple R² values of 69% and 76%, respectively. The linear model with normal distribution for the sum concentration of CUPs in topsoil and vegetation achieved good explanatory power with multiple R² of 62% and 71%, respectively. The model components reveal fruit, grape and vegetables as driving factors for a higher number of CUPs in vegetation and a sum concentration of CUPs in topsoil and vegetation (Supplementary Table 9, 11, 12). A higher number of CUPs in topsoil was driven by vegetables and other (not further categorized) crops (see methods and Supplementary Table 10). Overall, land use types result in the exposure of the surrounding land much further away than expected using drift extrapolations30, often for multiple hundred metres (See methods section for further details, Supplementary Fig. 1–4). A mean exposure of 4.6 CUPs was predicted for topsoil and 4.3 for vegetation with a maximum of 27 for topsoil and 32 for vegetation (Supplementary Table 14). Contamination in the non-target, off-field areas differ depending on location and neighbouring crops, which can be seen in the varying patterns of the generated maps (Fig. 4).
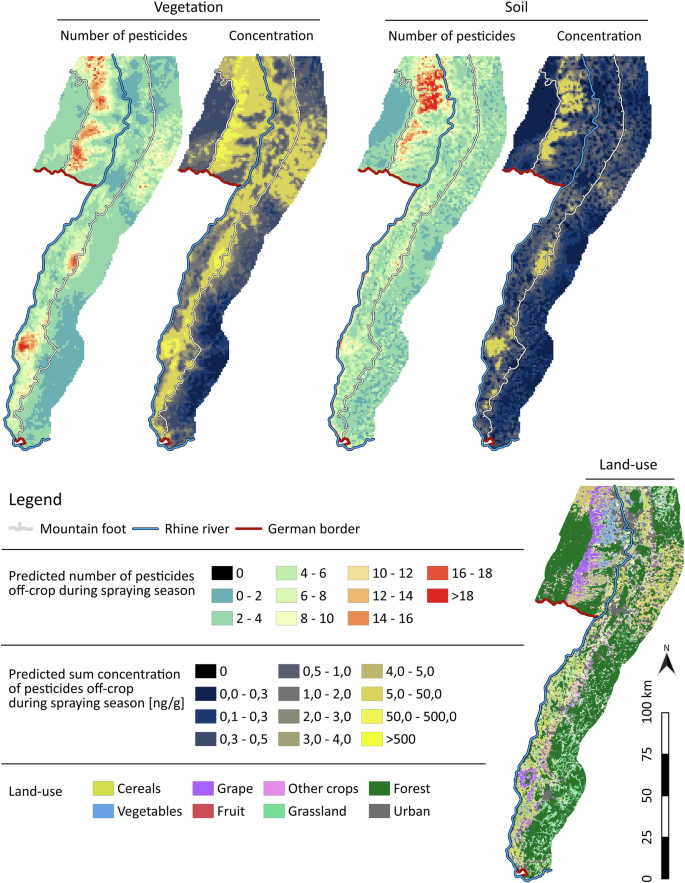
The number of CUPs and sum concentration ng g−1 in off-field vegetation and topsoil during spraying season were predicted with land use categories in a linear model (CUP sum concentration) or generalised linear model (CUP number). Multiple R2 is between 0.62 and 0.76. The raster pixel size is 1 × 1 km. Forest/urban land cover data are from the European Environment Agency (EEA) (2016); the remaining land use categories are from Blickensdörfer et al. (2021). The prediction map is based on the topsoil and vegetation measurements and their 78 sites only.
According to the resulting prediction map, non-target areas located in the agricultural vicinity, are exposed to multiple CUPs in complex mixtures and high sum concentrations, especially in the valley. In the valley and mountain regions of the study area, 37.3% and 9.0% of the land is used for agriculture, respectively (cropping areas without grassland, Supplementary Table 1). A hotspot for the number of CUPs in vegetation was predicted for the slopes at the mountain foot in the southern Palatinate (T1, T2, T3) or the Kaiserstuhl (north of T6), both of which are areas with intense viticulture (Fig. 4, land use). In Europe, the majority of pesticide products for specialty crops are used in viticulture63. Approximately 7.2% of the land in the valley (without the mountain region) is used for viticulture but 18.4% for cereals, 6.4% for vegetables, and 2.7% for fruit production64 (Supplementary Table 1). A slightly different pattern is predicted for topsoil with maxima in a number of CUP detections for the slopes in southern Palatinate (T1-3), too, but also at the valley floor, in the north-western part of the study area (T1). In this region of the valley, vegetables are grown in a large area which contributes to a high predicted number of CUPs. Both topsoil and vegetation show differentiated hotspots within a fruit-growing area close to Achern also called the “Baden fruit paradise”65 and the wine-growing area Kaiserstuhl. In terms of the amount of pesticide product usage ranks, vegetables and fruit trees follow after viticulture63. Predicted sum concentrations reflect an increase in the contamination of vegetation on the wine-growing slopes as shown by the measurement results. This also applies partly to the predicted sum concentration in topsoil, although individual hotspots are more narrowly defined here. The contamination of vegetation appears to be influenced by land use over a greater distance than the contamination of topsoil, as can be seen from the greater distance of explaining land use in the prediction model (Supplementary Table 13).
However, CUP contamination is not limited to agricultural hotspots but is predicted area-wide to occur in the Upper Rhine Valley: more than one CUP is predicted in 98% of topsoil and vegetation samples and contamination-free sites are only expected in remote mountain regions, larger forest blocks or in centres of larger cities that are not closely surrounded by agriculture. We emphasize that this prediction map only shows CUP estimations for non-target areas during the spraying season. A complete contamination map including the target-areas, the cropping areas, is expected to show higher values of CUP numbers and sum concentrations over large areas.
Nature conservation areas
For nature conservation areas (NCA, not including national parks or biosphere reserves) inside the study area, contamination was predicted with a resolution of 200 x 200 m. NCAs are among the most strictly protected areas in Germany66. A mean of 4–5 CUPs was predicted in their vegetation and 5–6 CUPs in topsoil (Supplementary Table 15), which shows that NCAs are not exempt from CUP exposure and are not necessarily refuge areas for protected plants and animal species. Species richness of butterflies decreased in NCAs and other protected areas in Germany67 as well as insect biomass by more than 75% over 27 years17. Insects in NCAs bordering agricultural areas have been shown to be directly exposed to pesticides14. In our extrapolation some areas are predicted to be at particular risk due to their location: A maximum value of 19-20 CUPs is predicted for the vegetation of the “Badberg” on the Kaiserstuhl, which could be explained by the intensive surrounding viticulture. The Kaiserstuhl inhabits 16 different NCAs. Non-target and structurally rich margins in agricultural landscapes have been shown to be important for rare and red-listed species68 and habitats available for non-target organisms in general and terrestrial biodiversity. Therefore, one of the main objectives of the Common Agricultural Policy (CAP) of the European Commission is maintaining and increasing landscape features such as hedges, field margins, dry-stone walls and isolated trees to foster biodiversity in agricultural landscapes69. The potential of such habitats remains to be critically questioned if they cannot be kept pesticide-free. Our results suggest that the compensation potential of non-target areas established or maintained explicitly for biodiversity in agricultural landscapes strongly correlates with the distance to CUP target areas – the cropping area. This is underlined by the prediction of a maximum of 19–20 CUPs in topsoil for the “Sandgrube bei Schauernheim”, a relatively small NCA of 12 hectares surrounded by vast agricultural activities. A nature conservation area in an agricultural neighbourhood with a small size and associated small buffer zone can therefore simply induce high CUP pressure14. Another representative example is the “Kleine Kalmit” (5.7 ha), which is situated on a small hill in a large wine-growing area in southern Palatinate (T3). It was predicted to contain a mean of 11–12 different CUPs in topsoil and 14–15 in vegetation during the spraying season (Fig. 5). In another study, 4 CUPs in topsoil and 16 CUPs were detected in vegetation in July 2021 (August: 7 in topsoil and 12 vegetation) in the southern part of the NCA with the same analytical method22. Our site T3_6 was closest to the “Kleine Kalmit” with a distance of 1,3 km and 11 different CUPs in topsoil and 14 in vegetation could be detected there. This demonstrates the applicability of the NCA prediction, but particular uncertainties exist due to factors such as the climatic conditions in the sampling year or the soil type at the explicit sampling location.
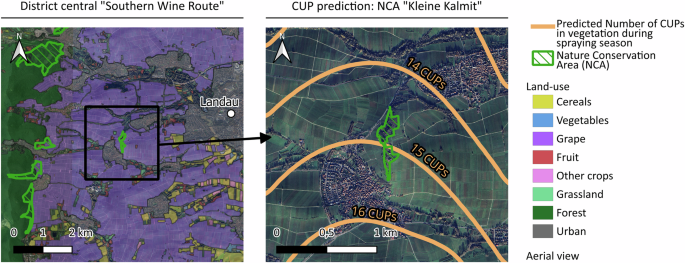
The number of CUPs in off-field vegetation during the spraying season was predicted with a resolution of 200 × 200 m. Multiple R2 of the glm generated with measurements of the number of CUPs in the overall study area = 0.76. Forest/urban land cover data are from the European Environment Agency (EEA) (2016); the remaining land use categories are from from Blickensdörfer et al. (2021). Aerial view: © 2025 Google, TerraMetrics.
Our direct measurements in the Black Forest National Park revealed a total of 4 different CUPs. Additionally, at the Feldberg NCA (sampled at 1277 m a.s.l.), 3 different CUPs were detected. Similarly, 3 different CUPs have been shown to reach remote alpine meadows at 2318 m altitude in the Vinschgau Valley16. The widespread presence of CUPs in NCAs highlights a critical concern: there is an urgent need to establish larger buffer zones around nature conservation areas14 and stop the use of substances that can be found in remote areas, such as the fungicides fluopyram, boscalid and spiroxamine. Additionally, pesticide use is not directly prohibited in NCAs in Germany70 and a general law is needed at the federal level.
Conclusion
Our study reveals that during the spraying season, non-target areas in the agricultural valley and adjacent mountain regions are subject to complex CUP contamination, with varying mixtures depending on the location and surrounding land use. At all study sites there was at least one matrix contaminated, aligning with other studies which find non-target areas contaminated8,10,16. Pesticide drift and run-off events from the terrestrial area of landscapes also affects aquatic systems such as small and medium-sized streams, and aquatic contamination again has feedbacks on the riparian terrestrial zone71. Natural puddles in non-target areas contained the highest contamination levels and are so far not included in environmental risk assessment procedures. The pervasive spread of CUPs suggests an urgent need to prioritize areas at particular risk of contamination: Our spatial assessments revealed that land use types like fruit orchards, vineyards or vegetable fields affect the surrounding land, often for multiple hundred metres. We underscore the challenges in comparing measurement results, as the number of target CUPs, detection limits and quantification limits still have a significant influence on the detection rate. Nevertheless, we demonstrated the utility of predictive models based on real-world samples to determine background contamination and realistic concentrations, including trace levels of CUPs. It is crucial to quickly anticipate potential environmental stressors rather than relying solely on retrospective data collection, due to the time pressure of the ongoing rapid decline in biodiversity. Our prediction maps might also provide helpful tools in biodiversity management implementation for selecting low contamination areas. CUP measurements and predictions highlight the urgent need to reduce the overall number and amount of substances to (re)establish uncontaminated areas that are crucial for nature conservation and human health. CUP mixtures can reduce the diversity of soil fauna72 and therefore very likely impact soil fertility, which was recently considered to be directly related to human health73. In addition, there are higher levels of pesticide exposure among residents living in close proximity to agricultural lands than among those living at greater distances74. Many CUPs are still used preventive75, but their impact extends beyond fields of application, leading to long-term consequences for biodiversity1,76. We show that complex CUP mixtures and their unpredictable components expose entire landscapes and the environmental risk is not assessed correctly. The complex combinations of CUP mixtures and the numerous potential interactions among their components create disregarded environmental pressures across entire landscapes. As this exposure is expected to be chronic as shown for non-target areas in the proximity of 20 m of agricultural fields22, the current pesticide authorisation and risk management practices do not protect terrestrial biodiversity.
The results of this study highlight the need for changes in agricultural practices in the Upper Rhine Valley, but also for other Central European regions with pesticide-intensive agricultural production to reach global pesticide reduction targets77. More sustainable approaches like the production of baking cereals without the use of synthetic pesticides are possible and already in place for many years78 and would affect a large proportion of the agricultural landscape in the EU as one-third of the total utilisable agricultural area is used for cereal production79. Together with the aim of transforming 25% of the agricultural land to organic production by 2030, as formulated originally in the EU Green Deal80 and integrated in national and international policies77,81, synthetic pesticide use could be substantially lowered leading to a reduction of pesticide exposure of biodiversity and humans. Our prediction mapping approach could be repeated with measurements in 2030 to evaluate these reduction efforts.
Methods
Study region
The Upper Rhine Valley ranges from Basel in Switzerland to Bingen in Germany (270 km), embraced by the mountain plateaus of the Vosges Mountains and Black Forest in the south and the Palatinate Forest and Odenwald in the north. The Upper Rhine Valley has a mean air temperature of 8.6 °C, mean annual precipitation of 73.5 cm and 15 large cities with more than 100,000 people82. Agriculture is a dominant land use in the valley with vegetables and arable crops in the valley lowland and viticulture being mainly present on the mountain foot. The mountain plateaus are separated from the valley by a sudden rise in altitude – slopes (study sites covered 99 to 1378 m) – and are dominated by forest cover. Data were collected close to Ludwigshafen (north, T1) to Staufen im Breisgau (south, T6). The prediction was limited to the area from Worms to Basel (10,976 km² prediction area) within Germany, which includes part of the Valley, the Black Forest, and the Palatinate Forest. The study area contained parts of the UNESCO Palatinate Forest-North Vosges Biosphere Reserve and Black Forest Biosphere Reserve as part of the Natura 2000 Network, Nature Conservation Areas and the Black Forest National Park.
Sampling and pesticide analysis
Six line transects with west/east orientation and 30 km length were selected to cover the valley as well as the mountain regions (Fig. 1). Thereby, three transects were set in the northern part at the section of the Palatinate Forest (T1, T2, T3), two transects at the section of the Black Forest National Park (T4, T5) and one transect at the section of the Feldberg (1277 m a.s.l.), the highest mountain in the Black Forest (T6). With a main wind direction from south-west to north-east, mountain areas in T1, T2, T3 would get contaminated against and T4, T5 and T6 with the main wind direction if a connection between wind and long-distance transport is assumed. For each 30 km long line transect, six sampling sites were placed in the valley (TX_1 – TX_6), one close to the mountain foot (TX_7) and six in the mountain area (TX_8–TX_13), resulting in 13 sampling sites per transect. The site selection process yielded an average transect length of 31.5 km and an average distance of 2.6 km between sampling sites along the transects. The sites in the mountain area were selected to capture the sequence of the geographic altitude (sequence of mountain and small valley). For CUP area comparison, the 13 sites of each of the six transects were split into valley and mountain region depending on their position regarding the sudden increase in altitude at the mountain foot (sites close to the mountain foot were categorized, too), resulting in a total of 78 sampling sites. Between June 15th and July 11th 2022, composite topsoil samples consisting of 25 subsamples were taken from a grassland area of 4 x 4 m per sample point with a topsoil corer (diameter: 13 mm, 5 cm deep, Rasengrün, Ingelheim, Germany) in a depth of 0–5 cm. Similarly, vegetation representative of the sample site was manually handpicked in the same area and placed in a 1 L plastic bag. The vegetation samples then included a mixture of different parts (excluding roots) of grass, herbs and leaves of shrubs depending on availability. If a surface water source (puddle, stream or river) was present in the immediate proximity of the sample point, a 250 ml water sample was taken. Transportation to the laboratory and storage in a freezer at −20 °C took place after sampling as soon as possible. Vegetation, topsoil and surface water samples were then further processed in the laboratory.
Vegetation and topsoil samples were analysed9 for 93 CUPs using a high-performance liquid chromatography coupled with an electrospray ionization tandem mass spectrometry system (HPLC-ESI-MS/MS; HPLC: Agilent Technologies LC 1260 Infinity II series, MS/MS: Agilent Technologies 6495C, Santa Clara CA, USA). Surface water samples were analysed for 75 CUPs with a direct-injection HPLC-ESI-MS/MS method25. Details on the extraction procedures and analytical HPLC-MS/MS method and instrument parameters can be found in the Supplementary Information.
CUP sum concentrations were calculated for each sampling site as the sum of all single CUP detections above the limit of quantification (>LOQ) in vegetation, topsoil and water separately. Limits of quantification and detection can be seen in Supplementary Table 6.
Land use and topography data
National-scale crop type maps for Germany from combined time series of Sentinel-1, Sentinel-2 and Landsat 8 data (2017, 2018 and 2019) were used as agricultural land use data64. Google Satellite Imagery WMS data was used for satellite images83. The land use types were grouped into categories “Grassland”, “Cereals”, “Vegetables”, “Grape” and “Fruit”. Remaining land use types were grouped into “Other crops”, also containing areas specified as “Other agricultural areas”. Forest and urban cover was assessed with the Corine Land Cover (CLC) dataset84 resulting in a total of 8 different land use categories. Further topographic indices (Altitude, Roughness Index, Topographic Wetness Index, Topographic Position Index, Wind Shelter Index and Wind Exposition Index) and environmental factors (Mean land surface temperature for the years 2018–2020) were evaluated for their correlation with land use data by using them in a separate principal component analysis. Due to a strong correlation with agricultural activities, they were excluded for predictions (Supplementary Information for details).
Optimization and spatial weighing of land use categories
We found CUPs far from the agricultural valley, contrary to the expectation of particularly remote and clean mountain regions. We, therefore, asked how far away the agricultural areas are responsible for the occurrence of CUPs in remote regions. To do so, we grouped the land use into 8 different categories (“Grassland”, “Cereals”, “Vegetables”, “Grape”, “Fruit”, “Other crops”, “Forest” and “Urban”), assuming that similar land use types would lead to similar CUP applications. We dissected the categorized land use area into a raster of 10 x 10 m.
We then computed how much of the land with a certain distance (sigma) to a test-site is from each given land-type use. We assumed that areas closer to the sampling site would contribute more to the CUPs detected at the sampling site and therefore we used a (two-dimensional) Gaussian kernel based on distance to the sampling site as weights for the raster points. Specifically, we computed the mean land coverage of type (L) around a given sampling site (i) as
where (A) is the area of a pixel, in our case (10mtimes 10m=100{m}^{2}), (sigma) is the kernel width indicating how much of the surrounding land contributes to the land coverage, ({x}_{i}) are the coordinates of the sampling location and ({x}_{l}) are the coordinates of the raster point. The sum is taken over all areas (l) with land use type (L). The factor in front of the Gaussian kernel ensures that ({W}_{{iL}}=1) if all the surrounding land would be of type (L). The area within (1.96sigma) of the sampling site contributes to 95% of the weighted area. We computed this mean land type coverage for all 78 sampling sites (i), each of the 8 land use types (L) and for (sigma) varying from 50 to 5000 in steps of 50.
Given these mean land coverages for the sampling sites and land use types we searched for the optimal kernel width ({sigma }_{L}) for each land type which would lead to the “best” prediction. Specifically, we fit a generalized linear model (glm) for the CUP richness and a linear model (lm) for the sum concentration and varied the kernel width σL for each land type and optimized R2 for the prediction.
Unfortunately, this results in a nonlinear optimization problem in an 8-dimensional space, which has no simple solution. We therefore used gradient descent methods to find the locally optimal combination of σL. We started the optimization algorithm 5000 times with different starting points, e.g. resulting in a total of 176 different local optima for the number of CUPs in vegetation, but we most likely have not found all local optima. For better visual separation we weighted the local optima with their absolute estimate of the resulting model. However, plotting the resulting ({sigma }_{L}) reveals that most optima have similar ({sigma }_{L}) depending on the land use type (Fig. 6). We caution that we have fit many thousands of linear and generalized linear models during the optimization algorithm. It is therefore not meaningful to compute the p-value for the resulting optimal fits, we therefore only report the corresponding ({R}^{2}) value.
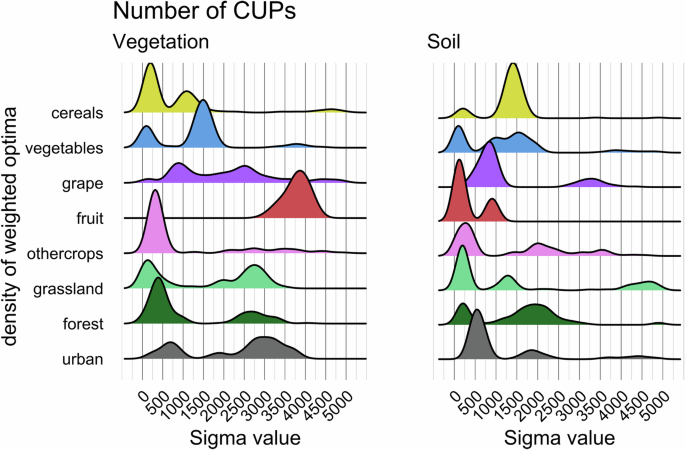
Sigma values were the standard deviation of the normal distribution (in metre) which were used for optimization regarding the distance to the prediction site. An optimum was considered as a sigma when the highest multiple R2 of a model with several sigma compared was reached. Each optimum was additionally weighted with its absolute estimate of the generalized linear model, containing all eight land use categories with a certain sigma combination which resulted in a peak R2.
Overall, land use categories affect the surrounding land much further away than tested basic drift values30, often for multiple hundred metres (Fig. 6). However, some land use categories (e.g. urban or grassland) showed multiple possible (sigma), indicating that a certain land use type may have different effects on the surrounding land depending on the distance (See SI for all (sigma) histograms). Land use type urban seems to fit a (sigma) at 750 m and 3000 m for the number of CUPs in vegetation. This could be due to the positive relationship of the occurrence of various agricultural practises near smaller villages ((sigma) 750 m), but when there is a lot of urban land in a larger area ((sigma) 3000 m), agricultural land tends to be absent (larger cities). The categories of crop types must be considered differently, which may be due to the specific CUPs used and their application technique. For vegetation and fruit, a maximum (sigma) of 3750 m was determined. Thus, if CUP contamination is predicted for a non-target site for vegetation during spraying season, 68% of information for fruits contribution is between 0 and 3750 m (see Supplementary information for further details).
Prediction
Regularly spaced prediction points with a distance of 1000 m were placed in the study area. Prediction points in mountain regions that were further from the mountain foot than the measured sample sites were removed (>16.5 km).
The measured number of CUPs and their sum concentrations as independent variables and the optimized combinations of the land use categories and their best explaining (sigma) as dependent variables were used inside a generalized linear model (number of CUPs) or linear model (log of (sum concentration + pseudo constant of 0.01)) for prediction. The predicted values were rasterized to generate a map.
Nature conservation areas
Nature conservation areas (NCAs) shape files were provided by the Bundesamt für Naturschutz85 and considered if they were located inside the study area. Regularly spaced prediction points with a distance of 200 m were generated inside the NCAs. The same generated glm/lms which were used for the large prediction maps were used to predict the number of CUPs in NCAs. To determine the overall mean number of CUPs inside a NCA, all points inside a NCA were averaged. To generate a map of the “Kleine Kalmit”, regular spaced prediction points with a distance of 100 m were generated. Previously mentioned glms were used to predict the number of CUPs and rasterized.
Reporting summary
Further information on research design is available in the Nature Portfolio Reporting Summary linked to this article.


Responses