Cyclic stretch regulates epithelial cell migration in a frequency dependent manner via intercellular vinculin recruitment

Introduction
Organ function and tissue development rely on interconnected sheets of epithelial cells. In adult tissue, these cells regulate nutrient absorption, filtration, and act as a mechanical barrier against trauma or pathogenic invasion. During tissue development, they fold and constrict, shaping new tissues. Unlike passive cellular materials such as foams, cork, honeycombs, etc., the epithelium consumes and exerts energy as independent units. This property allows epithelial cells to migrate, rearrange, and alter their cellular shape1,2,3,4,5, facilitating their specific functions in dynamic microenvironments6.
Epithelial microenvironments exhibit high dynamism, particularly in terms of mechanical stretch and deformation. For example, lung alveolar epithelial cells experience cyclic stretching due to respiratory rhythms7, while peristaltic contractions of smooth muscle cyclically stretch regions of the intestinal epithelium8. In developing tissues, pulsatile stretches help orchestrate events such as gastrulation and dorsal closure in Drosophila9,10. These cyclic mechanical stretches occur across various epithelial microenvironments but differ significantly in frequency and magnitude. Many diseases also disrupt the natural mechanics of epithelia by altering stretch magnitudes and rates, as seen in irritable bowel syndrome8, asthma7,11, and colorectal cancer12.
Several studies have employed in vitro mechanical stretching experiments to elucidate the effects of cyclic stretch on epithelial behavior. At higher cyclic stretch amplitudes and frequencies (>20%, >1 Hz), researchers have observed gap formation in epithelia of parental Madin-Darby canine kidney (NBL-2) cells13 and a decrease in wound healing time compared to an unstretched epithelium14. There is also evidence that cyclic stretch mediated wound healing is ECM dependent15. Researchers have also observed epithelial cell shape reorientation in response to uniaxial cyclic stretch16,17,18,19 which is believed to influence morphogenesis and wound healing20,21. Studies of isolated NRK (normal rat kidney) epithelial cells (stretched from 5 to 20% at 0.5 Hz) found stretch-induced reorientation depended on microtubule remodeling16, while studies of isolated A549 alveolar epithelial cells (stretched from 5 to 15% at 0.3 Hz) found this reorientation also required stress fiber remodeling (i.e., F-actin)18. Stretch frequencies have ranged broadly from study to study (0.1–2.15 Hz)13,15,16,17,18,19, which may contribute to different findings. Moreover, comparison across these studies is complicated by the use of different strains of epithelial cells which can have different adhesion and proliferation characteristics22. In related experimental studies23,24 and single cell theoretical models25, direct comparisons of the effects of stretch frequency on endothelial or fibroblast stress fiber reorientation do suggest a frequency dependent relationship. However, the role of cyclic stretch frequency in regulating collective epithelial behavior is less clear and we sought to address this gap.
Under in-plane mechanical load, epithelial cells exert forces on each other at their cell-cell contacts. These contacts encompass several junctions, including tight junctions, desmosomes, gap junctions, and adherens junctions26,27,28. Among these, the adherens junction plays a mechanosensitive role in guiding cell migration29 and regulating cell proliferation30,31, even responding to static stretches32,33,34. Yet, the role of the adherens junction in regulating responses to cyclic stretch is unknown.
The transmembrane protein E-cadherin serves as the intercellular mechanical linkage in the adherens junction. E-cadherin forms a trimeric complex with cytosolic β-catenin and α-catenin, which binds to F-actin26. Various adapter proteins stabilize the binding of this complex to F-actin under mechanical load. For example, p120-catenin localizes to E-cadherin to block clathrin-mediated endocytosis of E-cadherin and maintain stability of the complex35. Another protein, vinculin, reinforces the α-catenin/F-actin interaction under mechanical load36,37,38 to fortify the adherens junction39. Despite the known mechanosensitive recruitment of vinculin to the adherens junction, it is unclear how it is recruited with cyclic stretch and how that recruitment affects epithelial shape change and migration.
We sought to learn how different frequencies of uniaxial cyclic stretch impacted epithelial behavior and the potential role of vinculin in mediating this behavior. We subjected high density, confluent Madin-Darby canine kidney (MDCK type II) epithelial monolayers to a range of physiological cyclic stretch frequencies (0.1 Hz, 0.5 Hz, and 1 Hz) at a physiological stretch magnitude of ~10%8,40,41,42,43. Observing the effect of cyclic stretch on the epithelium over time is challenging because stretch devices must be amenable to long-term live cell imaging; to overcome this challenge, we integrated a programmable pneumatic cell stretching device44 with a microfluidic perfusion system to observe cell migration after cyclic stretch.
Results
Cells adjust morphology in response to cyclic stretch
To investigate the long-term dynamic response of the epithelium to cyclic stretch, we utilized a pneumatic cell stretcher device previously detailed44 (Fig. 1a). First, we created a polydimethylsiloxane (PDMS) device from a 3-D printed mold and adhered a thin PDMS bottom membrane, forming 2 main channels. The center channel, flanked by inlet and outlet ports, functioned as the substrate for the epithelium. The outer air-filled channel, encircling the center channel, contracted when vacuum was applied. This contraction of the outer channel led to the uniaxial stretching of the membrane of the central channel and the adherent epithelium. By applying a programmable input pressure of 60 kPa, cells were uniaxially stretched30,44, resulting in ɛyy = 10% ± 2% as measured by cell membrane elongation (Supplementary Fig. 1a). Since this small level of stretch is difficult to observe, stretched cells were labeled with Hoechst to visualize nuclei displacement (Fig. 1b). To examine the impact of 10% stretch on cell morphology, we performed a high-throughput automated segmentation of the epithelium before and after stretch (Supplementary Fig. 1b–d). This method enabled the analysis of numerous cells, offering robust statistical power to identify variations in cell morphology such as average cell area and perimeter.

a Schematic of PDMS pneumatic cell stretching device. Vacuum in the outer chambers contracts the epithelium ~10% uniaxially. b Nuclei were labeled with Hoechst and imaged before and after application of a 60 kPa vacuum to generate a 10% uniaxial stretch. Green nuclei indicate cells without stretch (0 kPa) and magenta denotes displaced nuclei in stretched cells (60 kPa). c Schematic of experiment for applying cyclic stretch to an epithelial sheet, where cells were imaged immediately before and after application of a sinusoidal 10% stretch at different frequencies for 30 min. d At lower frequencies, cells retained their cell solidity. e, f At 0.1 Hz, cells elongated perpendicular to stretch and contracted in the direction of stretch. n > 10,000 cells per half of each violin plot. Scale bar in (b) is 50 µm. Statistics were generated from a two-tailed student t-test assuming equal variance. Dotted lines in all violin plots represent the 25th/75th percentiles of data distribution, while the solid lines represent the mean. For segmentation analysis, approximately 8 different regions of the epithelium were imaged across each biological replicate (3 per condition, 9 biological replicates for the no stretch control). P values are denoted as *p < .05; **p < .005; ***p <.0005.
After validating that a 10% static stretch changed cell morphology, we subjected the epithelium to 1 Hz, 0.5 Hz, or 0.1 Hz cyclic stretch of 10% for 30 min (Fig. 1c). We imaged the epithelium before and after cyclic stretch, with the membrane fully relaxed (time = 0 h and 0.5 h, respectively). We then performed a large-scale segmentation of all images, which was made possible by a stably transfected cell line with a GFP E-cadherin fluorophore45. We extracted several shape descriptors from these segmented images, including cell solidity, which is distinct from tissue solidity. Cell solidity is defined as (frac{{A}_{{cell}}}{{A}_{{convex}}}), where Acell is the cell area and Aconvex is the convex area. Higher cell solidity indicates rounder cells, while lower cell solidity implies more protrusions46. This metric has been used to assess cell deformability and is associated with age-related macular degeneration of retinal pigment epithelial cells47,48. Interestingly, we found that cell solidity was highly frequency dependent (Fig. 1d). Higher frequency (1 Hz) stretch or no-stretch led to decreased average cell solidity. In contrast, lower frequencies (0.5 Hz and 0.1 Hz) did not elicit significant changes in average cell solidity. Cell morphological parameters including circularity and shape index (({Perimeter}/sqrt{{Area}})) were decreased and increased, respectively, under higher frequency 1 Hz cyclic stretch, but not statistically different from 0.1 Hz nor 0.5 Hz (Supplementary Fig. 2).
At the lower frequency of 0.1 Hz, we also observed a reorientation of epithelial cells (Fig. 1e, f). Cells reduced their length in the direction of uniaxial stretch (y) and extended their length perpendicular to stretch (x). This shape change corroborates previous studies of how cyclic stretch modulates cell shape16,19,49. We did not observe cell reorientation at 0.5 Hz or 1.0 Hz. These investigations extended the analysis of morphological shifts by linking reorientation to the stabilization of cell solidity. These morphological alterations suggested a role for intercellular signaling at cell-cell contacts.
Low frequency stretch suppresses epithelial migration
After cyclic stretching the epithelium for 30 min (time = 0.5 h), we observed how the epithelium changed its collective migration over the next 6 h (Fig. 2a). Comprehensive studies of how cyclic stretch governs the collective epithelium are limited, partly due to the challenges inherent in such investigations. Conducting live cell imaging for prolonged periods on a cell stretcher platform is demanding. The bottom membrane must be both transparent and thin enough for imaging, and many cell stretcher setups are not fully enclosed. Open systems are susceptible to media evaporation within hours and cannot be continuously imaged on a microscope. To counteract this challenge, we integrated a microfluidic based perfusion system within our device to prevent evaporation (Fig. 2b). A syringe pump sustained a slow media flow rate of 300 µL/h, resulting in minimal shear stress of approximately 2.56 × 10⁻⁴ dyn/cm2 on the apical side of the epithelium (Supplementary Fig. 3). Furthermore, we eliminated out of plane drift during imaging by mounting the device on a thin glass coverslip.
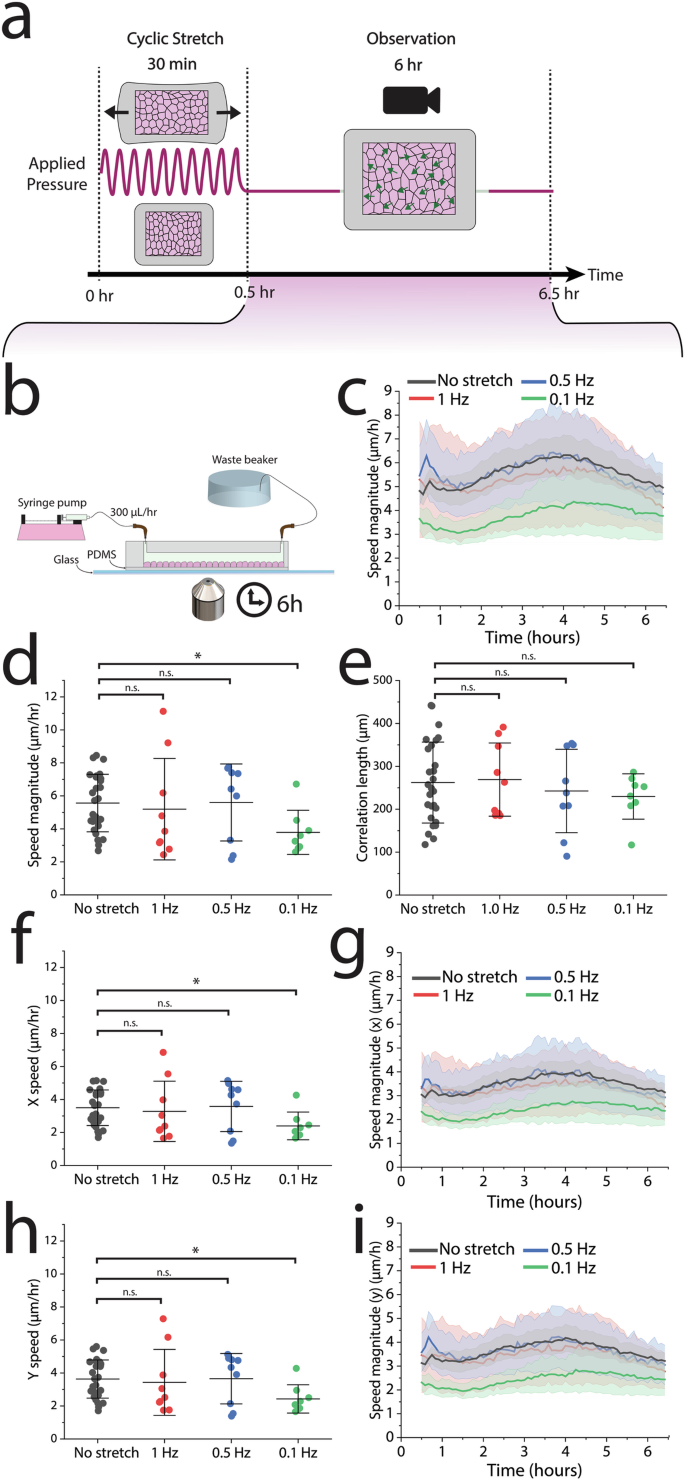
a PIV analysis was conducted in the observation period, the 6 h following 30 min of cyclic stretch. b After cyclic stretch, the device was integrated with a perfusion system and imaged on a glass slide to remove out-of-plane drift. c, d The average cell speed diminished significantly in response to a 0.1 Hz frequency, but (e) had no significant impact on cell correlation length. f–i Both the x and y speeds are reduced in response to 0.1 Hz uniaxial stretch. No-stretch control: n = 27 across 9 independent experiments, 1 Hz: n = 9 across 3 independent experiments, 0.5 Hz n = 9 across 3 independent experiments, 0.1 Hz: n = 8 across 3 independent experiments. For each independent experiment, we imaged 2–4 different regions across the epithelium when observing migration. For data that exhibited a normal distribution as determined by the Shapiro-Wilk test, statistics were generated from a two-tailed student t-test assuming equal variance. For data that exhibited a non-normal distribution, we used a Mann–Whitney U test. Shaded regions in all 6-h migration observation plots represent the 95% CI. I-bars in all scatter plots represent the mean ± SD. P values are denoted as *p < .05; **p < .005; ***p <.0005.
We utilized particle image velocimetry (PIV) to track displacement of cells during this 6-h period and confirm collective cell migration (Supplementary Fig. 4). Cells within the monolayer moved as large cohesive clusters, corroborating previous studies of collective cell migration. This method facilitated the calculation of migration parameters including average speed, total distance traveled, and specific x and y movements.
To discern whether the migratory responses occurred over different timeframes, potentially masking variations in speed averages, we plotted migration speed against time (Fig. 2c). The speed was most significantly disrupted immediately following a 0.1 Hz cyclic stretch. After 6 h the speed equalized across all frequencies, resembling the no-stretch control. Surprisingly, the migratory response of cells in the 0.5 Hz and 1 Hz conditions closely matched the migration timescales of the control condition. In all cases, we observed a sigmoidal response in speed fluctuation over time, with initial deceleration, brief acceleration, and subsequent deceleration towards the end of the observation period. Average speeds for the no-stretch control, 1 Hz, and 0.5 Hz conditions were approximately 5–6 µm/h. Notably, the slowest frequency condition (0.1 Hz) displayed a significant reduction in average speed to around 3.8 µm/h (Fig. 2d). To determine whether the cyclic strain regulated the coordination of cell migration across the monolayer, we calculated the length scale of correlated motion between cells (i.e., correlation length). Interestingly, we found that there was no significant change in correlation length for cells between conditions (Fig. 2e).
Given the uniaxial nature of the applied stretch (ɛyy), we also explored the possibility of direction-specific migration dysregulation. However, migration was slowed in both the direction of stretch (y) and perpendicular to stretch (x) (Fig. 2f–i).
Adherens junction regulates suppression of cell movements
After establishing that slow frequencies disrupted collective epithelial migration speed, we investigated the role of an intact adherens junction in regulating this migration reduction. We utilized MDCK cells expressing a mutant E-cadherin protein (T151 cells, made in an MDCK GII background), lacking the extracellular domain of E-cadherin, thus inhibiting adherens junction interaction50. The T151 MDCK cells have a doxycycline (DOX) repressible promoter50; mutant E-cadherin is repressed by doxycycline, which when removed causes overexpression of the truncated, mutant E-cadherin ectodomain50. The overexpression of the mutated E-cadherin inhibits mechanical linkages at the adherens junction (Fig. 3a), though cells are still able to form cell-cell contacts via desmosomes and tight junctions.

a The extracellular domains of E-cadherin are truncated on the T151 MDCK cells, preventing formation of the adherens junction while allowing formation of other cell-cell adhesions. b T151 MDCK cells showed no significant differences in collective average speed magnitude from 1.0 or 0.1 Hz stretch (c) despite an initial increase in migration speed immediately following 0.1 Hz cyclic stretch. d No significant differences were observed for T151 cell correlation lengths between stretch condition. e, f The migratory response showed no directional dependence. Dashed lines in all graphs indicate means of WT MDCK controls (Fig. 2). No stretch control: n = 9 across 9 independent experiments, 0.1 Hz: n = 10 across 4 independent experiments. For each independent experiment, we imaged 2–4 different regions across the epithelium when observing migration. For data that exhibited a normal distribution as determined by the Shapiro–Wilk test, statistics were generated from a two-tailed student t-test assuming equal variance. For data that exhibited a non-normal distribution, we used a Mann–Whitney U test. Shaded regions in all 6-h migration observation plots represent the 95% CI. I-bars in all scatter plots represent the mean ± SD. P values are denoted as *p < .05; **p < .005; ***p <.0005.
We noted distinctive characteristics of the T151 epithelium compared to WT MDCK epithelium. First, in our hands the epithelium did not grow as dense. Second, small holes can form in the epithelium over time, a phenomenon previously reported in ref. 50.
Overall, we found that T151 cells were more migratory and maintained a faster average migration speed of approximately 22 µm/h. Despite the increase in migration speed compared to the wild-type MDCK cells, we observed no significant differences in migration between T151 cells subjected to 0.1 Hz or cyclic stretch and those without cyclic stretch (Fig. 3b). Interestingly, as a function of time, we observed a brief (1.5 h) increase in migration speed for cells subjected to 0.1 Hz cyclic stretch (Fig. 3c). We incorporated a high frequency control (1.0 Hz), which also had no significant difference in migration speed compared to the no stretch control. There were no differences between the no stretch control and stretched cells with respect to their correlation length as well as x and y migration speeds (Fig. 3d–f). Immunohistochemistry (IHC) staining of the cells confirmed the lack of an adherens junction complex, as evidenced by minimal p120-catenin and vinculin expression at cell-cell contacts (Supplementary Fig. 5). Together, these results indicate that an intact adherens junction is necessary for reduced migration following 0.1 Hz cyclic stretch.
Cell-cell contacts recruit vinculin in response to low frequency stretch
After establishing the stretch dependent migratory response of the adherens junction, we looked at the role of vinculin further downstream within the complex. Vinculin is known to support the adherens junctions by stabilizing the α-catenin and F-actin interaction in a force sensitive manner51. While vinculin’s mechanosensitive role within the adherens junction is acknowledged36,37, its involvement in supporting cell–cell contacts under cyclic stretch, as well as its duration of action in reinforcing the adherens junction, remain less clear.
We conducted a new set of experiments to test the effect of 0.1 Hz cyclic stretch on localization of vinculin. We also included high frequency controls at 0.5 Hz and 1.0 Hz to determine if there was a possible frequency dependence. These experiments were conducted under two different time conditions: cells were fixed immediately after cyclic stretch (0.5 h) or allowed to relax for 30 min before fixing and staining (1.0 h) (Fig. 4a). No-stretch control devices were fixed and stained following the same time intervals.

a Epithelial sheets were cyclically stretched for 30 min at ~10% stretch and either fixed immediately (t = 0.5 h) or fixed after 30 min (i.e., 1 h after the onset of stretch) and then stained for vinculin. b Vinculin quantification: E-cadherin labeled images were segmented and the resulting ROIs were overlaid onto the corresponding vinculin labeled images. c All ROIs were then eroded 3 px to isolate the cytoplasmic region of the cell from the edges of the cell. By obtaining the fluorescence intensity of vinculin in the total cell (Itotal) as well as the fluorescence intensity of vinculin in the cytoplasm for the eroded cell (Icyto), we computed the fluorescence intensity of vinculin at the cell-cell contact (IAJ) using the area fraction of the cytoplasm. d Following 0.1 Hz cyclic stretch, IAJ/Icyto significantly increased from the no stretch control, though diminished approximately after 30 min. n for violin plots left to right: 1273, 1000, 1064, 986. e Following 0.5 Hz cyclic stretch, IAJ/Icyto significantly increased from the no stretch control and remained elevated after 30 min. n for violin plots from left to right: 396, 337, 378, 422. f IAJ/Icyto did not significantly increase in response to 1.0 Hz cyclic stretch from the no stretch control. n for violin plots from left to right: 402, 404, 378, 422. Scale bars are 50 µm. IHC images shown here were contrast enhanced to help visualize the proteins of interest, but not altered for segmentation analysis. Statistics were generated from a two-tailed student t-test assuming equal variance. I-bars in all violin plots represent the mean ± SD. 3 separate regions were imaged across each of 2 independent biological replicates per condition. P values are denoted as *p < .05; **p < .005; ***p <.0005.
High-throughput quantification of vinculin localization
We quantified vinculin recruitment to cell-cell contacts using a unique cell segmentation approach. Traditional fluorescence intensity measurements for quantifying protein recruitment at cell-cell contacts are often low-throughput and subject to user bias. In contrast, cell segmentation offers increased throughput, enhanced statistical power, and reduces user bias. E-cadherin GFP labeled MDCK cells were segmented, and their shape outlines were then overlaid onto the corresponding vinculin-stained images of the same cells (Fig. 4b). The outlines were eroded either 0 or 3 pixels to encompass the entire cell or isolate the cytoplasmic region, respectively (Fig. 4c). By measuring the mean fluorescence intensity of both the entire cell and the cytoplasmic region (Itotal and Icyto, respectively), then calculating the area fraction of the eroded region (Supplementary Fig. 6), we calculated the mean fluorescence intensity of vinculin at the cell–cell contact (IAJ) for nearly every cell across all images. We normalized the data on a single cell basis by comparing the ratio of IAJ to Icyto for each cell.
Immediately following 0.1 Hz cyclic stretch (t = 0.5 h), IAJ/Icyto significantly increased from the no stretch control condition (~4.5%), signifying a recruitment of vinculin to cell-cell contacts (Fig. 4d). Notably, vinculin recruitment was transient, with a significant reduction in IAJ/Icyto (3.4%) after just 30 min of cell relaxation. However, IAJ/Icyto vinculin levels remained significantly higher than in the no stretch control condition. We also compared the effect of higher frequencies (0.5 Hz and 1.0 Hz) on vinculin localization at cell-cell contacts to test the hypothesis that it was frequency dependent. We observed a significant increase in IAJ/Icyto from 0.5 Hz stretch of approximately 2.5% (Fig. 4e), which remained elevated after 30 min of monolayer relaxation. Lastly, the 0.5% increase in IAJ/Icyto from 1.0 Hz compared to the no stretch control condition was not significant (Fig. 4f), which did not significantly change after 30 min of monolayer relaxation. By plotting the percent increase in IAJ/Icyto immediately after cyclic stretch (time t = 0.5 h), we observed a steady decrease in vinculin recruitment to cell-cell contacts with increasing stretch frequency (Fig. 4g).
Vinculin is necessary to suppress migration in response to cyclic stretch
With evidence of vinculin recruitment to cell-cell contacts at 0.1 Hz cyclic stretch, we tested whether vinculin was necessary for this mechanically regulated migration change. We repeated migration studies using a vinculin knock-out (KO) cell line, made in the MDCK GII background and KO confirmed via western blot52 (Fig. 5a). Vinculin KO cells were observed after 30 min of 0.1 Hz cyclic stretch, as well as in a no-stretch control and 1.0 Hz control. We noted that the no-stretch control Vinculin KO cells moved slightly quicker (~18 µm/h) than the WT MDCK cells, consistent with other studies53,54. Interestingly, Vinculin KO cells observed after 0.1 Hz uniaxial mechanical stretch slightly increased in migratory speed (Fig. 5b). When plotted as a function of time, the migration speed did not increase initially, but only after about 3 h were there distinct differences (Fig. 5c). These changes were also reflected in the total distance traveled, where 0.1 Hz stretched cells moved significantly further (Fig. 5d). This trend contrasted with the migration reduction in the MDCK WT cells after cyclic stretch. We did not observe this significant increase in migration speed in the 1.0 Hz stretch condition. For all conditions, we observed a similar sigmoidal band of migration speed, similar to the migration response for the WT MDCK cells. Just as with the WT MDCK cells, the change in migration speeds were independent of direction (Fig. 5e, f). IHC staining of devices after the 6-h observation period confirmed low vinculin expression (Supplementary Fig. 7).
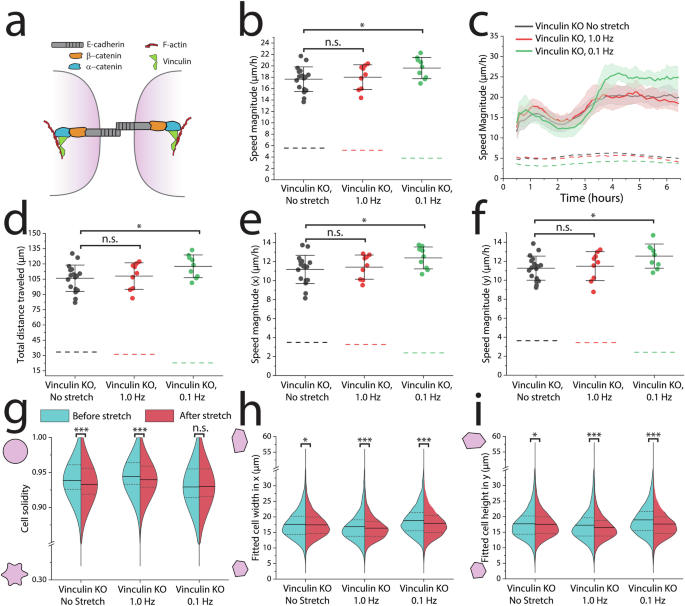
a Vinculin reinforces the α-catenin/F-actin complex during mechanical load. b Migration speed averaged across 6 h following 30 min of cyclic stretch indicates an increase in migration speed from 0.1 Hz stretch, but not 1.0 Hz stretch. c 0.1 Hz stretched Vinculin KO cells increase their speed after ~3 h, which (d) allows them to overall travel further compared to the 1.0 Hz and no stretch controls. e, f There is no difference in migration speed as a function of direction. g, h Across all experiments, 5000–10,000 cells were segmented immediately before and after 30 min of 0.1 Hz cyclic stretch. g 0.1 Hz stretched Vinculin KO cells retained their cell solidity while the cell solidity significantly decreased in the no-stretch and 1.0 Hz controls. h, i Vinculin KO cells stretched from either 1.0 Hz or 0.1 Hz shortened their lengths in both x and y directions. Dashed lines in all graphs indicate means of WT MDCK controls (Fig. 2). No-stretch control: n = 9 across 3 independent experiments, 0.1 Hz: n = 9 across 3 independent experiments. 1.0 Hz: n = 9 across 3 independent experiments. For each independent experiment, we imaged 2–4 different regions across the epithelium when observing migration. Statistics were generated from a two-tailed student t-test assuming equal variance. For PIV migration data that exhibited a non-normal distribution as determined by the Shapiro–Wilk test, we used a Mann–Whitney U test. Shaded regions in all 6-h migration observation plots represent the 95% CI. I-bars in all scatter plots represent the mean ± SD. Dotted lines in all violin plots represent the 25th/75th percentiles of data distribution, while the solid lines represent the mean. For segmentation analysis, approximately 8 different regions of the epithelium were imaged across each biological replicate (3 per condition). n > 5000 cells per half of each violin plot. P values are denoted as *p < .05; **p < .005; ***p <.0005.
We also labeled plasma membranes prior to cyclic stretch to observe changes in cell morphology (Fig. 5g–i). Strikingly, the morphological changes in the Vinculin KO cells were similar to the changes observed in the WT MDCK cells. 0.1 Hz stretched Vinculin KO cells retained their cell solidity similarly to WT MDCK cells in response to 0.1 Hz cyclic stretch (Fig. 5g). Meanwhile, the 1.0 Hz and no stretch control cells had significant decreases in cell solidity. Vinculin KO cells stretched at either 1.0 Hz or 0.1 Hz significantly shortened their average length in both the (x) and (y) directions (Fig. 5h, i). In response to 0.1 Hz, cells reduced their width (x) approximately 4.4% and their height (y) approximately 7.1%. In response to 1.0 Hz, cells reduced their width approximately 2.8% and their height (y) approximately 4.5%. These changes are unique for the 1.0 Hz stretched cells, considering the WT cells did not change their lengths after 1.0 Hz stretch. Interestingly, the no stretch control Vinculin KO cells did not have a reduction of length nor width to nearly the same degree (~1% reduction for both width and height).
Discussion
After discovering that slower frequencies (0.1 Hz) regulated cell shape and migration, we investigated the adherens junction as a mechanosignaling center. Using E-cadherin T151 mutants, Vinculin KO lines, and immunohistochemistry, we confirm 3 unique findings: (i) vinculin is recruited to cell-cell contacts in a frequency dependent manner, (ii) this vinculin recruitment from 0.1 Hz stretch is transient and reduces after 30 min, and (iii) the migratory response of the epithelium at 0.1 Hz requires functional vinculin.
Our work extends prior studies on cyclic cell stretching by focusing on how different frequencies impact epithelial cell morphology and migration. While higher frequencies (1 Hz and 0.5 Hz) did not significantly alter epithelial cell migration speeds, subjecting cells to 0.1 Hz cyclic stretch for 30 min significantly decelerated epithelial movements over a 6-h observation period.
By quantifying changes in cell morphology and migration, we obtained new information about collective epithelial behavior during cyclic stretch. Previous studies reported that epithelial cells reorient their shapes in response to cyclic stretch, even among different conditions16,18. Our results corroborate this effect, but also demonstrate a frequency dependence. Previous studies have observed a strain rate dependent response of cytoskeletal remodeling, where stress fibers have increased reorientation under increased strain and increased strain rate22,23,24. Many of these studies have utilized highly adherent cells (e.g., fibroblasts) and were stretched for longer than 30 min. In our hands, we observed apical shape reorientation under slower strain rates. A critical feature of our study is that we utilized a densely packed epithelium with mature cell-cell contacts, which was uniaxially cyclically stretched approximately 10% for only 30 min. Furthermore, we did not observe stress fibers, which do not necessarily orient with cell shape. This difference suggests that there are unique roles for strain dependent remodeling at the cell-ECM interface and the cell-cell interface. For example, perhaps the cell-cell interface is more responsive to lower rates while the cell-ECM interface is more responsive to faster rates. In a physiological context, these differences may be responsible for regulating processes such as wound repair or specific steps during tissue development. For example, stress fiber remodeling in heavily adherent cells (e.g., fibroblasts) are generally associated with wound healing55, which may experience higher rates or magnitudes of strain associated with injury. These responses may also be affected by strain magnitudes, which we did not investigate in our study. Therefore, we encourage researchers use caution when comparing the results in cell shape between this study and other cyclic stretch studies.
We also found that cells retained their cell solidity at 0.1 Hz, while cell solidity decreased in the no-stretch control and higher frequency stretch conditions. Increased cell solidity is generally associated with more solid-like epithelia56, making the reduced epithelial movements following 0.1 Hz stretch consistent with the retention of high cell solidity. Furthermore, we conclude that vinculin does not regulate the change in cell solidity. We noted that cells also experienced unique shape changes at 1 Hz that did not occur in other frequencies (Supplementary Fig. 2). These changes included increased cell circularity and increased cell shape index, suggesting increased cell fluidity. However, cell solidity cannot be used to independently make conclusions on tissue solidity. We also want to note that beyond cell-cell force modulation, other studies have demonstrated the effect of substrate stiffness on force transduction and cellular deformation57.
By conducting experiments with cells expressing a mutant E-cadherin protein (T151 cells), we demonstrated that cell migration suppression following 0.1 Hz depends on intact E-cadherin interactions at the adherens junction. Previous studies have shown that E-cadherin regulates force transfer between cells to regulate directed migration32,58. We build on these studies by extending its necessity for a response to cyclic stretch via reducing cell migration.
To understand this finding, we characterized the role of vinculin in response to cyclic stretching. Using IHC, we observed increased vinculin recruitment to cell-cell contacts under low frequency stretch (i.e., slower strain rates) and reduced vinculin recruitment under high frequency stretch (i.e., faster strain rates). This trend may help explain studies of strained cell-cell contacts; higher strain rate led to junction failure while cell-cell contacts withstood higher stresses in response to slower strain rates59. We suggest that vinculin plays a role in reinforcing junctions at slower strain rates. The recruitment of vinculin to cell-cell contacts has also been shown by others to have critical importance on epithelial function and migration36,54. By modulating collective cell migration via enhanced vinculin recruitment, small changes in vinculin can compound to have significant impacts on tissue-level physiological functions including migration during tissue development or epithelium wound healing in adult tissue.
While vinculin plays a role in stabilizing the adherens junction, it also helps stabilize the focal adhesions of cell-ECM contacts60. Recently, vinculin has been found to have an antagonistic relationship between the two regions of the cell36, i.e., by perturbing vinculin expression at cell-cell contacts, vinculin at cell-ECM contacts can be disrupted. Therefore, vinculin recruitment to cell-cell contacts observed after 0.1 Hz cyclic stretch may dysregulate vinculin at cell-ECM contacts and helps suppress cell movements. Not only was migration speed restored in the Vinculin KO cells stretched under 0.1 Hz, but subtly increased compared to the no stretch and 1.0 Hz controls. This response potentially points towards other junctions (e.g., desmosomes) besides the adherens junction in regulating epithelial migration speed, though in a contradictory manner. Another possibility is that cytoskeletal remodeling induced by cyclic stretch promoted an increase in cell migration, which is normally inhibited by vinculin. Another observation worth noting was the increase in migration speed for T151 MDCK cells and Vinculin KO MDCK cells compared to the WT MDCK cells. Other studies have also reported an increase in migration speeds for these cell lines53,54 and have attributed them to an adhesion-based friction mechanism. For example, loading of vinculin at cell-cell contacts may increase the friction coefficient for cells to reduce the migration speed. While there have been fewer studies on T151 cells, a similar mechanism is likely to occur. Previous studies have established that vinculin recruitment occurs in response to E-cadherin tension. Without physical E-cadherin linkages in T151 cells, there is a similar reduction in vinculin at the adherens junction, thus leading to the same adhesion-based friction regulation for cell motility.
An important tool we leveraged for this study was high-throughput cell segmentation. Not only did this approach significantly boost our statistical power in morphology measurements, but offered a robust method to quantify vinculin expression at cell-cell contacts with minimal user bias. For future studies (by us or others), we recommend a similar approach for quantifying expression of proteins at cell-cell contacts. The user only needs a membrane label for cell segmentation. Several computational and analytical tools (e.g., Cellpose, ImageJ, etc.) are open source.
We present here a study that (i) confirms a role for different mechanical stretch frequencies in regulating collective epithelial behavior and (ii) presents a novel role for vinculin in reinforcing cell-cell contacts under cyclic stretch. These results help elucidate differences observed across other cyclic stretch studies while helping understand the role of mechanical cues in regulating epithelial function.
Methods
Device construction
We implemented and constructed a uniaxial cell stretching device as previously reported43. The device consisted of two PDMS components: a thin PDMS membrane and a thicker PDMS top containing the vacuum and cell channels. The mold for the top portion was 3-D printed from RGD450 resin on a Stratasys Objet30. We then mixed PDMS (Dow, Sylgard 184) at a 10:1 (base: curing agent) ratio, poured it on the molds, and desiccated the PDMS for 1 h to remove air bubbles. The PDMS was then cured on the mold at 75 °C for 4 h. To assemble the device, we cut the cured PDMS from the mold and made 3 holes using a 1 mm biopsy punch. One hole was punched in each end of the middle chamber for inserting cells and cell media. A third hole was punched into one side of the outer chamber for the vacuum. The thin PDMS membrane (~125 µm/.005”, Specialty Manufacturing Inc.) was cut to the dimensions of the device top (1” × 3”), washed with 70% ethanol, then air dried with N2. Using a handheld plasma wand (Electro-Technic Products, BD-20AC), we plasma treated the PDMS membrane for 1 min, the PDMS top for 30 seconds, then the membrane for another 30 seconds. Immediately after plasma treatment, the top of the device was placed on the membrane to seal the channels. We applied 5 min of light pressure between the two PDMS bodies and reinforced the bond by placing the complete device in a 75 °C oven for 5 min. We then incubated the device with 50 µg/mL of collagen I (Corning, 354236) into the middle chamber overnight at 22 °C. The collagen was rinsed out with PBS before storing at 4 °C until cell seeding (approximately 2–24 h later). Prior to cell seeding, devices were UV sterilized for 10 min in the biosafety cabinet.
Cell culture and cell seeding
We used MDCK GII cells, Vinculin KO, and T151 mutant cells lacking the extracellular domain of E-cadherin both in the same MDCK GII background, as reported previously in ref. 45,50,52. Vinculin KO cells have been previously validated via western blot analysis52. GFP E-cadherin MDCK and Vinculin KO cells were cultured in low glucose DMEM (ThermoFisher, 11885084) supplemented with 10% fetal bovine serum and 1% penicillin-streptomycin at 37˚ C with 5% CO2. Approximately 400,000 cells in 400 µL of cell culture media were seeded in the device 36–48 h prior to experiments to create densely packed confluent monolayers. Approximately 15 h prior to experiments, culture media was replaced with phenol-red-free homemade basal medium (see full reagent list in SI) supplemented with 10% fetal bovine serum, 1% penicillin-streptomycin, and 50 mM HEPES to buffer the cell culture media during long-term microscopy.
T151 MDCK E-cadherin mutant cells were cultured under the same conditions, except for the addition of 20 ng/mL of doxycycline to the culture media. Addition of doxycycline represses the genetically modified promoter region of the mutant gene to maintain a wild-type phenotype in culture conditions50. For experiments, doxycycline was removed from the media during device seeding, approximately 36 h before the experiment.
Cyclic stretching experiments
The MDCK epithelium was imaged and cyclically stretched in a temperature-controlled chamber (37 °C) of a Zeiss AxioObserver 7 inverted microscope. To cyclically stretch the epithelium, a vacuum tube connected to an electronic pressure controller (from Red Dog Research) was inserted into the hole in the vacuum chamber of the device. The controller is programmed to apply 0 to 60 kPa of pressure in a sinusoidal wave at variable frequencies (0.1 Hz, 0.5 Hz, or 1 Hz depending on the experiment). The vacuum was supplied by a standard in-house vacuum line. We utilized a custom 3-D printed holder to prevent the device from sagging during imaging, which also kept the membrane suspended during cyclic stretch. Following 30 min of stretch, we vented the vacuum line to remove excess pressure and removed the vacuum tube prior to imaging. Approximately 8 images (488 nm and phase contrast) of the monolayer were taken before and after cyclic stretch with both 10x and 20x objectives. After post-stretch imaging, we immediately set up the microfluidics perfusion system for our 6-h observation period. First, we placed the device on a 500 µm thick glass slide (SPI Supplies, 01018T-AB) to keep the membrane from drifting out of plane during perfusion. A syringe pump perfused cell media (as described in cell culture and cell seeding) through 1/32” inner diameter Tygon tubing (McMaster-Carr, 6546T23) into and out of the main cell channel before traveling into a waste beaker. 90-degree blunt needles (McMaster-Carr, 75165A65) connected the tubing to the channel holes via Luer Lock connections. The syringe pump was set to a rate of 0.3 mL/h. At the onset of perfusion, we began imaging the device. Each device was imaged at 3 regions of the channel every 5 min for 6 h with a phase contrast 10x objective. To avoid potential edge effects of the stretched membrane on cell migration, we imaged near the center of the PDMS membrane.
Particle image velocimetry analysis
The resulting phase contrast images from the 6-h timelapse were aligned to remove thermal drift during imaging (ImageJ, linear stack alignment with SIFT). The images were then cropped to 1700 by 1150 pixels before being analyzed with PIV (MATLAB PIVlab 2.58, The MathWorks). PIVlab used particle image velocimetry to determine the movement of the cells within the images. The analysis in PIVlab used a FFT Window Deformation algorithm with a Gauss 2 × 3 point sub-pixel estimator. The interrogation pass sizes were 200, 100, and 50 for each of the three passes respectively, and each had a 50% overlap per step. In post processing vector validation, we used a standard deviation filter of 4 and a local median filter of 5. The velocity data was averaged over each frame using original MATLAB code. Migration distances were calculated using averaged velocities and the time between images. To validate the use of our PIV analysis, we calculated the total vector displacement of a known displaced object. We used a micromanipulator to laterally displace a 30 µm glass bead 13.38 µm (manually measured by ImageJ) across 6 images. Using PIV, we calculated the displacement of the bead between each image and achieved a result of 13.18 µm, within an acceptable range of the manually measured displacement.
Correlation length analysis
To quantify the spatial correlation of speeds throughout the monolayer, we determined the correlation length of the speed deviations across all points of a monolayer’s velocity fields54. The speed deviation, ({u}_{i}(t)), is defined as the magnitude of the velocity, ({v}_{i}(t)) at point (i) in the velocity field of an image at time (t) minus the average magnitude of the velocity across all points of that time. This relationship is represented by the following equation where the angle brackets denote the average over all points in the velocity field: ({u}_{i}left(tright)={v}_{i}left(tright)-leftlangle v(t)rightrangle). The spatial correlation coefficient was calculated between the speed deviation at reference point (i) and the speed deviation ({u}_{j}(r,t)) derived from the average velocity of all points a radial distance (r) away at the same timepoint. This can be written as the equation: ({u}_{j}left(r,tright)=langle {v}_{j}left(r,tright)rangle -langle vleft(tright)rangle), where (langle {v}_{j}left(r,tright)rangle) represents the average speed a distance (r) from the reference point. The normalized spatial correlation coefficient, (C), is calculated at each timepoint with relation to the radial distance between points, (r), in Eq. (1):
The correlation coefficient was computed at each grid point (i) of the velocity field and the angle brackets represent how the numerator and denominator were averaged over all references for a given distance, (r). The radial distances were binned into sections of 14.75 µm, resulting in an average speed (langle {v}_{j}(r,t)rangle) at a distance r from a reference point. The distance was incrementally increased up to 1180 microns, covering the total area of the image. To express the correlation coefficient as a function of distance, the results for the monolayer were time-averaged for each distance: (Cleft(rright)=leftlangle C(r,t)rightrangle). The correlation length was extracted from the correlation coefficient by solving for (Cleft(rright)=0.1)54.
Immunohistochemistry and imaging of stained devices
Devices were fixed after 4 different conditions: (i) Immediately after 30 min of cyclic stretch, (ii) immediately after 30 min of no cyclic stretch, (iii) 30 min after 30 min of cyclic stretch, (iv) or 30 min after 30 min of no cyclic stretch. 2 devices were stained for each condition. For the conditions involving an extra 30 min of relaxation, the devices were placed in the cell culture incubator before fixing and staining. All devices were washed with PBS before being fixed for 15 min in 4% formaldehyde (ThermoFisher 28908), diluted in PBS. The formaldehyde was then thoroughly washed out with PBS. For permeabilization, we used a buffer consisting of 0.1% Triton X-100 in PBS in the devices for 5 min at room temperature. Permeabilization was followed by a 1 h blocking step at room temperature, using a buffer consisting of 0.3% Tween20 (1X) and 2% BSA in PBS. Primary antibodies were incubated in the devices overnight at 4 °C, following by a wash with 0.1% Tween20 (1X) and 1% BSA in PBS. Secondary antibodies were then incubated with the devices for 1 h at room temperature in the dark. Finally, the devices were washed with 0.1% Tween20 (1X) and 1% BSA in PBS before being stored in PBS for imaging.
All devices were imaged using a 20× air objective (NA = 0.8) and a 63x oil immersion objective (NA = 1.2) on a Zeiss AxioObserver 7 widefield microscope. 3 separate regions were imaged per device using the following excitation filters (Vinculin:405 nm, E-cadherin: 488 nm, Vinculin: 647 nm). Each image was aligned to the apical surface of the epithelium.
High-throughput cell segmentation and ROI filtration
All images used for cell segmentation were taken using a 20× air objective (NA = 0.8) and were labeled with a fluorescently tagged for E-cadherin to denote the cell-cell boundary. We utilized the CellPose “cyto” model61 with a calibration of 50 pixels per image while excluding cells on edges. ImageJ’s LabelsToROIs plugin was used for shape analysis.
After segmentation, the masks were saved as PNG files and run through the LablesToROIs plugin in ImageJ, which calculated the shape descriptors for each cell per image. Cells having an area below 2 µm2 or above 2000 µm2 were filtered out of the data sets using a custom Python script. Per shape descriptor (e.g., area, aspect ratio, solidity) all cells were then averaged per image (~2000 cells/image). The fitted length for cell shape measurements was determined using ImageJ’s bounding rectangle feature.
For Vinculin KO experiments, cell segmentation was determined using a CellMask Deep Red plasma membrane stain (ThermoFisher, C10046). CellMask was incubated at a 1:1000 dilution for 10 min before being washed out and replaced with imaging medium, after which the experiment was performed immediately.
Analysis of vinculin localization at cell-cell contacts
First, the E-cadherin labeled images from the 63x oil immersion objective were segmented using Cellpose, as described in high-throughput cell segmentation. Using the LabelsToROIs plugin in ImageJ, the segmented masks were overlaid onto the corresponding vinculin labeled images. Segmented masks were then processed under 2 separate conditions: i) masks were eroded 3 pixels to remove the cell-cell contact or ii) masks were eroded 0 pixels to contain the entire cell, including the cell-cell boundary. The corresponding mean fluorescence intensities of vinculin were calculated for each cell under each condition (i.e., the mean fluorescence intensity of vinculin in the entire cell and the mean fluorescence intensity of vinculin excluding the cell-cell contact).
To determine the mean fluorescence intensity of vinculin at the cell-cell contacts, we calculated the approximate area fraction of the 3-pixel eroded cell to be 0.91 (Supplementary Fig. 6). For IHC studies of higher stretch frequencies which utilized separate controls, the area fraction was 0.94. This area fraction allowed us to calculate the mean fluorescence intensity at the cell-cell contacts.
Antibodies
The following primary antibodies were used as previously demonstrated in MDCK cells: purified mouse anti-p120 catenin62 (BD Biosciences, 610133) at a dilution of 1:200 and recombinant rabbit monoclonal anti-vinculin36 (abcam, ab129002) at a dilution of 1:100. The following secondary antibodies were used, both at a 1:500 dilution: Goat anti-Mouse IgG Alexa Fluor 647 (Invitrogen, A32728) and Goat anti-Rabbit IgG Alexa Fluor 405 (Invitrogen, A-31556). Antibodies were diluted in PBS + 0.1% Tween20 (1X) + 1% BSA.
Statistics
Statistics were generated from a two-tailed student t-test assuming equal variance. For PIV migration data that exhibited a non-normal distribution as determined by the Shapiro-Wilk test, we used a Mann-Whitney U test (OriginPro 2022b, OriginLab). P values are denoted as *p < .05; **p < .005; ***p <.0005. Dotted lines in all violin plots represent the 25th/75th percentiles of data distribution, while the solid lines represent the mean. Shaded regions in all 6-h migration observation plots represent the 95% CI. I-bars in all scatter plots represent the mean ± SD. For each independent experiment, we imaged 2–4 different regions across the epithelium when observing migration. For segmentation analysis, approximately 8 different regions of the epithelium were imaged per device.


Responses