Dating of Jingdezhen blue and white porcelain based on transfer learning and imaging spectroscopy techniques
Introduction
The development of blue and white porcelain has a long history, from Yuan to Xuantong periods at the end of the Qing Dynasty, and the number of heirlooms and excavations in successive dynasties is countless, while the differences in the era, cobalt blue pigment, craftsmanship, and place of origin make blue and white porcelain look and style different1,2. Blue and white porcelain is one of the most accomplished varieties of Chinese porcelain, representing the pinnacle of ancient Chinese porcelain art and enjoying a worldwide reputation3. Because of its unique status and influence, the study of blue and white porcelain, especially the classification of Jingdezhen blue and white porcelain from successive dynasties, has high academic and socioeconomic value4. Currently, the main methods of dating blue and white porcelain are based on experience or physical measuring devices5,6,7,8,9. The visual appraisal method mainly relies on the appraiser’s eyesight and sense of touch and is prone to misjudgment, while the method based on physical measurement equipment will cause damage to the cultural relics4, but also by the accuracy and specificity of the elemental characteristics of the limitations of the study of the cultural relics of the requirements of nondestructive10,11.
In recent years, imaging spectroscopy has gained increasing significance across various fields of visual data analysis, playing a pivotal role in these domains. Integrating deep learning with imaging spectroscopy offers a novel approach to addressing spatial and spectral challenges12,13. Transfer learning is a machine learning paradigm that facilitates knowledge transfer from a source domain to a target domain, enabling the application of different but related problems14,15. With advancements in computational power and the availability of extensive datasets, transfer learning has proven effective in classifying ceramics, yielding promising results16,17. Deep learning enabled the extraction of higher-dimensional and more abstract features through training, demonstrating strong capabilities for identification in the context of cultural heritage preservation. Numerous studies have successfully employed deep learning to classify and identify porcelain18,19. Methods and techniques within hyperspectral primarily rely on the intricate spectral characteristics captured by imaging spectrographs. Given the rapid and nondestructive nature of imaging spectroscopy, this technology not only plays a crucial role in preserving individual cultural relics but has also been recognized for its potential in forgery detection20,21,22,23. Despite the widespread application of hyperspectral technology in various fields and its effectiveness in the compositional identification of numerous materials, there is a notable lack of studies focused on the qualitative classification and identification of Jingdezhen blue and white porcelain. This underscores the considerable potential and application value of hyperspectral technology in preserving cultural heritage and identifying counterfeit Jingdezhen blue and white porcelain.
In order to quickly and non-destructively identify the chronology of Jingdezhen blue and white porcelain, this paper proposes an identification model based on transfer learning for imaging spectral data, which can achieve excellent identification results in the case of small samples. This method is different from the multimodal research combining different rays on cultural heritage protection24,25, which uses the classification knowledge learned on large datasets through the transfer learning and adjusts the structure of the classical network model to improve the classification efficiency and enhance the quality of classification, which can not be better utilized for the classification task of Jingdezhen blue and white porcelain, such as the image information of the porcelain’s textures, styles, and shapes, as well as the reflected spectral information, the spatial dimension image data and spectral dimension reflectance spectral data of imaging spectra are fused as the benchmark, and the advantages of imaging spectroscopy to learn the image information and spectral information of blue and white porcelain at the same time are utilized to ultimately carry out the chronological identification of Jingdezhen blue and white porcelain, which provides a brand-new methodology and idea for the nondestructive identification and classification of cultural relics.
Research methods and principles
Transfer learning for Jingdezhen blue and white porcelain age classification models
Transfer learning is transferring knowledge from a source domain to a target domain, a way of taking a certain trained network and adapting it to make this network applicable to another new task26. In this study, we mainly use transfer learning to successfully apply the image classification knowledge learned by the model on the large dataset ImageNet27 to the new target classification task to be solved, using the decorations, models, and shapes of Jingdezhen blue and white porcelain of different ages as the image feature labels and taking the existing classical image classification network model as the basis of the newly constructed model. We freeze the parameter layer of the classical image classification network model and then construct a new model for the classical image classification network by freezing the parameter layer of the classical image classification network model. By freezing the parameter layer of the classical image classification network model and then fine-tuning the structure of the convolutional model locally28, the classification model of Jingdezhen blue and white porcelain in this study was constructed, and the final classification and recognition results were obtained. Transfer learning shortens the pretraining timeframe, which can significantly improve the model classification efficiency and enhance the quality of the classification task.
Construction of Jingdezhen blue and white porcelain age classification models
Classification model of Jingdezhen blue and white porcelain based on image data
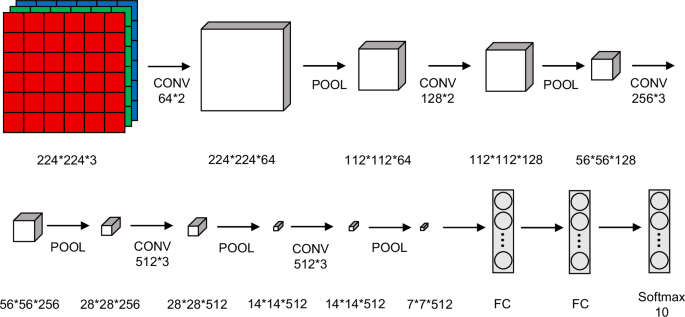
Based on the image data, we constructed a classification model for Jingdezhen blue and white porcelain of different ages. First, preprocessing operations are performed on Jingdezhen blue and white porcelain image data of different ages. Then, the VGG1629 and ResNet5030 network models are adjusted by freezing all the parameters of the model’s convolutional layer, modifying only the last layer of the model, i.e., the fully connected layer of the model, and modifying the number of output categories of the original network to 10. Finally, the network model is trained using transfer learning, the fully connected layer is modified, the stochastic gradient descent (SGD) optimization algorithm is selected, and the cross-entropy loss function is selected. The structures of the VGG16 and ResNet50 network models are shown in Figs. 1 and 2.
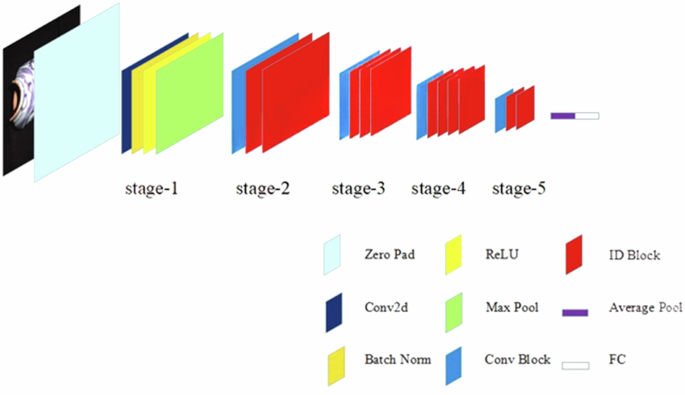
Network model structure of VGG16.
Network model structure of ResNet50.
Classification model of Jingdezhen blue and white porcelain based on spectral data
The classification model for Jingdezhen blue and white porcelain of different ages were constructed based on spectral data. The regions of cobalt blue pigment on the pieces of Jingdezhen blue and white porcelain of different ages are taken as the regions of interest. The data of 450 bands in the range of 350–950 nm for different ages of cobalt blue pigments were selected using four feature mining methods, namely stepwise discriminant analysis, competitive adaptive resampling, continuous wavelet transform, and spectral feature parameter-based method, and two classification methods, namely random forest and long short-term memory (LSTM) artificial neural network, the combination of the different feature mining methods with the classification methods were combined and compared. Finally, the stepwise discriminant analysis31,32,33,34 combined with a LSTM artificial neural network35 was chosen, with a learning rate of 0.001 for the long short-term memory artificial neural network, a batch size of 2, and an optimizer of Adam. The optimizer was Adam, and the loss function was a cross-entropy loss function. The structure of the LSTM network model is shown in Fig. 3.
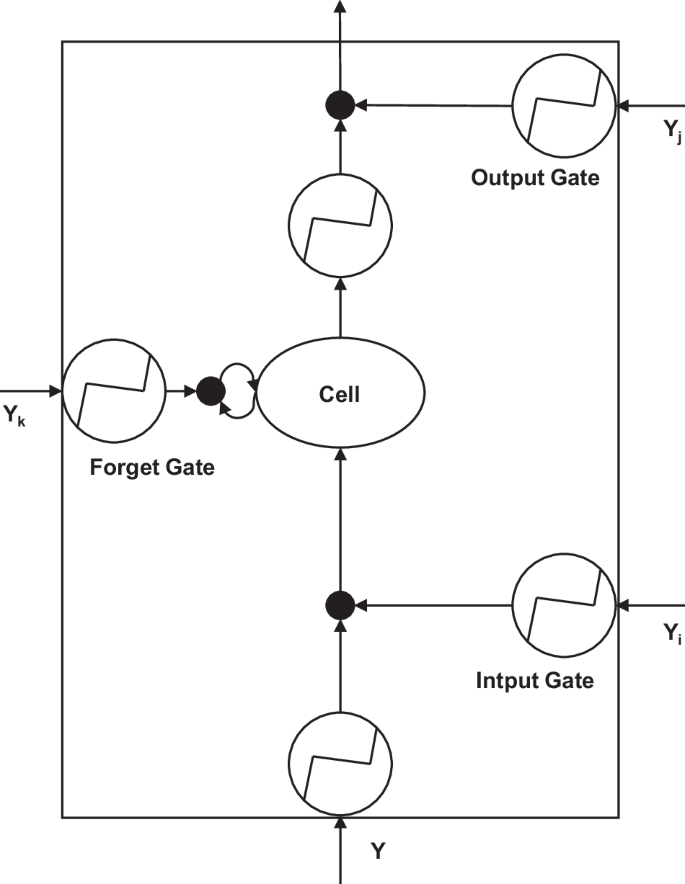
Network model structure of LSTM.
Classification model of Jingdezhen blue and white porcelain based on image and spectral union data
Based on the image and spectral union, we constructed a classification model for Jingdezhen blue and white porcelain of different ages. The spatial dimension and spectral dimension data of Jingdezhen blue and white porcelain fragments were obtained by an imaging spectrometer, and the imaging spectral data of Jingdezhen blue and white porcelain fragments were imported into the above two classification models from the spatial and spectral dimensions, respectively, to verify the accuracy. Using DS evidence theory fusion36, the spatial and spectral dimensions of the imaging spectral data were fully fused to generate a set of discriminative probabilities of the samples to be tested, thus perfecting the process of classifying different ages of Jingdezhen blue and white porcelain using the spatial or spectral dimensions of the imaging spectral data alone. The information process diagram of the fusion of the DS evidence theory is shown in Fig. 4.
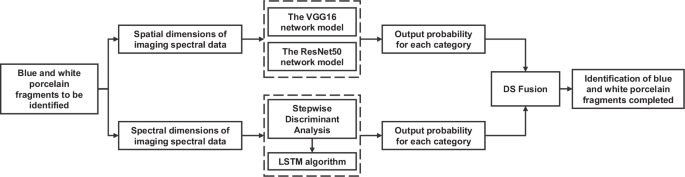
The DS evidence theory fusion information process diagram.
DS evidence theory is built on a nonempty set θ. The set θ is called the hypothesis space, and all elements in the set θ satisfy mutual independence between them, and for any proposition X, it should belong to 2θ. The basic confidence assignment n on 2θ is defined as follows: 2θ belongs to [0,1], and n is satisfied:
where n(X) denotes the degree to which the evidence supports the occurrence of proposition X.
For k evidence corresponding to the basic confidence assignments n1, n2, n3, ……, nk, the evidence theory synthesis formula is as follows:
where (sum _{cap {X}_{i}=X}mathop{prod }nolimits_{j=1}^{k}{n}_{j}({X}_{i})) denotes the conflict between evidence and 1-K is the normalization factor.
Jingdezhen blue and white porcelain dataset establishment
The blue and white porcelain of different periods are different in times, cobalt blue pigments, techniques, and origin. Due to these differences, the Jingdezhen blue and white porcelain from different periods can be distinguished. The Jingdezhen blue and white porcelain in the same period had slight differences in different historical stages, such as in the early, middle, and late stages, the raw materials and processes led to slight differences in the products, but similar changes in the same period were very rare, mainly the transition period of imported cobalt blue pigments into local cobalt blue pigments37,38. The cobalt blue pigment used in the manufacture of Jingdezhen blue and white porcelain was relatively fixed during a period of dominance, and the identification research of the age of Jingdezhen blue and white porcelain was mainly in a certain period, rather than in different stages of a certain period. In this study, the dataset of Jingdezhen blue and white porcelain was constructed with a small sample, and the data used came from two parts. One is from the official website of the Palace Museum part of collection image data; the second is from different years of Jingdezhen blue and white porcelain fragments. In constructing the dataset, indoor measurement was selected during the measurement, and the lighting condition was stable to ensure the accuracy of the data. Use a dark bracket, good visibility conditions, and no moving objects around the measurement. Measurement personnel wore dark clothing, and the measurement personnel and instruments were backlit; the front was not shielded.
Establishment of Jingdezhen blue and white porcelain true color image dataset
The image data of Jingdezhen blue and white porcelain collections in successive dynasties on the official website of the Palace Museum, as shown in Table 1, were selected as the experimental data of the true color image dataset. Web crawler technology was used to obtain image data of Jingdezhen blue and white porcelain collections in the past dynasties from the official website of the Palace Museum. Since few pictures of Jingdezhen blue and white porcelain worldwide exist, this study focused on identifying Jingdezhen blue and white porcelain with a small amount of data. Finally, it selected image data from 10 decades to construct a true color image dataset.
In this study, data enhancement was used to expand the dataset and alleviate the problem of overfitting, and the specific methods used include random angle flipping, adding random noise, and increasing brightness and contrast. The original dataset totaled 348 images, and after data enhancement and random cropping, it totaled 7709 images; after eliminating the images that did not meet the experimental requirements, the final image data involved in the experiment totaled 5933 images, and the data were normalized to maintain consistency. To prevent data leakage when dividing the dataset, we regard each original data and its enhanced image data as a group, and the training set and the test set are randomly divided according to the ratio of 4:1. Each group of data will only be divided into the training set or the test set together, to ensure that no data leakage will affect the experimental results when dividing the dataset.
Establishment of a non-imaging spectral dataset of Jingdezhen blue and white porcelain
Due to the rarity and value of the Jingdezhen blue and white porcelain fragments, this study was based on a limited sample size. The experimental data of Jingdezhen blue and white porcelain fragments from 28 different ages were used as a non-imaging spectral dataset. The region of cobalt blue pigment on Jingdezhen blue and white porcelain fragments of different ages was taken as the region of interest by using the SVC 1024i portable ground object spectrometer in the secret room, and spectral information was collected on 450 bands in the range of 350-950 nm. After spectral noise removal, spectral resampling, and SG smoothing, spectral curves of 9 different periods of cobalt blue pigment were obtained4.
Establishment of Jingdezhen blue and white porcelain imaging spectral dataset
During the establishment of the imaging spectral dataset using the Jingdezhen blue and white porcelain fragments, the undulation of the porcelain surface led to poor quality of the imaging spectral data, and the degree of circulation of the Jingdezhen blue and white porcelain in different periods was also different. Based on the degree of circulation of Jingdezhen blue and white porcelain and data availability, we finally chose the data from JJ, WL, CH, and KX, which were the key developmental stages of Jingdezhen blue and white porcelain and had the strongest data availability, for the construction of the model. Using SOC710-vp portable visible/near-infrared hyperspectral imaging spectrometer in the chamber, the region of cobalt blue pigment on Jingdezhen blue and white porcelain fragments of different ages was taken as the region of interest, and spectral information was collected at 450 bands in the range of 350-950 nm. In this study, K-means clustering-based hyperspectral image segmentation was used to segment the blue and white porcelain from the background, and the background segmentation used the blue and white porcelain color blocks made the accuracy reach 100%. Three bands of red (620-720 nm), green (500-560 nm), and blue (430-470 nm) were randomly selected, which could express better information about the blue and white porcelain image, serving as the three bands for RGB color display. A total of 20 images with different band combinations were obtained for each image. Data enhancement and data normalization processes were then carried out, resulting in 640 spatial dimension validation samples. Some of the imaging spectral data for the four epochs WL, JJ, CH, KX are shown in Fig. 5. If the classification outputs are not in the above four periods when verifying the spatial and spectral dimensions of the imaging spectra, the samples to be classified will be categorized into others.
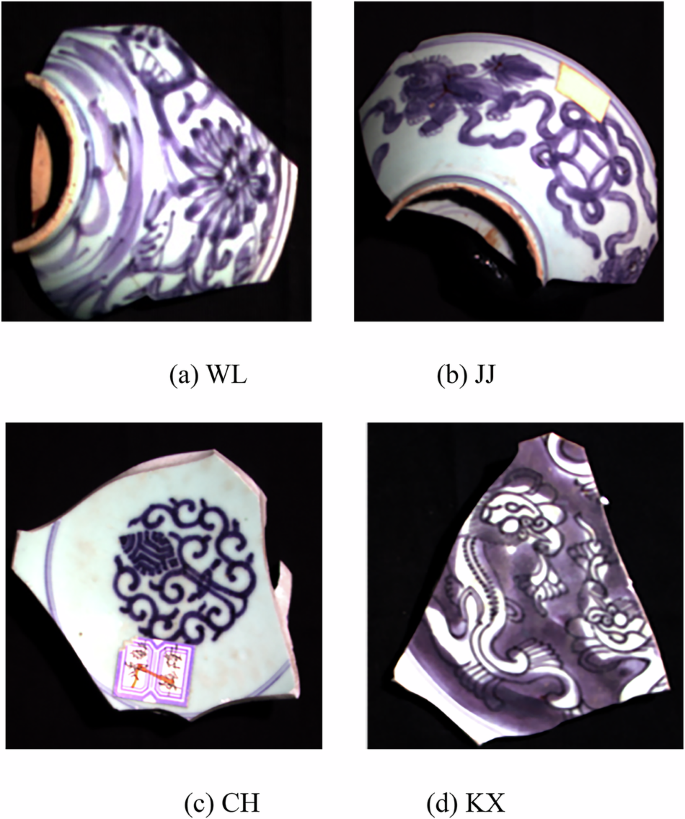
a–d The RGB images of imaging spectral porcelain samples from WL, JJ, CH, and KX periods, respectively.
The reflectance of Jingdezhen blue and white porcelain fragments was obtained by radiation correction, reflectance conversion, and SG smoothing. The selected cobalt blue pigment region was uniformly sampled, and the spectral average reflectance of the sampled region was obtained. Specifically, 160 samples were uniformly taken from different areas of cobalt blue pigments; each sample contained 9 image elements, and then 160 average spectral curves were calculated for each of WL, JJ, CH, and XK. The obtained average values were taken as the real spectral reflectance of different periods of cobalt blue pigments, which were used as the spectral dimensional data for the study of the classification of Jingdezhen blue and white porcelain. Figure 6 shows the reflectance curves of the imaging spectra of WL period blue and white porcelain, which had obvious characteristics in the visible near-infrared band.
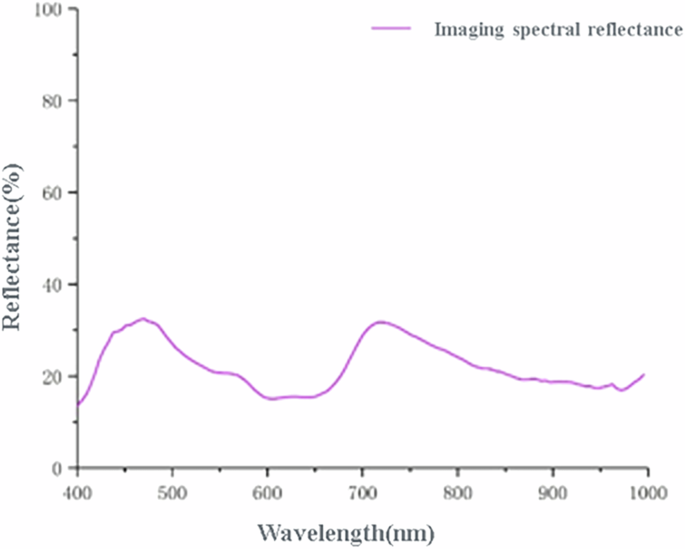
SOC spectral reflectance curve of the WL blue and white porcelain sample.
Evaluation criteria
For the classification of the Jingdezhen blue and white porcelain of different ages, this paper first deals with it through the commonly used confusion matrix, where the row sums indicate the total number of a certain category participating in the actual validation, and the column sums indicate the total number of samples predicted to be of a certain category. After constructing the confusion matrix, the parameters involved in the accuracy evaluation mainly include the following four kinds.
Accuracy
Accuracy is the percentage of correctly categorized samples to the total number of samples. The number of correctly classified samples is the sum of the diagonal of the confusion matrix, which is calculated as follows:
Where TP (True Positive) represents samples correctly predicted by the model to be in the positive category, TN (True Negative) represents samples correctly predicted by the model to be in the negative category, FP (False Positive) represents negative samples incorrectly predicted by the model to be in the positive category, and FN (False Negative) represents positive samples incorrectly predicted by the model to be in the negative category.
Recall
The recall represents the percentage of correct samples for a category compared to the total number of true samples. That is, the percentage of data on the diagonal of the confusion matrix and the sum of the values in that row. The formula is as follows:
Precision
Precision is the percentage of the number of samples correctly classified into a certain category compared to the total number of samples in the entire experiment that are classified into that category. It is the percentage of the sum of the data on the diagonal of the confusion matrix and the value of the column. The formula is as follows:
F1-score
The F1-score is the reconciled average of recall and precision, synthesizing the output results of recall and precision, and the F1-score ranges from 0 to 1. In this study, the F1-scores are expressed as percentages to express the results more intuitively, with 100% representing that the model obtains the best classification results and 0 representing that the model obtains the worst classification results. The formula is as follows:
Experimental results and analysis
Experimental platform
Different ages of Jingdezhen blue and white porcelain were classified based on VGG16 and ResNet50 deep convolutional neural network models. The experimental environment was an Intel Core I5-10400F processor with 32 GB of memory, DDR4 MHz, an NVIDIA GeForce RTX2060 independent graphics card, and 6 GB of video memory. The experiment was based on the PyTorch 1.11.0 + CUDA 10.2 network. The experimental parameters were set as follows: the process of transfer learning and fine-tuning was optimized using a stochastic gradient descent algorithm, the cross-entropy loss function was selected, the batch size was 128, the number of ResNet50 iterations in the experiment was 100, and the number of VGG16 model iterations was 80.
Analysis of the results of the age classification model for Jingdezhen blue and white porcelain image dataset
The results of using the VGG16 and ResNet50 network models to classify the test sets of Jingdezhen blue and white porcelain images of different ages were plotted through experiments, and the results were presented in the form of confusion matrices. This is shown in the following figures. Figure 7 shows the results of classification using the VGG16 network model, and Fig. 8 shows the results of classification using the ResNet50 network model.
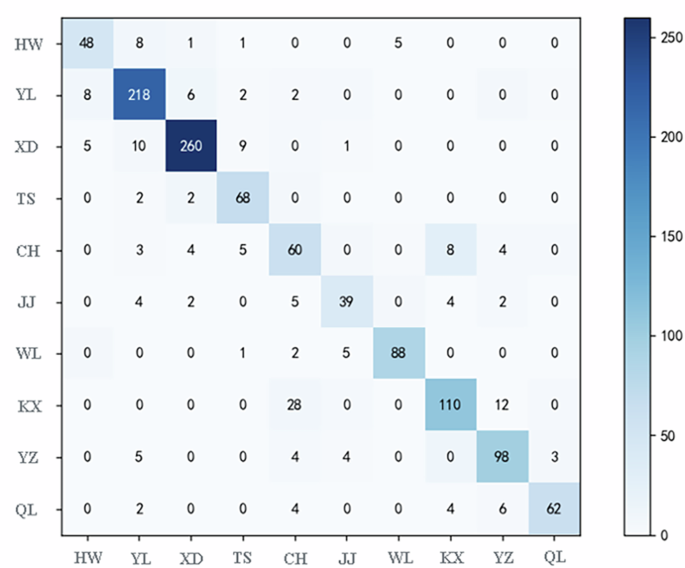
VGG16 network model classification results for the test set.
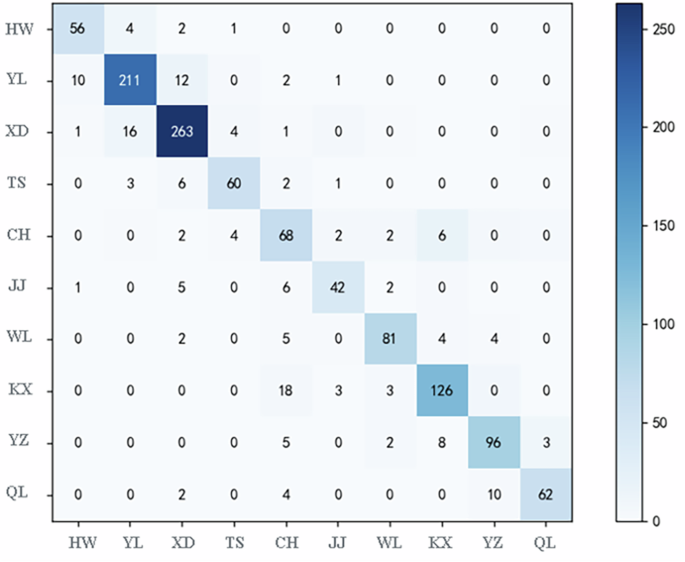
ResNet50 network model classification results for the test set.
The VGG16 network model based on transfer learning was used to classify the test set images of Jingdezhen blue and white porcelain of different ages, as shown in Fig. 7. In the 1234 selected test sample sets, the number of correctly classified samples was 1051, and the classification accuracy was 85.17%. The ResNet50 network model based on transfer learning was used to classify the test set images of Jingdezhen blue and white porcelain of different ages, as shown in Fig. 8. In the 1234 selected test sample sets, the number of correctly classified samples was 1065, and the classification accuracy was 86.30%.
The F1-scores obtained by the VGG16 and ResNet50 network models after classifying the test set images of Jingdezhen blue and white porcelain of different ages are shown in Fig. 9, and the F1-scores of the VGG16 network model and the ResNet50 network model ranged from a minimum of 63.49% to a maximum of 93.12%, respectively. The classification accuracies of the VGG16 and ResNet50 network models were 85.17% and 86.30%, respectively. This proved the feasibility of using the VGG16 network model and ResNet50 network model to classify the true color image data of Jingdezhen blue and white porcelain of different ages.
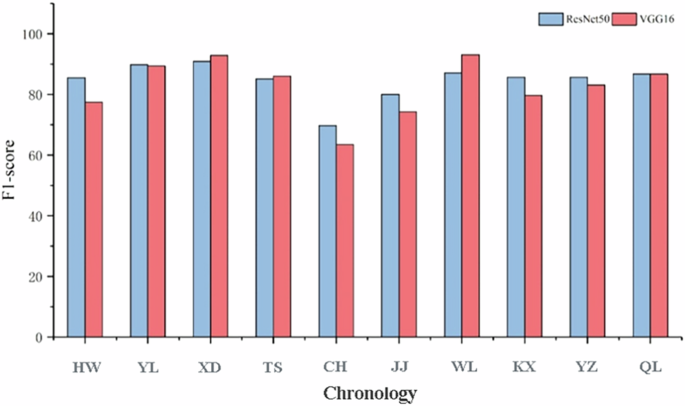
F1-score comparison of the VGG16 and ResNet50 network models.
Analysis of the results of the age classification model for the non-imaging spectral dataset of Jingdezhen blue and white porcelain
The stepwise discriminant analysis combined with a long short-term memory artificial neural network algorithm was used to classify the non-imaging spectral data of Jingdezhen blue and white porcelain of different ages. As shown in Fig. 10, the number of correctly classified samples in the selected set of 28 test samples was 25, and the classification accuracy was 89.29%. The experimental results showed that using stepwise discriminant analysis combined with a long short-term memory artificial neural network algorithm to classify the non-imaging spectral data of Jingdezhen blue and white porcelain of different ages was feasible.
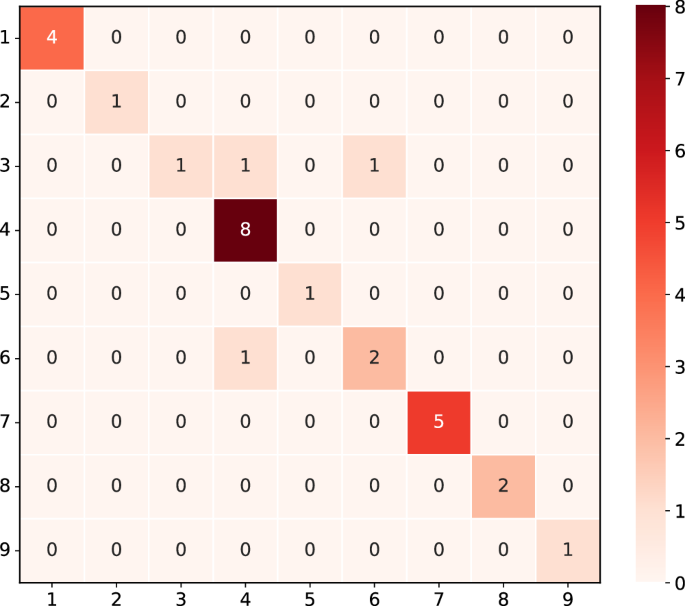
Stepwise discriminant analysis-LSTM classification confusion matrix.
Figure 11 shows the F1-scores obtained by the long short-term memory artificial neural network algorithm for classifying non-imaging spectral data of Jingdezhen blue and white porcelain of different ages. The F1-scores of the long short-term memory artificial neural network algorithms were 100% and 5, respectively, which indicated that the long short-term memory artificial neural network algorithms could be used to categorize the non-imaging spectral data of Jingdezhen blue and white porcelain of different ages.
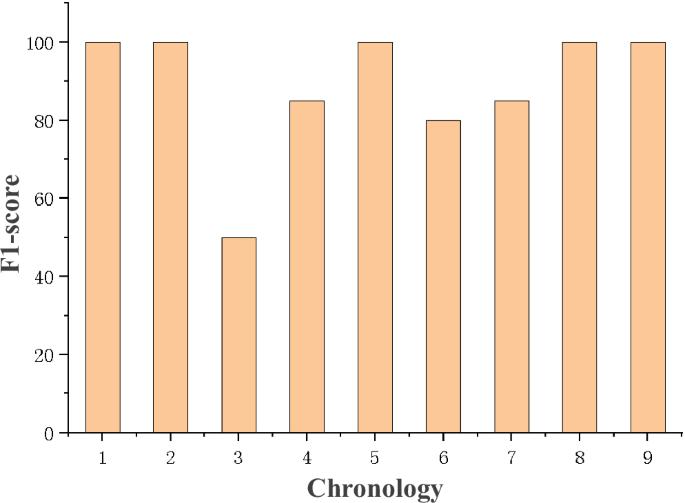
LSTM Algorithm F1-score.
Analysis of the results of the age classification model of Jingdezhen blue and white porcelain imaging spectral data
Analysis of the results of the spatial dimension imaging spectral data age classification model of Jingdezhen blue and white porcelain
Using the spatial dimension of imaging spectral data to construct image data, 640 validation samples were obtained for the four periods of JJ, WL, CH, and KX. Two models, the VGG16 network model and the ResNet50 network model, were used for validation, and the results obtained from the validation were shown in Fig. 12.
a VGG16 network model classification result for the test set. b ResNet50 network model classification result for the test set.
As shown in Fig. 12, using the VGG16 network model to classify the Jingdezhen blue and white porcelain test set images of different ages constructed by the spatial dimension of the imaging spectral data, the number of correctly classified samples in the selected 640 test sample sets was 484, and the classification accuracy was 75.63%. The ResNet50 network model was used to classify the Jingdezhen blue and white porcelain test set images of different ages constructed by the spatial dimension of the imaging spectral data; the number of correctly classified samples in the selected 640 test sample sets was 468, and the classification accuracy was 73.13%.
Figure 13 shows the F1-scores obtained by the VGG16 and ResNet50 network models after classifying the test set images of Jingdezhen blue and white porcelain of different ages, which were constructed from the spatial dimensions of the imaging spectral data. The minimum F1-scores of the VGG16 and ResNet50 network models were 76.70% and 69.31%, respectively. The classification accuracies of the VGG16 network model and the ResNet50 network model were 75.63% and 73.13%, respectively. It was proven that it was equally feasible to utilize the VGG16 network model and the ResNet50 network model to classify the different ages of Jingdezhen blue and white porcelain based on the spatial dimension of the imaging spectral data.
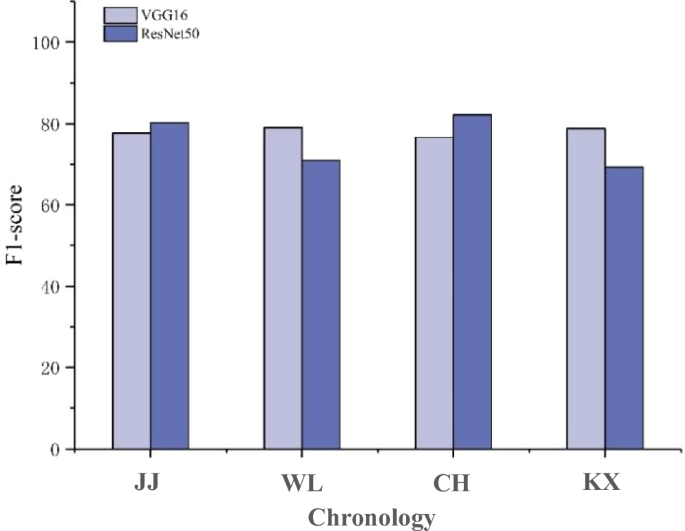
F1-score comparison of the VGG16 and ResNet50 network models.
Analysis of the results of the age classification model for the spectral dimension imaging spectral data of Jingdezhen blue and white porcelain
Experiments were conducted on 640 validation samples from four periods, namely, JJ, WL, CH, and KX, using stepwise discriminant analysis combined with long short-term memory artificial neural network algorithms to classify them, and the classification results were obtained, as shown in Fig. 14. The stepwise discriminant analysis-LSTM classification confusion matrix.
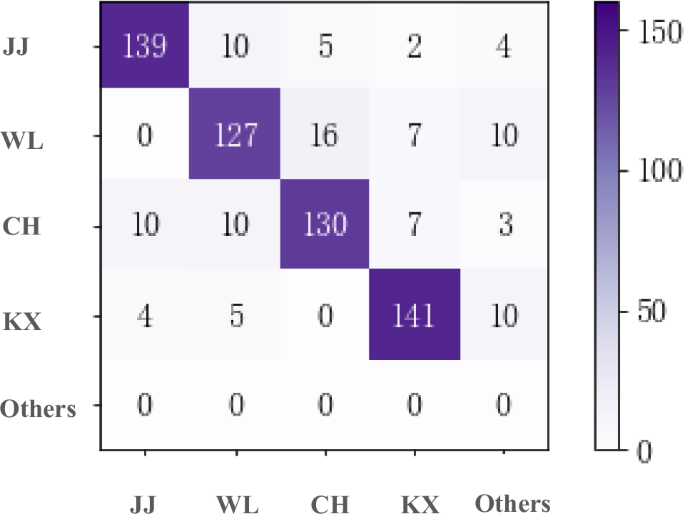
Stepwise Discriminant Analysis-LSTM Classification Confusion Matrix.
As shown in Fig. 14, the number of samples correctly classified in the selected 640 test sample sets was 537, and the classification accuracy was 83.91%. According to Fig. 15, the stepwise discriminant analysis-LSTM F1-score showed that the classification model achieved the smallest F1-score value in WL, with a minimum value of 81.41%. The combined results showed that the use of stepwise discriminant analysis combined with the long short-term memory artificial neural network algorithm to classify the different ages of Jingdezhen blue and white porcelains constructed by the spectral dimensions of imaging spectroscopic data was also feasible. The results showed that stepwise discriminant analysis combined with long short-term artificial neural network algorithms could classify Jingdezhen blue and white porcelain of different ages.
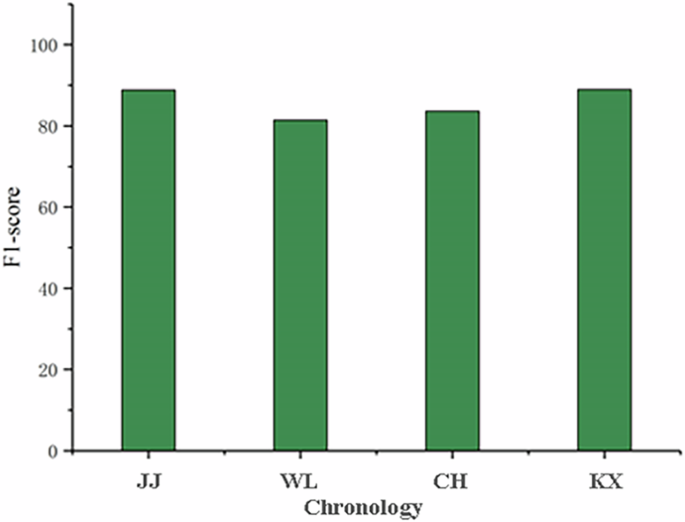
Stepwise discriminant analysis – LSTM F1-score.
Analysis of the results of the age classification model of Jingdezhen blue and white porcelain with image and spectral union
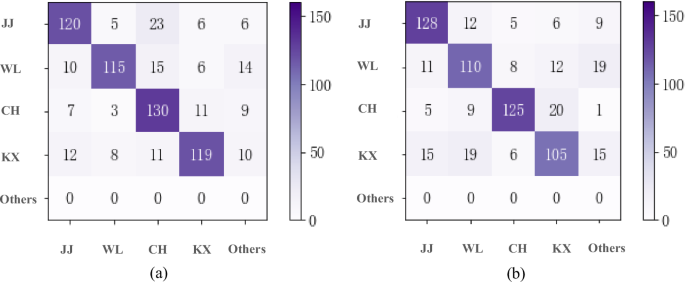
The DS evidence theory was used to fuse the results of the previous spatial and spectral dimension-based classification of Jingdezhen blue and white porcelain at different ages; one was the fusion of the VGG16 network model and stepwise discriminant analysis combined with the LSTM algorithm39 for both types of classification information, and the other was the fusion of the ResNet50 network model and stepwise discriminant analysis combined with the LSTM algorithm40 for both types of classification information. The classification results after fusion were shown in Fig. 16.
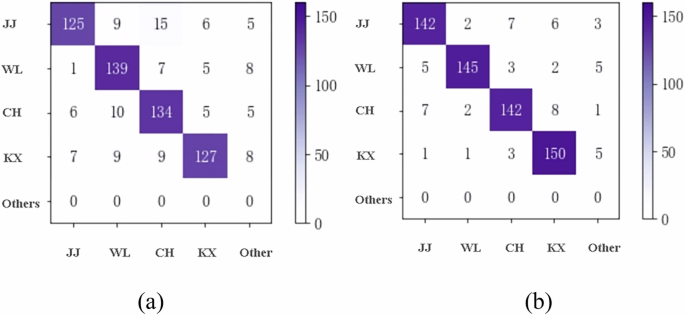
a Fusion of the VGG16 network model and stepwise discriminant analysis combined with the LSTM algorithm. b Fusion of the ResNet50 network model and stepwise discriminant analysis combined with the LSTM algorithm.
As shown in Fig. 16a, using the classification information from the fusion of the VGG16 network model and the stepwise discriminant analysis combined with the LSTM algorithm to classify the imaging spectral data of different ages of the Jingdezhen blue and white porcelain test set images, the number of samples correctly classified in the 640 test sample sets selected was 525, and the classification accuracy was 82.03%. Figure 16b shows that using the classification information from the fusion of the ResNet50 network model and the stepwise discriminant analysis combined with the LSTM algorithm to classify the imaging spectral data of different ages of Jingdezhen blue and white porcelain test set images, the number of correctly classified samples in the selected 640 test sample sets was 579, and the classification accuracy was 90.47%.
As shown in Fig. 17, the F1-scores of both methods were greater than 80%, and the minimum F1-score of both methods was 82.46%. The F1-scores of the fused ResNet50 network model and stepwise discriminant analysis combined with the LSTM algorithm were greater than the F1-scores of the fused VGG16 network model and stepwise discriminant analysis combined with the LSTM algorithm for classifying images of different ages of the Jingdezhen blue and white porcelain test sets of imaging spectral data. The F1-score of the algorithm was larger than that of the VGG16 fusion network model and stepwise discriminant analysis combined with the LSTM algorithm in each decade, indicating that the ResNet50 fusion network model and stepwise discriminant analysis combined with the LSTM algorithm were more suitable for classifying the test set of Jingdezhen blue and white porcelain images of different ages of imaging spectral data.
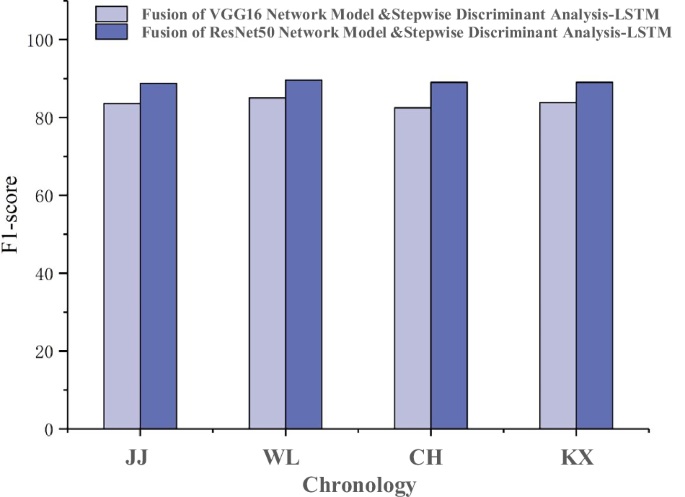
Classification after information fusion by DS evidence theory F1-score.
Table 2 shows the classification accuracy of the five methods. It could be seen that when the imaging spectral data were classified by the DS evidence theory fusion of the ResNet50 network model, the classification effect was the best for classifying the Jingdezhen blue and white porcelain data, and the classification accuracy reached 90.47%. Figure 18 compares the mean values of the Recall, Precision, and F1-score from multiple experiments of the five methods, and error bars were added. The figure shows that the F1-score of the stepwise discriminant analysis-LSTM algorithm incorporating the ResNet50 network model had fewer discrete degrees and was more stable than the other methods. From this, we could conclude that using the stepwise discriminant analysis-LSTM algorithm fused with the ResNet50 network model was the best method for performing age classification experiments on Jingdezhen blue and white porcelain from imaging spectral data.
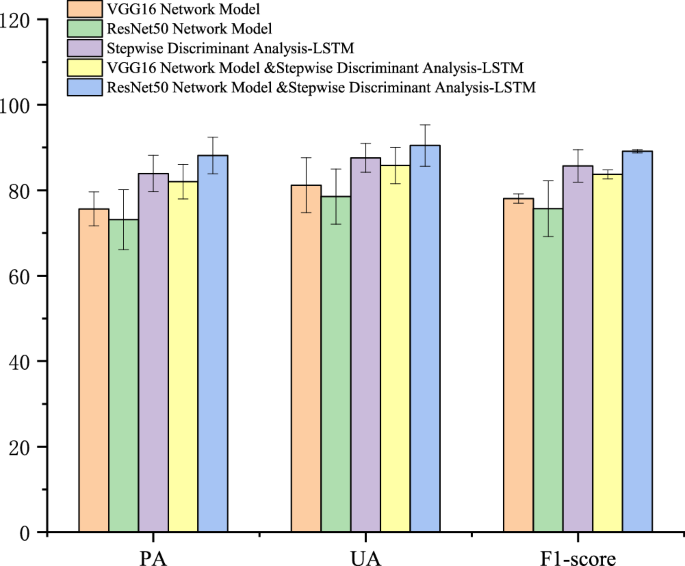
Comparison of the accuracy of different methods of evaluating indicators.
Discussion
This study is based on transfer learning and imaging spectroscopy to identify the age of Jingdezhen blue and white porcelain in the case of small samples. Based on the new age identification method of Jingdezhen blue and white porcelain, the experimental research was carried out using small samples; in fact, it had a high identification accuracy. Since it is difficult to obtain sufficient experimental samples in actual research, the new method proposed in this study, with a small number of samples, has achieved a better identification effect than the image-based and spectrum-based methods proposed in this study. In the future, when the experimental samples are more sufficient, the new method proposed in this study will have a better identification effect. It can also prove the effectiveness of our research on the age identification of Jingdezhen blue and white porcelain.
From the experimental analysis, it can be seen that the probability of test samples of a certain age being misclassified into adjacent ages is greater than that of nonadjacent ages, which may be because there is a transition period between adjacent ages in the production of Jingdezhen blue and white porcelain. The VGG16 network model and ResNet50 model have high misclassification rates between the XD and YL periods, as well as the CH and KX periods. By checking the history of Jingdezhen blue and white porcelain production and the production style, the ages of YL and XD periods are very close, with only one year’s interval. The raw material of the cobalt blue pigment comes from the same origin; the texture of Jingdezhen blue and white porcelain patterns in the YL period is more fuzzy. In contrast, the texture of Jingdezhen blue and white porcelain patterns in the XD period is clearer. The fuzzy patterns lead to inaccuracy in the extraction of the features of the classification model, which results in a high misclassification rate. When classifying the images of Jingdezhen blue and white porcelain in the KX period, the images are often misclassified in the CH period, and there is a 175-year interval between these two periods. Although the raw materials of the cobalt blue pigment of blue and white porcelain in these two periods come from different origins, the Jingdezhen blue and white porcelain of the KX period promotes the imitation of the style of the former dynasty, and the main limitation is the CH period, which is similar to that of the CH period in terms of the color, the texture of the patterns, and the shapes, and therefore it is easy to produce a high misclassification rate. When using image data to classify Jingdezhen blue and white porcelain, it is necessary to consider image clarity problems and differences in imitation styles to increase classification accuracy.
Through experiments, we found that when the spatial dimension imaging spectral data of Jingdezhen blue and white porcelain is input into the VGG16 model and ResNet50 model, the final classification accuracy is not good. Analyzing the results, we found that the spatial dimension of the imaging spectral data of Jingdezhen blue and white porcelain is inputted from the image data of blue and white porcelain fragments, which has incomplete information such as the texture and shape of the blue and white porcelain fragments, and the input model is trained with the complete picture, which leads to the poor classification accuracy in the end. In addition, the signal-to-noise ratio of the imaging spectral data is low, and the spatial resolution is not as good as that of the image data, leading to poor final classification accuracy. The different Jingdezhen blue and white porcelain classification models proposed in this study can be used for age identification analysis. When using different classification models to classify Jingdezhen blue and white porcelain, we found that Jingdezhen blue and white porcelain from a certain period achieved the highest classification accuracy. For the age classification of Jingdezhen blue and white porcelain in different periods, we can utilize the advantages of different classification models and choose the most suitable classification model for Jingdezhen blue and white porcelain in this period to better identify the age of Jingdezhen blue and white porcelain. Comparing with the existing methods for dating blue and white porcelain (e.g., XRF41, spectral analysis4, thermoluminescence dating42, etc.), the method proposed in this study has demonstrated a high accuracy rate under small sample conditions. Compared with traditional XRF analysis methods41 and spectral analysis methods4, our method is able to achieve 90.47% accuracy under small sample conditions, while XRF analysis requires sufficient samples to achieve higher accuracy, and spectral analysis methods can only reach 85% with sufficient data volume. In addition, by combining the imaging spectral data and the LSTM model, this study is able to subdivide the dating of Jingdezhen blue and white porcelain from different historical periods, while other methods can often only achieve a rough dating. For example, thermoluminescence dating42 is able to make a rough dynastic judgment, while this study is able to make a more precise chronological identification without relying on a large number of samples.
Imaging spectral data can facilitate fast, accurate, and nondestructive Jingdezhen blue and white porcelain age identification analysis. Although the spatial dimension imaging spectral data classification model of Jingdezhen blue and white porcelain imaging spectral data is not as accurate as the RGB image classification model, and the spectral dimension imaging spectral data classification model is not as accurate as the non-imaging spectral classification model, the spatial-spectral joint model that integrates the imaging spectral data can obtain higher classification accuracy and is better than the image classification model and the non-imaging spectral classification model, and the classification accuracy can reach 90.47%.
Conclusion and prospects
This study used Jingdezhen blue and white porcelain samples of different ages as the research objects. The main research conclusions are as follows:
-
(1)
Using the image or spectral data of Jingdezhen blue and white porcelain in the case of small samples, the identification model can classify the ages of blue and white porcelain, and the accuracy reaches more than 85%.
-
(2)
The imaging spectral data of Jingdezhen blue and white porcelain of different ages are input into spatial and spectral dimensional models, and the results show that the accuracy of the spectral dimensional model is obviously better than that of the spatial dimensional model but it is lower than the original accuracy of the model.
-
(3)
The fusion of spatial and spectral dimensions of imaging spectral data using DS evidence theory can significantly improve the accuracy of Jingdezhen blue and white porcelain age identification, with an accuracy reaching 90.47%.
In subsequent studies, the dataset should be expanded so that the number of images of different ages can be as consistent as possible. In this study, the spatial and spectral features were extracted separately using deep networks. To further explore the potential of the hyperspectral technology in the classification of different ages of Jingdezhen blue and white porcelain, more advanced deep models will be utilized to extract spectral and spatial features simultaneously in the following research.
Responses